Economic Report: Indian Economic Growth and Business Cycle Stages
VerifiedAdded on 2021/05/30
|16
|2542
|211
Report
AI Summary
This report provides an in-depth analysis of the Indian economy, focusing on its growth trajectory and the cyclical fluctuations it has experienced. The study examines the trends in both nominal and real GDP, as well as per capita GDP, highlighting the differences and implications of each measure. The report delves into the stages of the business cycle, illustrating how the Indian economy has moved through expansion, peak, contraction, and trough phases over several decades, from the 1960s to the 2010s. Historical data is used to demonstrate the impact of events such as droughts, global financial crises, and policy changes on GDP growth rates. A comparative analysis of India and Australia's per capita GDP is included, demonstrating the differences in living standards and the impact of population size on economic indicators. The report also explores the unemployment rates in both countries, offering a comprehensive view of India's economic performance and its progress over time.
Running Head: ECONOMIC ASSIGNMENT
Economic Assignment
Name of the Student
Name of the University
Course ID
Economic Assignment
Name of the Student
Name of the University
Course ID
Paraphrase This Document
Need a fresh take? Get an instant paraphrase of this document with our AI Paraphraser
1ECONOMIC ASSIGNMENT
Table of Contents
Indian economic growth and stages of Business cycle....................................................................2
Nominal GDP per capita and real GDP per capita..........................................................................5
References........................................................................................................................................9
Appendix........................................................................................................................................10
Table 1: GDP and per capita GDP.............................................................................................10
Table 2: Per capita GDP: India and Australia...........................................................................13
2ECONOMIC ASSIGNMENT
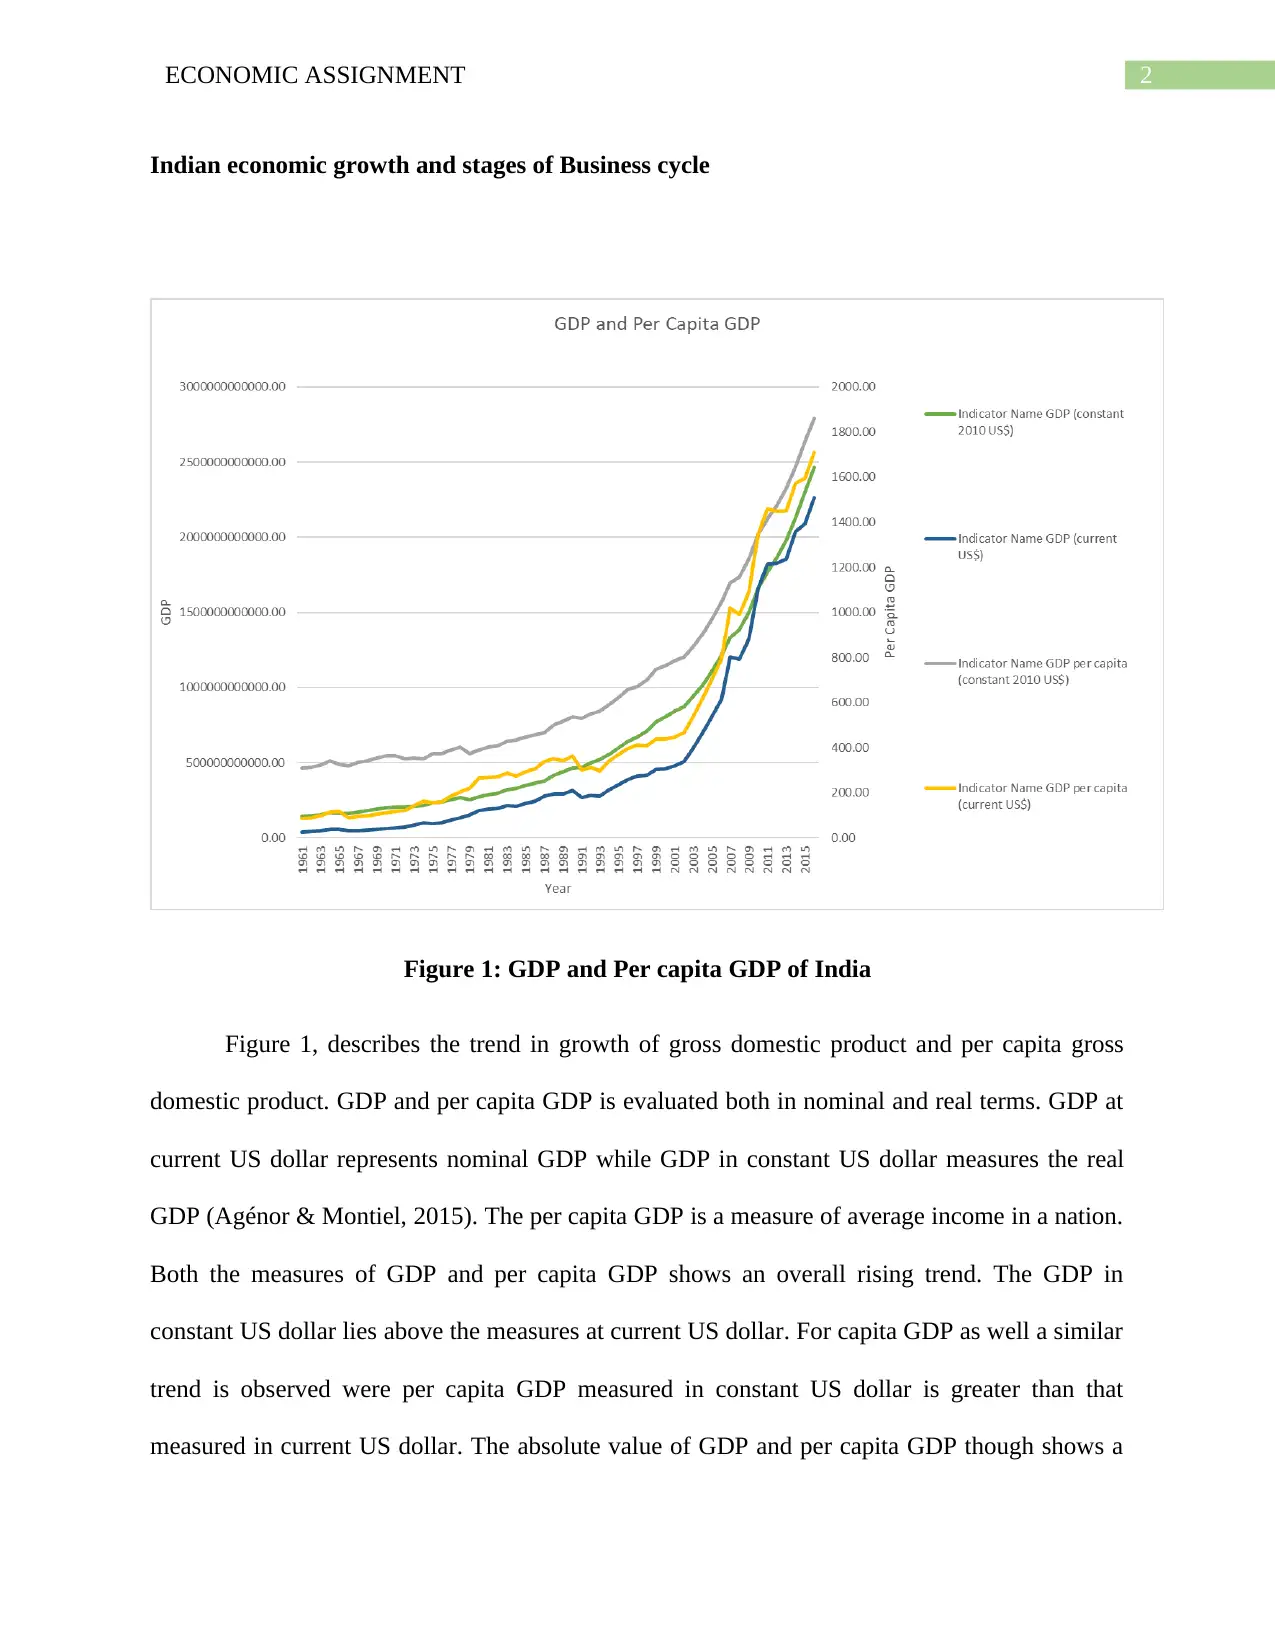
Indian economic growth and stages of Business cycle
Figure 1: GDP and Per capita GDP of India
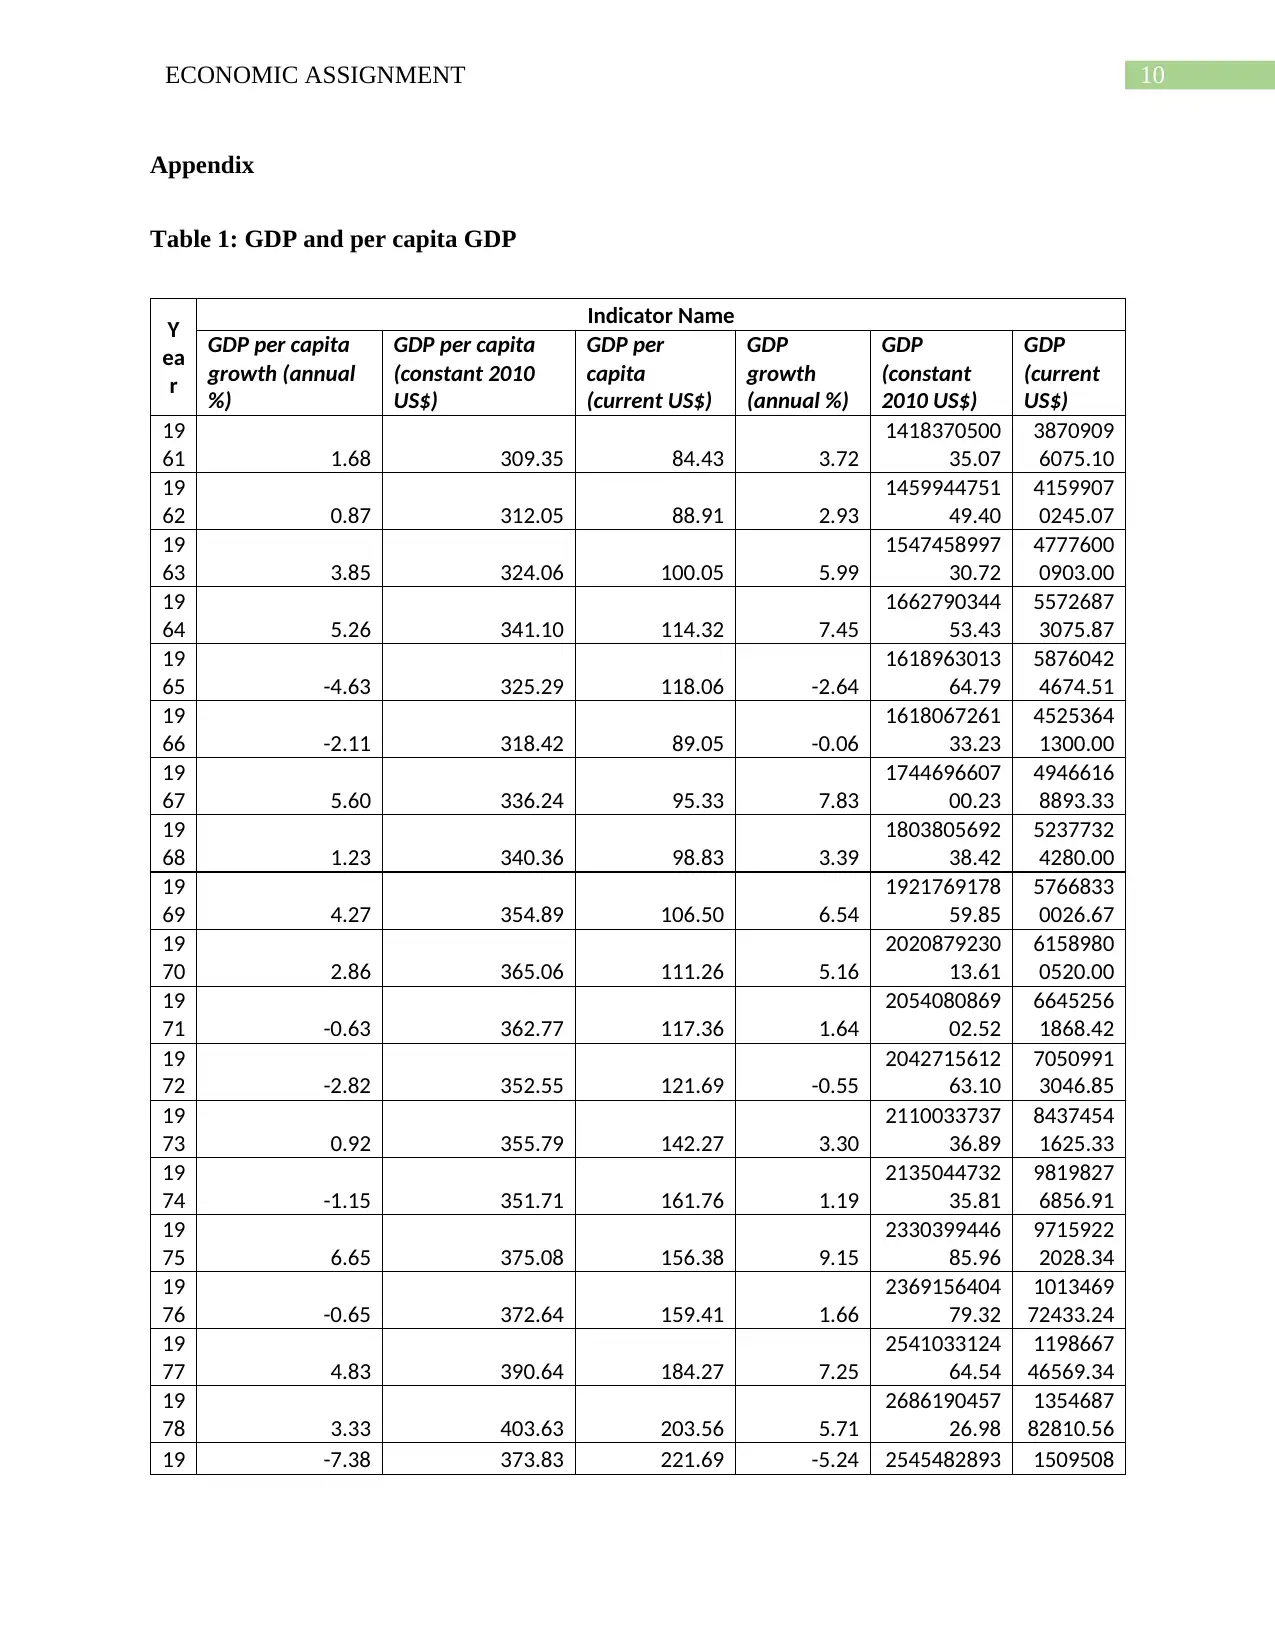
Figure 1, describes the trend in growth of gross domestic product and per capita gross
domestic product. GDP and per capita GDP is evaluated both in nominal and real terms. GDP at
current US dollar represents nominal GDP while GDP in constant US dollar measures the real
GDP (Agénor & Montiel, 2015). The per capita GDP is a measure of average income in a nation.
Both the measures of GDP and per capita GDP shows an overall rising trend. The GDP in
constant US dollar lies above the measures at current US dollar. For capita GDP as well a similar
trend is observed were per capita GDP measured in constant US dollar is greater than that
measured in current US dollar. The absolute value of GDP and per capita GDP though shows a
Indian economic growth and stages of Business cycle
Figure 1: GDP and Per capita GDP of India
Figure 1, describes the trend in growth of gross domestic product and per capita gross
domestic product. GDP and per capita GDP is evaluated both in nominal and real terms. GDP at
current US dollar represents nominal GDP while GDP in constant US dollar measures the real
GDP (Agénor & Montiel, 2015). The per capita GDP is a measure of average income in a nation.
Both the measures of GDP and per capita GDP shows an overall rising trend. The GDP in
constant US dollar lies above the measures at current US dollar. For capita GDP as well a similar
trend is observed were per capita GDP measured in constant US dollar is greater than that
measured in current US dollar. The absolute value of GDP and per capita GDP though shows a
⊘ This is a preview!⊘
Do you want full access?
Subscribe today to unlock all pages.
Trusted by 1+ million students worldwide
3ECONOMIC ASSIGNMENT
relatively smooth trend; the growth rate fluctuates widely. The fluctuation in growth rate can be
explained using the theory of business cycle.
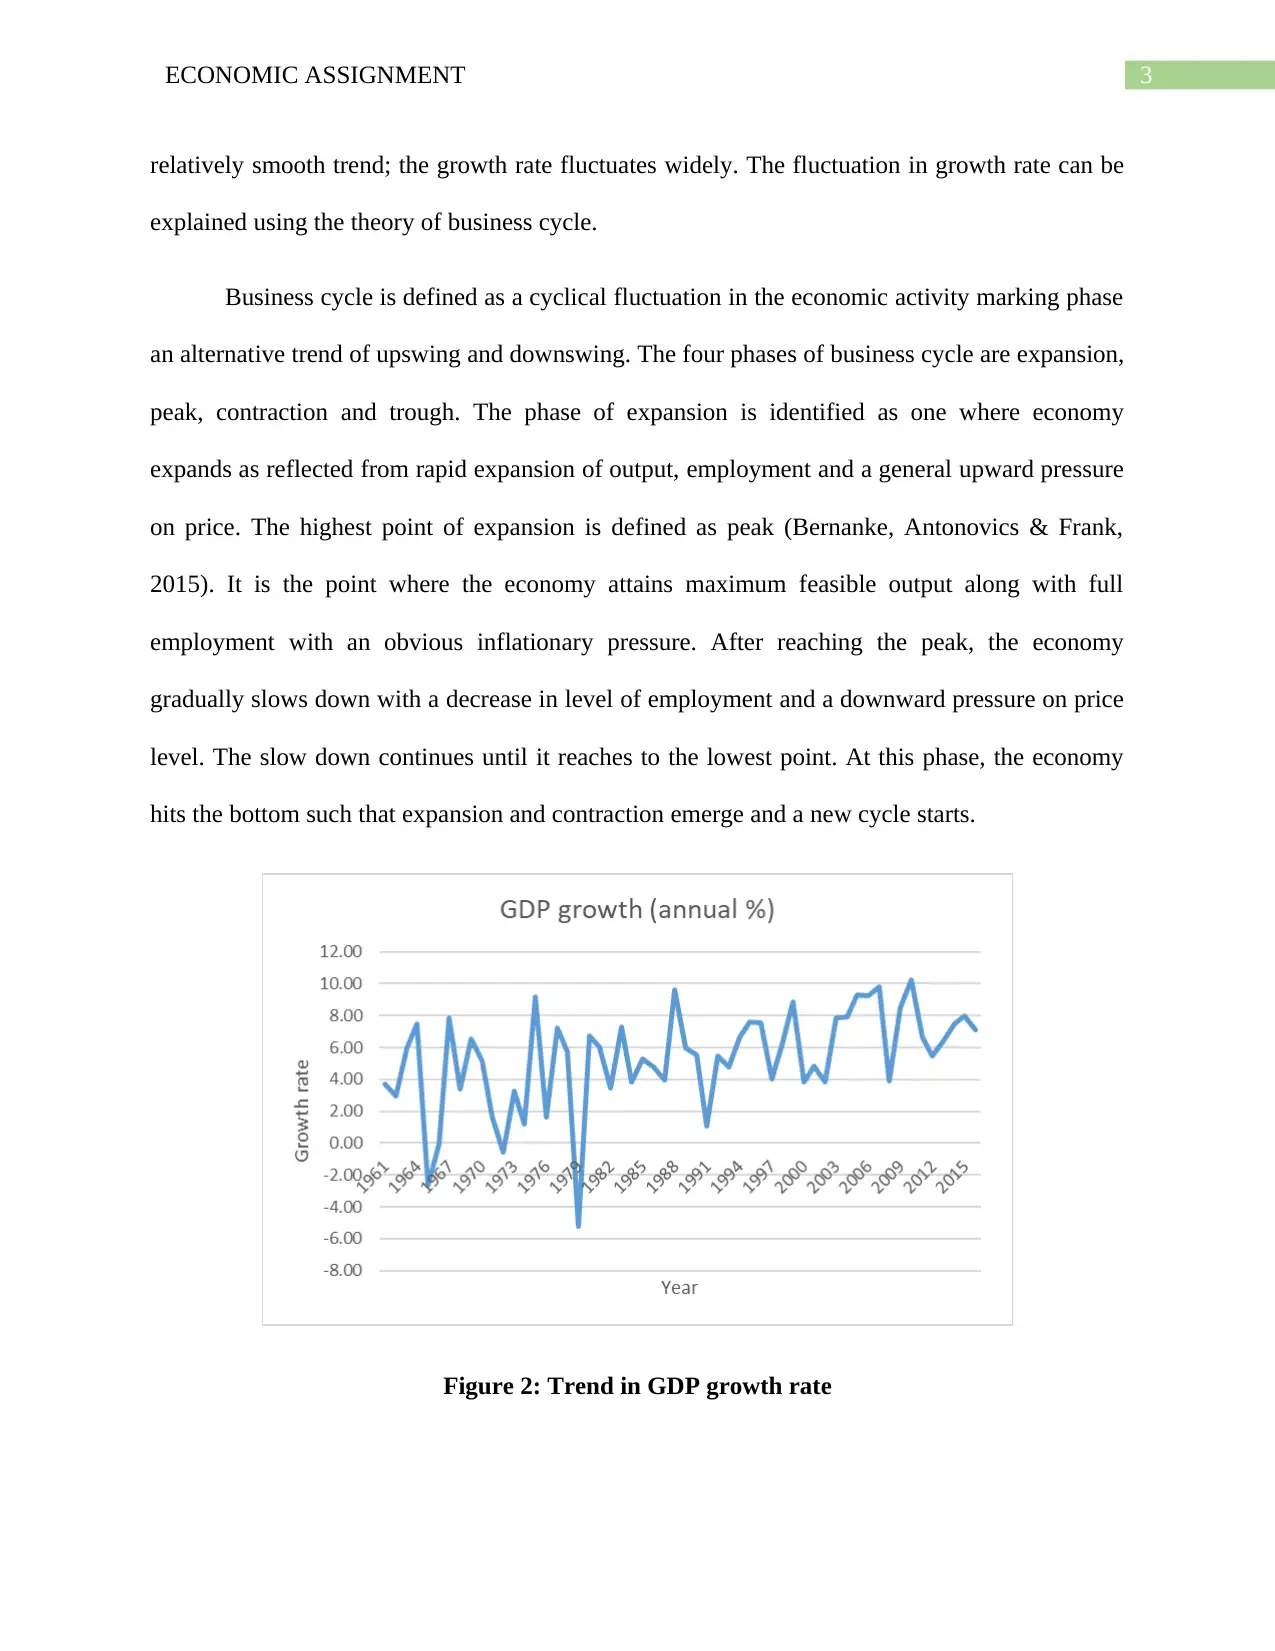
Business cycle is defined as a cyclical fluctuation in the economic activity marking phase
an alternative trend of upswing and downswing. The four phases of business cycle are expansion,
peak, contraction and trough. The phase of expansion is identified as one where economy
expands as reflected from rapid expansion of output, employment and a general upward pressure
on price. The highest point of expansion is defined as peak (Bernanke, Antonovics & Frank,
2015). It is the point where the economy attains maximum feasible output along with full
employment with an obvious inflationary pressure. After reaching the peak, the economy
gradually slows down with a decrease in level of employment and a downward pressure on price
level. The slow down continues until it reaches to the lowest point. At this phase, the economy
hits the bottom such that expansion and contraction emerge and a new cycle starts.
Figure 2: Trend in GDP growth rate
relatively smooth trend; the growth rate fluctuates widely. The fluctuation in growth rate can be
explained using the theory of business cycle.
Business cycle is defined as a cyclical fluctuation in the economic activity marking phase
an alternative trend of upswing and downswing. The four phases of business cycle are expansion,
peak, contraction and trough. The phase of expansion is identified as one where economy
expands as reflected from rapid expansion of output, employment and a general upward pressure
on price. The highest point of expansion is defined as peak (Bernanke, Antonovics & Frank,
2015). It is the point where the economy attains maximum feasible output along with full
employment with an obvious inflationary pressure. After reaching the peak, the economy
gradually slows down with a decrease in level of employment and a downward pressure on price
level. The slow down continues until it reaches to the lowest point. At this phase, the economy
hits the bottom such that expansion and contraction emerge and a new cycle starts.
Figure 2: Trend in GDP growth rate
Paraphrase This Document
Need a fresh take? Get an instant paraphrase of this document with our AI Paraphraser
4ECONOMIC ASSIGNMENT
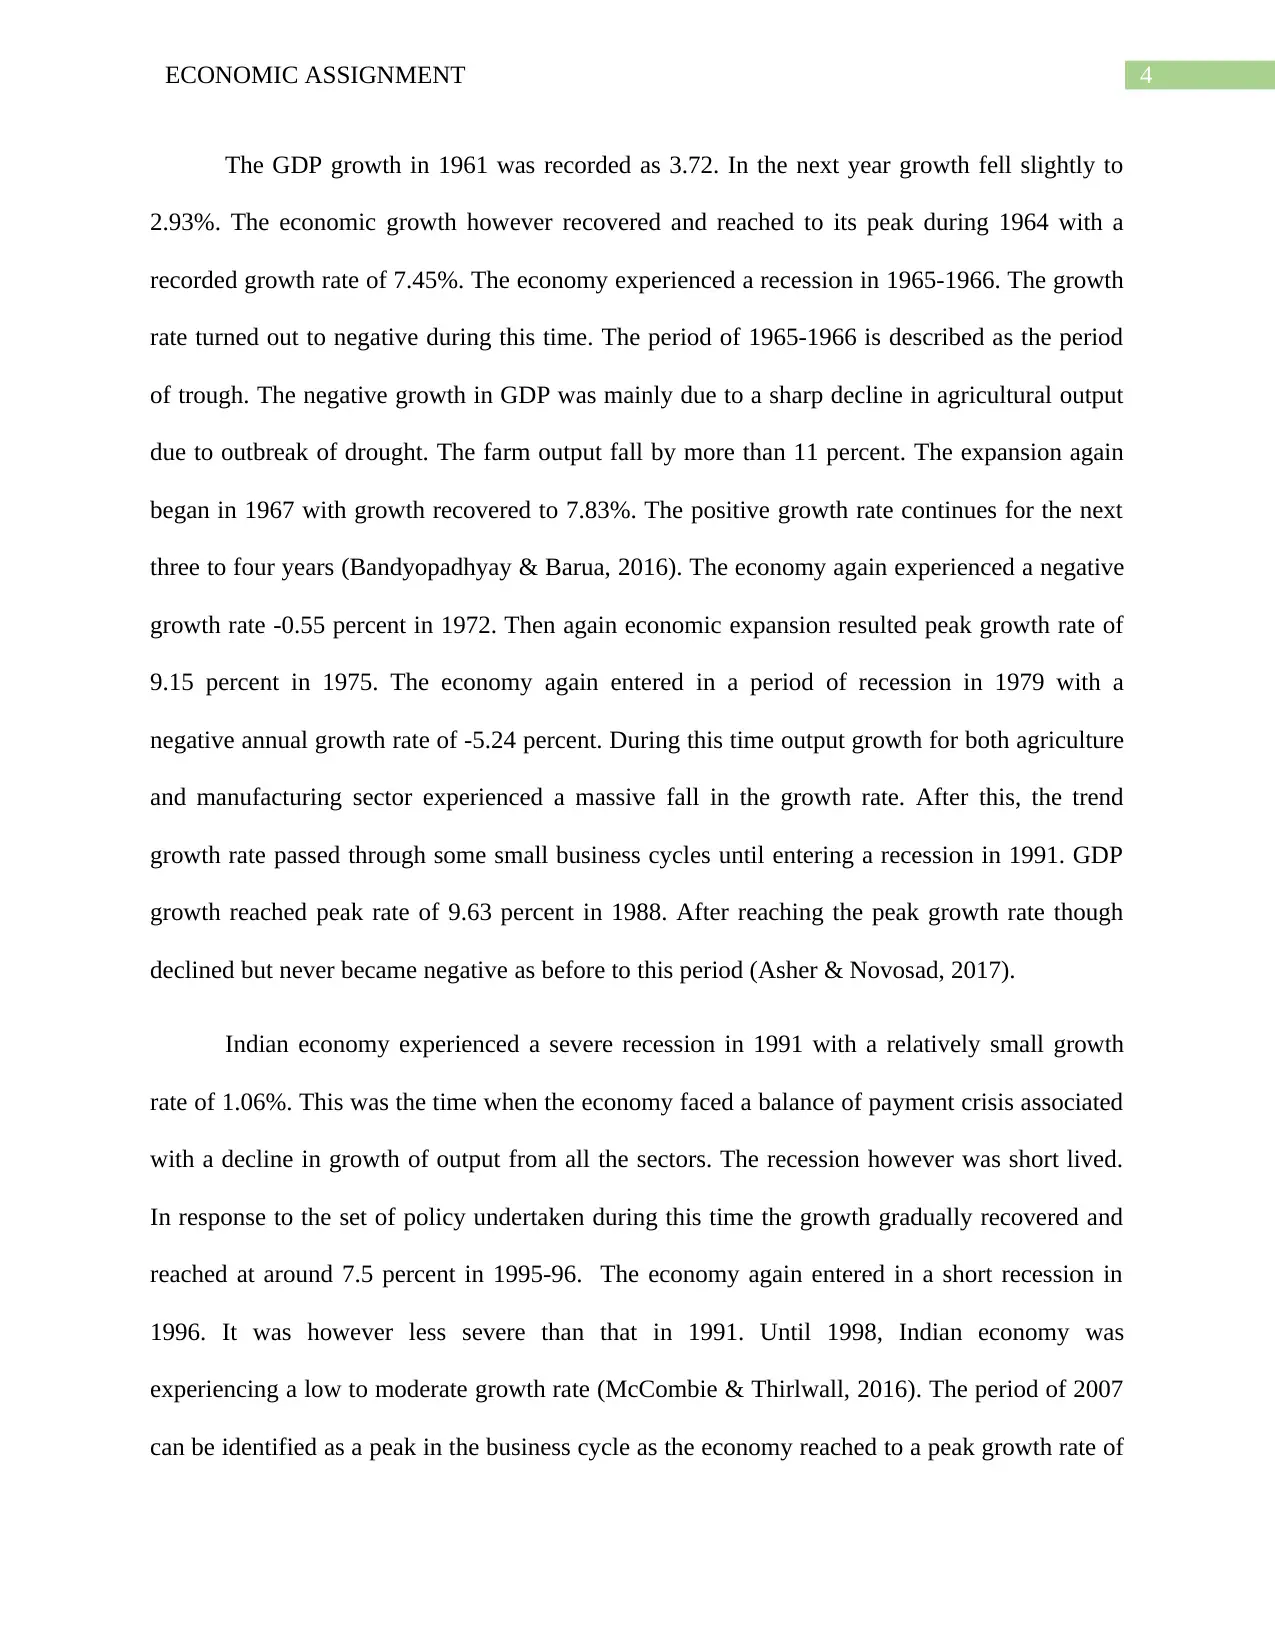
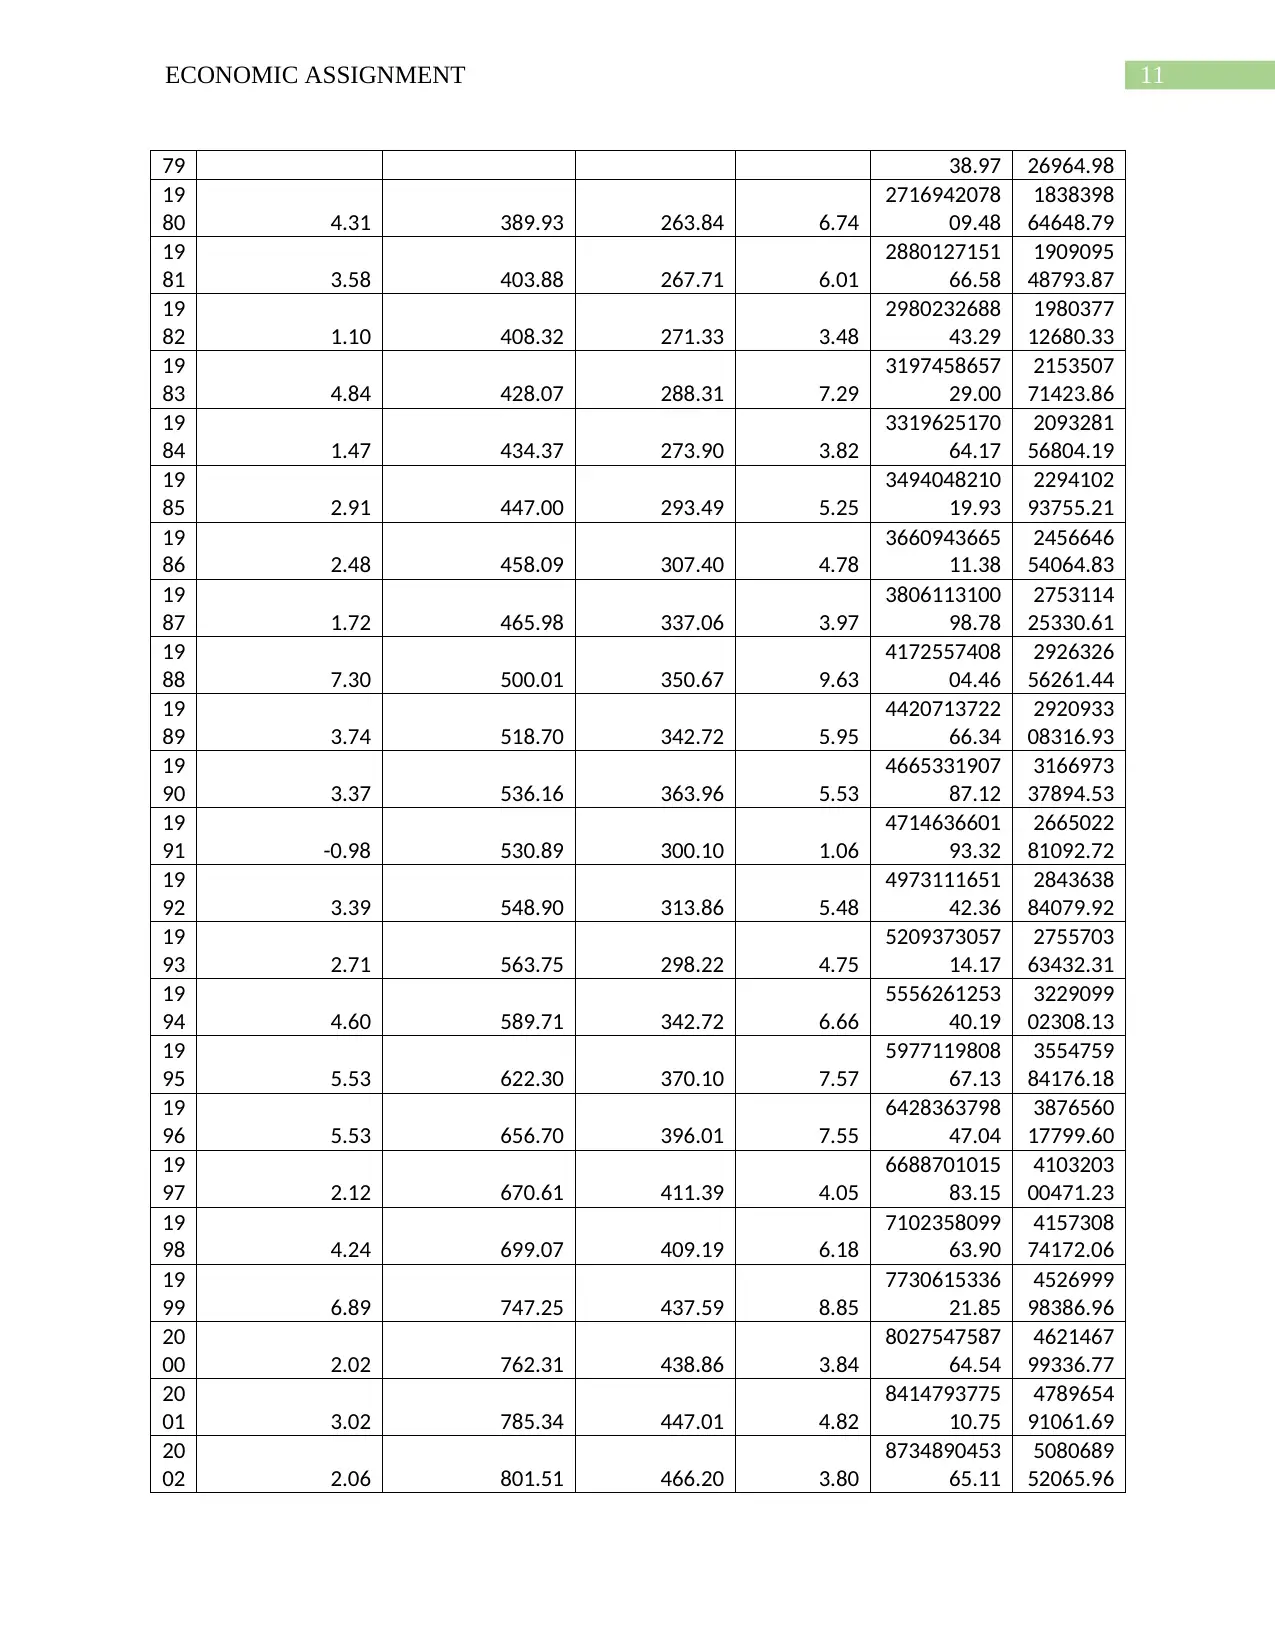
The GDP growth in 1961 was recorded as 3.72. In the next year growth fell slightly to
2.93%. The economic growth however recovered and reached to its peak during 1964 with a
recorded growth rate of 7.45%. The economy experienced a recession in 1965-1966. The growth
rate turned out to negative during this time. The period of 1965-1966 is described as the period
of trough. The negative growth in GDP was mainly due to a sharp decline in agricultural output
due to outbreak of drought. The farm output fall by more than 11 percent. The expansion again
began in 1967 with growth recovered to 7.83%. The positive growth rate continues for the next
three to four years (Bandyopadhyay & Barua, 2016). The economy again experienced a negative
growth rate -0.55 percent in 1972. Then again economic expansion resulted peak growth rate of
9.15 percent in 1975. The economy again entered in a period of recession in 1979 with a
negative annual growth rate of -5.24 percent. During this time output growth for both agriculture
and manufacturing sector experienced a massive fall in the growth rate. After this, the trend
growth rate passed through some small business cycles until entering a recession in 1991. GDP
growth reached peak rate of 9.63 percent in 1988. After reaching the peak growth rate though
declined but never became negative as before to this period (Asher & Novosad, 2017).
Indian economy experienced a severe recession in 1991 with a relatively small growth
rate of 1.06%. This was the time when the economy faced a balance of payment crisis associated
with a decline in growth of output from all the sectors. The recession however was short lived.
In response to the set of policy undertaken during this time the growth gradually recovered and
reached at around 7.5 percent in 1995-96. The economy again entered in a short recession in
1996. It was however less severe than that in 1991. Until 1998, Indian economy was
experiencing a low to moderate growth rate (McCombie & Thirlwall, 2016). The period of 2007
can be identified as a peak in the business cycle as the economy reached to a peak growth rate of
5ECONOMIC ASSIGNMENT
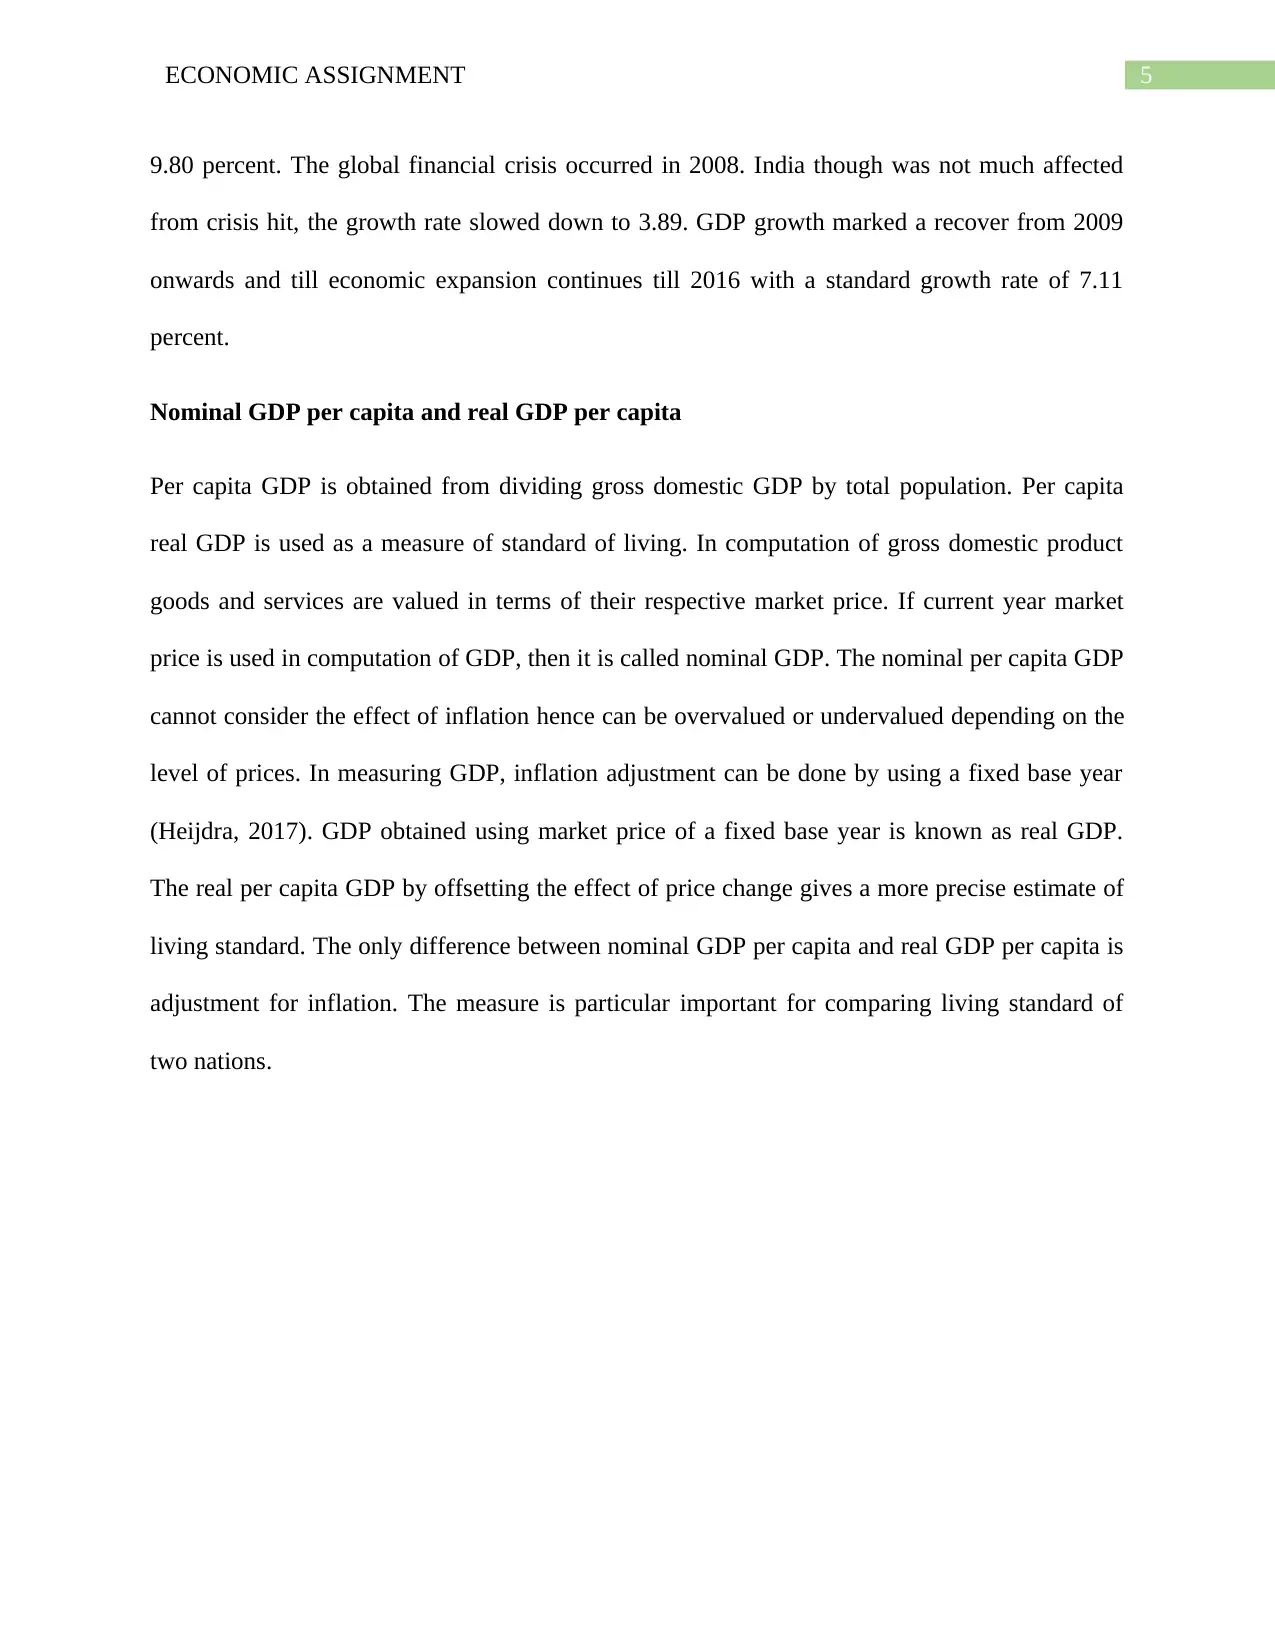
9.80 percent. The global financial crisis occurred in 2008. India though was not much affected
from crisis hit, the growth rate slowed down to 3.89. GDP growth marked a recover from 2009
onwards and till economic expansion continues till 2016 with a standard growth rate of 7.11
percent.
Nominal GDP per capita and real GDP per capita
Per capita GDP is obtained from dividing gross domestic GDP by total population. Per capita
real GDP is used as a measure of standard of living. In computation of gross domestic product
goods and services are valued in terms of their respective market price. If current year market
price is used in computation of GDP, then it is called nominal GDP. The nominal per capita GDP
cannot consider the effect of inflation hence can be overvalued or undervalued depending on the
level of prices. In measuring GDP, inflation adjustment can be done by using a fixed base year
(Heijdra, 2017). GDP obtained using market price of a fixed base year is known as real GDP.
The real per capita GDP by offsetting the effect of price change gives a more precise estimate of
living standard. The only difference between nominal GDP per capita and real GDP per capita is
adjustment for inflation. The measure is particular important for comparing living standard of
two nations.
⊘ This is a preview!⊘
Do you want full access?
Subscribe today to unlock all pages.
Trusted by 1+ million students worldwide
6ECONOMIC ASSIGNMENT
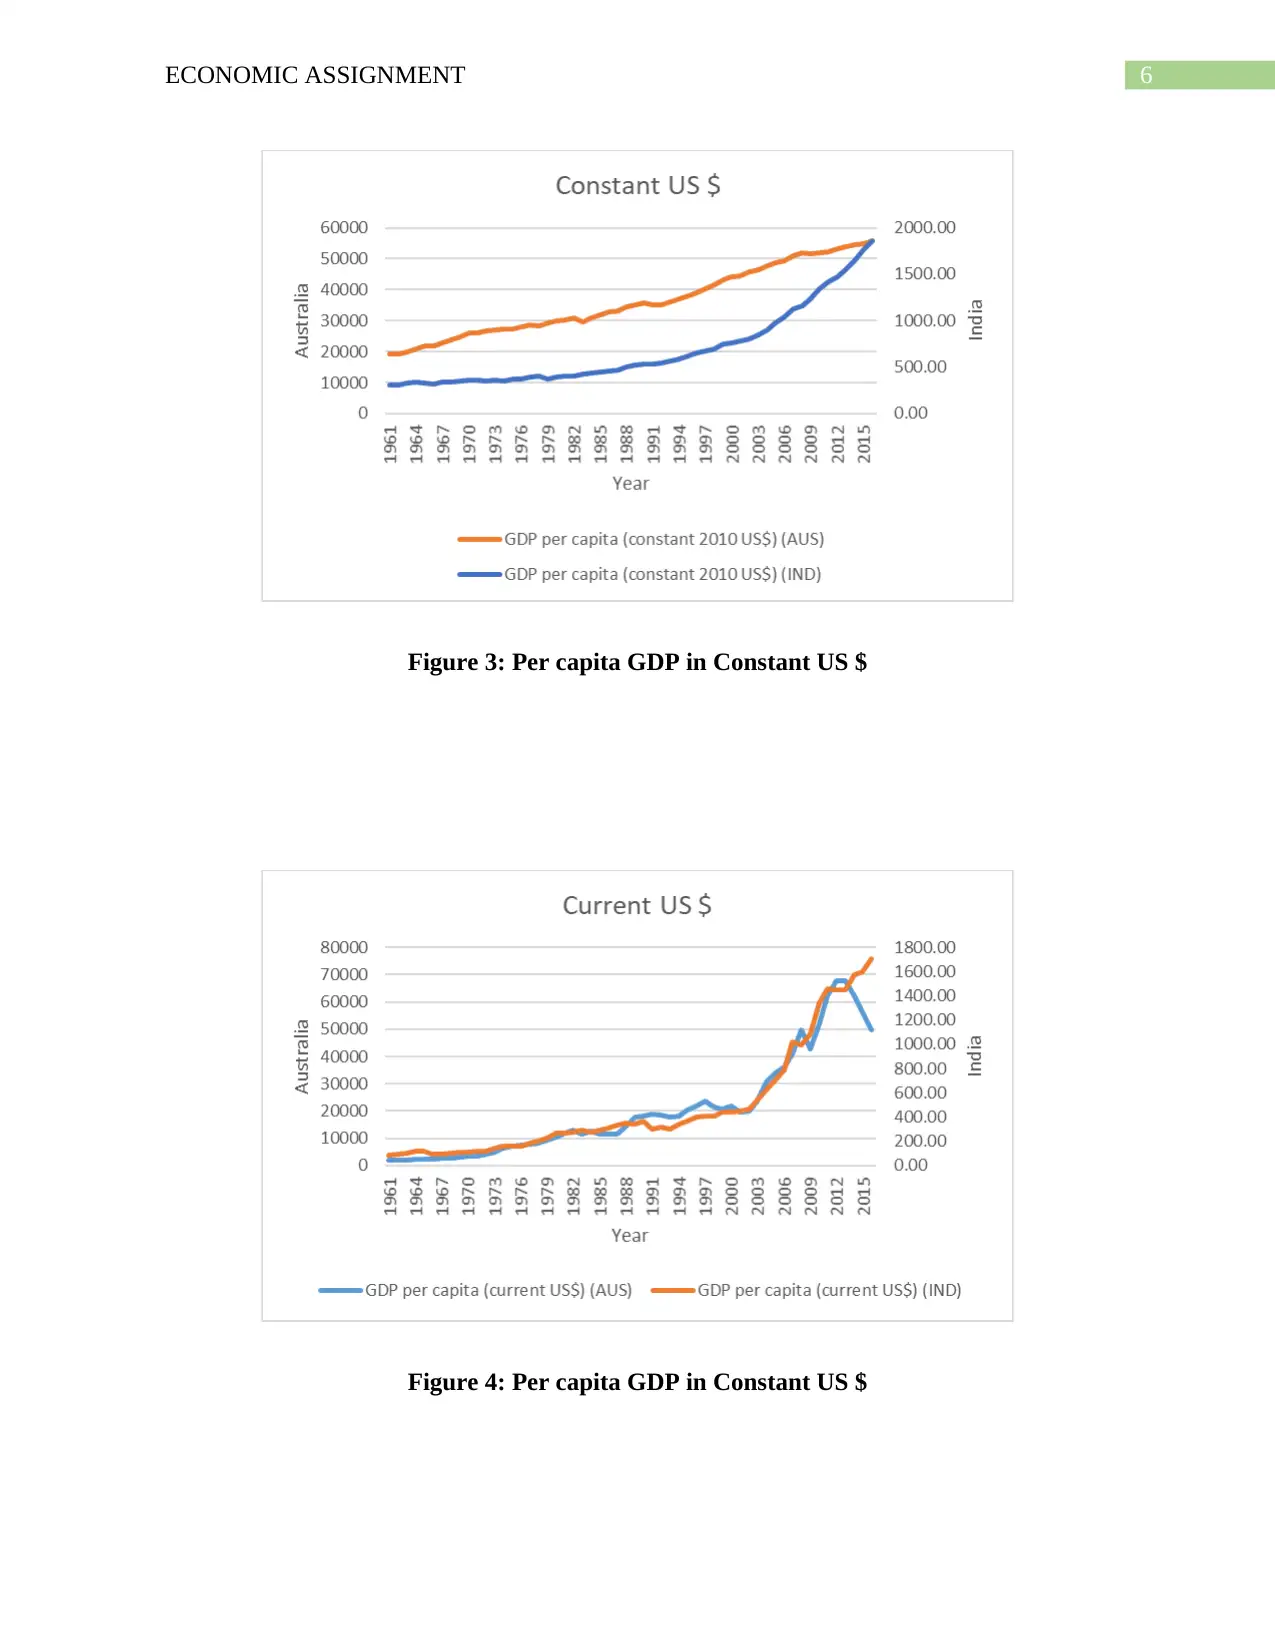
Figure 3: Per capita GDP in Constant US $
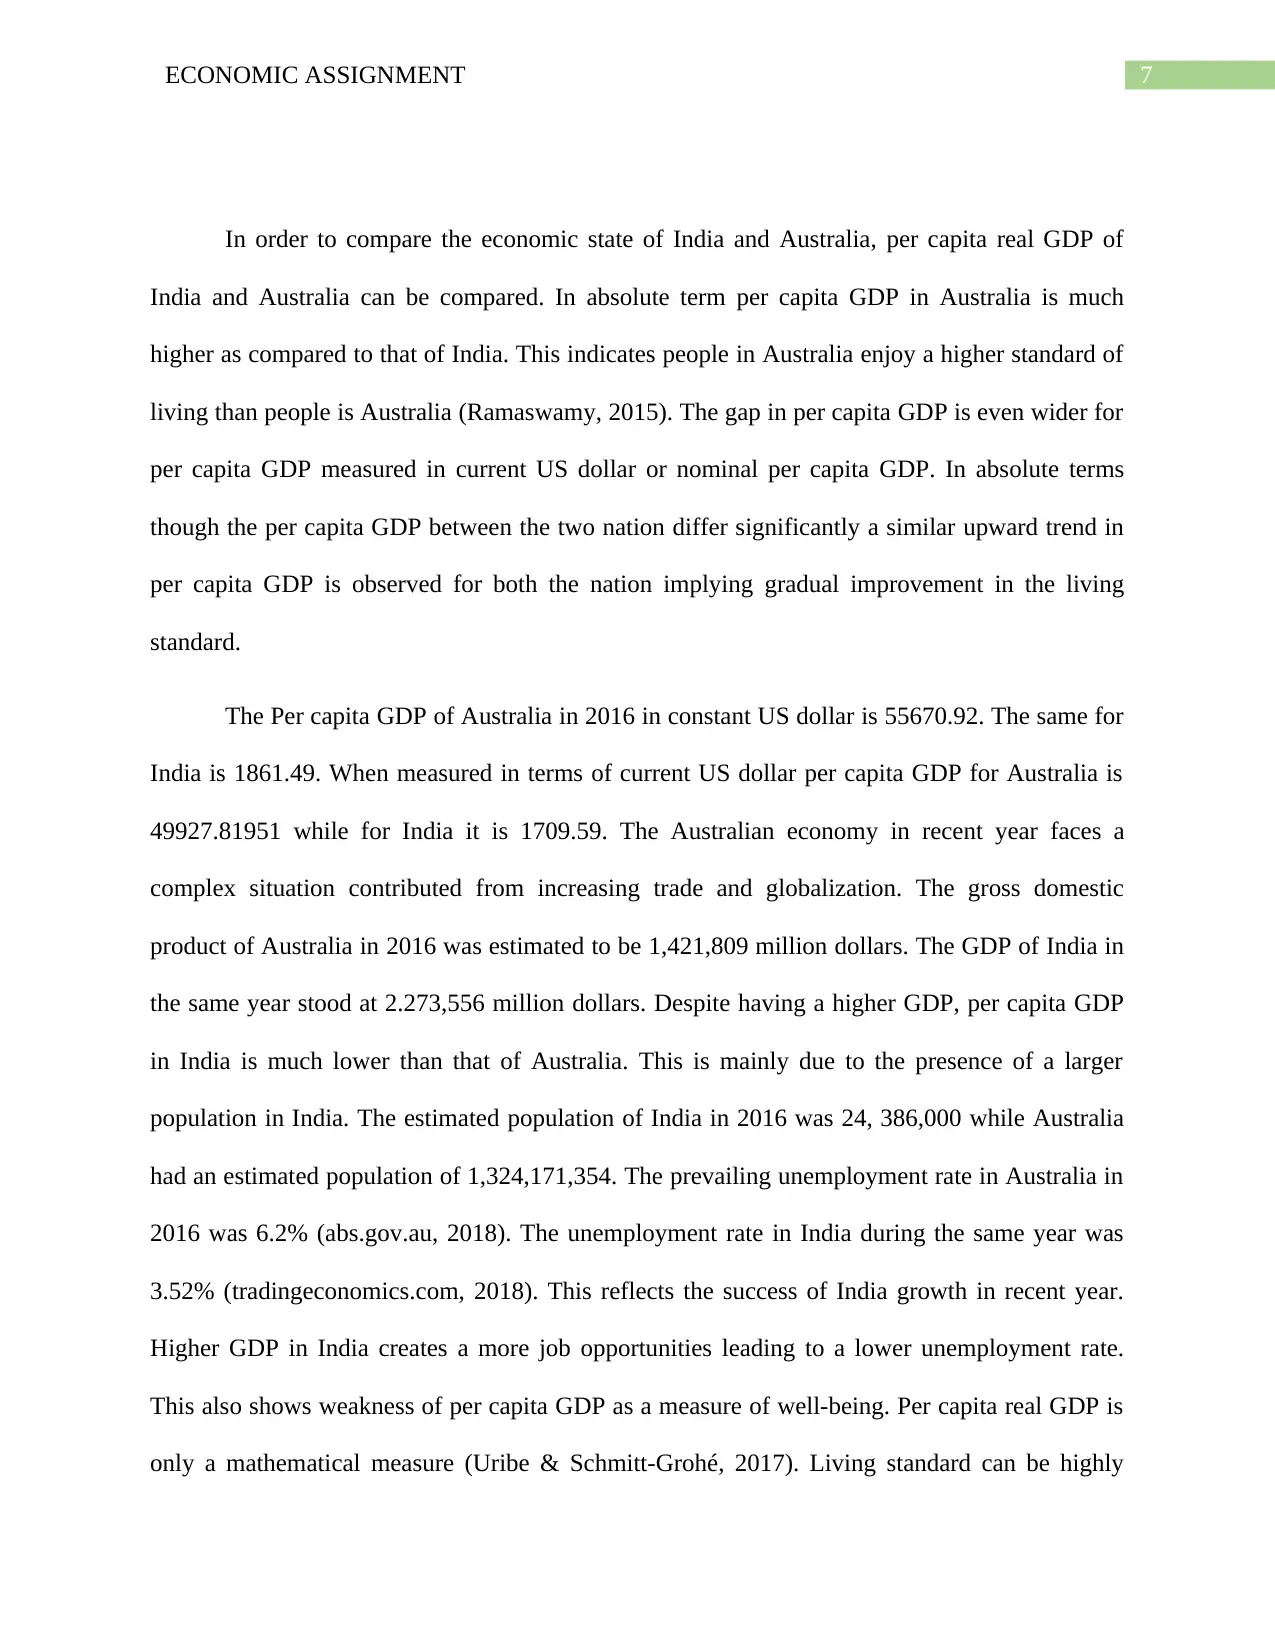
Figure 4: Per capita GDP in Constant US $
Figure 3: Per capita GDP in Constant US $
Figure 4: Per capita GDP in Constant US $
Paraphrase This Document
Need a fresh take? Get an instant paraphrase of this document with our AI Paraphraser
7ECONOMIC ASSIGNMENT
In order to compare the economic state of India and Australia, per capita real GDP of
India and Australia can be compared. In absolute term per capita GDP in Australia is much
higher as compared to that of India. This indicates people in Australia enjoy a higher standard of
living than people is Australia (Ramaswamy, 2015). The gap in per capita GDP is even wider for
per capita GDP measured in current US dollar or nominal per capita GDP. In absolute terms
though the per capita GDP between the two nation differ significantly a similar upward trend in
per capita GDP is observed for both the nation implying gradual improvement in the living
standard.
The Per capita GDP of Australia in 2016 in constant US dollar is 55670.92. The same for
India is 1861.49. When measured in terms of current US dollar per capita GDP for Australia is
49927.81951 while for India it is 1709.59. The Australian economy in recent year faces a
complex situation contributed from increasing trade and globalization. The gross domestic
product of Australia in 2016 was estimated to be 1,421,809 million dollars. The GDP of India in
the same year stood at 2.273,556 million dollars. Despite having a higher GDP, per capita GDP
in India is much lower than that of Australia. This is mainly due to the presence of a larger
population in India. The estimated population of India in 2016 was 24, 386,000 while Australia
had an estimated population of 1,324,171,354. The prevailing unemployment rate in Australia in
2016 was 6.2% (abs.gov.au, 2018). The unemployment rate in India during the same year was
3.52% (tradingeconomics.com, 2018). This reflects the success of India growth in recent year.
Higher GDP in India creates a more job opportunities leading to a lower unemployment rate.
This also shows weakness of per capita GDP as a measure of well-being. Per capita real GDP is
only a mathematical measure (Uribe & Schmitt-Grohé, 2017). Living standard can be highly

8ECONOMIC ASSIGNMENT
overstated or understated depending on the size of population. India thus though started its
growth process later than Australia, however in many respect outperformed Australia with its
rapid growth and economic progress.
overstated or understated depending on the size of population. India thus though started its
growth process later than Australia, however in many respect outperformed Australia with its
rapid growth and economic progress.
⊘ This is a preview!⊘
Do you want full access?
Subscribe today to unlock all pages.
Trusted by 1+ million students worldwide
9ECONOMIC ASSIGNMENT
References
6202.0 - Labour Force, Australia, Mar 2018. (2018). Retrieved from
http://www.abs.gov.au/ausstats/abs@.nsf/mf/6202.0?opendocument&ref=HPKI
Agénor, P. R., & Montiel, P. J. (2015). Development macroeconomics. Princeton University
Press.
Asher, S., & Novosad, P. (2017). Politics and local economic growth: Evidence from
India. American Economic Journal: Applied Economics, 9(1), 229-73.
Bandyopadhyay, A., & Barua, N. M. (2016). Factors determining capital structure and corporate
performance in India: Studying the business cycle effects. The Quarterly Review of Economics
and Finance, 61, 160-172.
Bernanke, B., Antonovics, K., & Frank, R. (2015). Principles of macroeconomics. McGraw-Hill
Higher Education.
Heijdra, B. J. (2017). Foundations of modern macroeconomics. Oxford university press.
India Unemployment Rate | 1983-2018 | Data | Chart | Calendar | Forecast. (2018). Retrieved
from https://tradingeconomics.com/india/unemployment-rate
McCombie, J., & Thirlwall, A. P. (2016). Economic growth and the balance-of-payments
constraint. Springer.
Ramaswamy, K. V. (Ed.). (2015). Labour, Employment and Economic Growth: The Indian
Experience. Cambridge University Press.
Uribe, M., & Schmitt-Grohé, S. (2017). Open economy macroeconomics. Princeton University
Press.
Paraphrase This Document
Need a fresh take? Get an instant paraphrase of this document with our AI Paraphraser
10ECONOMIC ASSIGNMENT
Appendix
Table 1: GDP and per capita GDP
Y
ea
r
Indicator Name
GDP per capita
growth (annual
%)
GDP per capita
(constant 2010
US$)
GDP per
capita
(current US$)
GDP
growth
(annual %)
GDP
(constant
2010 US$)
GDP
(current
US$)
19
61 1.68 309.35 84.43 3.72
1418370500
35.07
3870909
6075.10
19
62 0.87 312.05 88.91 2.93
1459944751
49.40
4159907
0245.07
19
63 3.85 324.06 100.05 5.99
1547458997
30.72
4777600
0903.00
19
64 5.26 341.10 114.32 7.45
1662790344
53.43
5572687
3075.87
19
65 -4.63 325.29 118.06 -2.64
1618963013
64.79
5876042
4674.51
19
66 -2.11 318.42 89.05 -0.06
1618067261
33.23
4525364
1300.00
19
67 5.60 336.24 95.33 7.83
1744696607
00.23
4946616
8893.33
19
68 1.23 340.36 98.83 3.39
1803805692
38.42
5237732
4280.00
19
69 4.27 354.89 106.50 6.54
1921769178
59.85
5766833
0026.67
19
70 2.86 365.06 111.26 5.16
2020879230
13.61
6158980
0520.00
19
71 -0.63 362.77 117.36 1.64
2054080869
02.52
6645256
1868.42
19
72 -2.82 352.55 121.69 -0.55
2042715612
63.10
7050991
3046.85
19
73 0.92 355.79 142.27 3.30
2110033737
36.89
8437454
1625.33
19
74 -1.15 351.71 161.76 1.19
2135044732
35.81
9819827
6856.91
19
75 6.65 375.08 156.38 9.15
2330399446
85.96
9715922
2028.34
19
76 -0.65 372.64 159.41 1.66
2369156404
79.32
1013469
72433.24
19
77 4.83 390.64 184.27 7.25
2541033124
64.54
1198667
46569.34
19
78 3.33 403.63 203.56 5.71
2686190457
26.98
1354687
82810.56
19 -7.38 373.83 221.69 -5.24 2545482893 1509508
11ECONOMIC ASSIGNMENT
79 38.97 26964.98
19
80 4.31 389.93 263.84 6.74
2716942078
09.48
1838398
64648.79
19
81 3.58 403.88 267.71 6.01
2880127151
66.58
1909095
48793.87
19
82 1.10 408.32 271.33 3.48
2980232688
43.29
1980377
12680.33
19
83 4.84 428.07 288.31 7.29
3197458657
29.00
2153507
71423.86
19
84 1.47 434.37 273.90 3.82
3319625170
64.17
2093281
56804.19
19
85 2.91 447.00 293.49 5.25
3494048210
19.93
2294102
93755.21
19
86 2.48 458.09 307.40 4.78
3660943665
11.38
2456646
54064.83
19
87 1.72 465.98 337.06 3.97
3806113100
98.78
2753114
25330.61
19
88 7.30 500.01 350.67 9.63
4172557408
04.46
2926326
56261.44
19
89 3.74 518.70 342.72 5.95
4420713722
66.34
2920933
08316.93
19
90 3.37 536.16 363.96 5.53
4665331907
87.12
3166973
37894.53
19
91 -0.98 530.89 300.10 1.06
4714636601
93.32
2665022
81092.72
19
92 3.39 548.90 313.86 5.48
4973111651
42.36
2843638
84079.92
19
93 2.71 563.75 298.22 4.75
5209373057
14.17
2755703
63432.31
19
94 4.60 589.71 342.72 6.66
5556261253
40.19
3229099
02308.13
19
95 5.53 622.30 370.10 7.57
5977119808
67.13
3554759
84176.18
19
96 5.53 656.70 396.01 7.55
6428363798
47.04
3876560
17799.60
19
97 2.12 670.61 411.39 4.05
6688701015
83.15
4103203
00471.23
19
98 4.24 699.07 409.19 6.18
7102358099
63.90
4157308
74172.06
19
99 6.89 747.25 437.59 8.85
7730615336
21.85
4526999
98386.96
20
00 2.02 762.31 438.86 3.84
8027547587
64.54
4621467
99336.77
20
01 3.02 785.34 447.01 4.82
8414793775
10.75
4789654
91061.69
20
02 2.06 801.51 466.20 3.80
8734890453
65.11
5080689
52065.96
⊘ This is a preview!⊘
Do you want full access?
Subscribe today to unlock all pages.
Trusted by 1+ million students worldwide
1 out of 16
Related Documents


Your All-in-One AI-Powered Toolkit for Academic Success.
+13062052269
info@desklib.com
Available 24*7 on WhatsApp / Email
![[object Object]](/_next/static/media/star-bottom.7253800d.svg)
Unlock your academic potential
Copyright © 2020–2026 A2Z Services. All Rights Reserved. Developed and managed by ZUCOL.