Statistical Report: Analysis of Indices, Earnings, and T-Test Results
VerifiedAdded on 2020/11/23
|15
|3194
|285
Report
AI Summary
This report presents a comprehensive statistical analysis encompassing various economic and business datasets. It begins with an examination of consumer price indices (CPI) and retail price indices (RPI) using data from the Office of National Statistics, comparing their methodologies and applications for calculating inflation. The report then delves into descriptive statistics, comparing hourly earnings in London and Manchester, including calculations of median, quartiles, mean, and standard deviation. A paired t-test is conducted to assess the significance of differences between datasets, alongside the construction of a confidence interval. Further analysis includes the creation of bar charts and ogives to visualize trends in CPI, CPIH, and RPI, as well as scatter diagrams illustrating relationships between variables. The report concludes by summarizing the findings and providing references to the data sources used.

STATISTICS
MANAGEMENT
MANAGEMENT
Paraphrase This Document
Need a fresh take? Get an instant paraphrase of this document with our AI Paraphraser

TABLE OF CONTENTS
INTRODUCTION...........................................................................................................................1
ACTIVITY 1....................................................................................................................................1
A. Locating data on basis of consumer price indices and retail price index through Office of
National statistics.........................................................................................................................1
B. Producing tables, graphs and charts to reflect changes in above indices from year 2007 to
2017..............................................................................................................................................2
C. Explaining differences among these indices...........................................................................2
D. Explaining application for calculating annual inflation .........................................................4
E. Specifying reason about importance of inflation rate..............................................................4
ACTIVITY 2 (1 Client B)................................................................................................................5
Hourly pay rates in different UK regions....................................................................................5
A.1 Using ogive for estimating median hourly earnings and quartiles........................................5
A.2 Calculating mean and standard deviation for purpose of hourly earnings............................6
B. Providing comparison among earnings in two regions...........................................................8
ACTIVITY 3 (2 Client E)................................................................................................................9
A. Carrying paired t test at 5% significance level.......................................................................9
B. Stating usual conditions for paired t test.................................................................................9
C. Constructing 99% confidence interval for mean reduction.....................................................9
ACTIVITY 4..................................................................................................................................10
A. Producing bar charts for reflecting change in CPI, CPIH and RPI with duration of 2007 to
2017............................................................................................................................................10
B. Producing ogive for cumulative % of staff vs hourly earnings along with scatter diagram of
hot drink sales vs average weekly temperature..........................................................................11
CONCLUSION..............................................................................................................................11
REFERENCES..............................................................................................................................13

INTRODUCTION
Statistics is replicated as term which is used for summarizing any process for featuring a
specific data set. In case data base is highly depended on sample of huge population then it will
help for developing interpretations on basis of population with context of statistical outcome
through sample. It helps business for raising international competition which mandates various
managers fr purpose of addressing uncertainty with application of scientific methods and main
objective for decision makers as well. The activities of planning, forecasting, decision making
and organizing helps manager for intending fruitful future with context of business. The present
report will give brief discussion about evaluation of numerous business and economic data along
with information through published sources.
In the similar aspect, it will reflect analysis and evaluation of raw business data with
application of number of statistical methods which is represented in tabular and graphical format.
This report will provide statistical methods for planning business and its outcome should be
articulated in better presentation formation. For evaluating this report, data would be considered
from Office of National statistics website about consumer price index and retail price index.
Further, it will show proper comparison about hourly earning of London and Manchester with
reference to descriptive statistics.
ACTIVITY 1
A. Locating data on basis of consumer price indices and retail price index through Office of
National statistics
Retail price Index (RPI): It is replicated as measure of inflation where people spends
highly on staple services and goods. It is initial tool for identifying that how people are
experience about inflation.
Consumer price Indices (CPIH): It is measure which helps in examining weighted
average price of consumer services and goods like food and medical care along with
transportation (Nica and et.al., 2017).
Year 2007 2008 2009 2010 2011 2012 2013 2014 2015 2016 2017
RPI 4.3 4 -0.5 4.6 5.2 3.2 3 2.4 1 1.8 3.6
CPIH 2.4 3.5 2 2.5 3.8 2.6 2.3 1.5 0.4 1 2.6
1
⊘ This is a preview!⊘
Do you want full access?
Subscribe today to unlock all pages.
Trusted by 1+ million students worldwide

Interpretation: The above table is specifying annual data of consumer and retail price
index for 10 years (2007 to 2017) which is gathered through data set from Office of National
statistics which is used for extracting proper analysis and issue. It represents trade and
purchasing power of UK economy's buyers. The proportionate result has been selected which
directly pertain presence of huge fluctuations with data base. The range of outcome of CPI has
been reflected between 1% to 4%. Simultaneously, RPI has shown drastic alteration in its
outcome as it was negative in year 2009 whose total range was -0.5% to 5%.
B. Producing tables, graphs and charts to reflect changes in above indices from year 2007 to
2017
The below graph will reflect changes in graphical (line) format about changes in CPI and
RPI in statistics of UK with presentation of proportionate fluctuations.
Interpretation: It had been extracted from pictorial representation that prior phase of
CPIH has presence of numerous fluctuation in its results which are not showing proper
information and result with context of specific data base. Hence, by comparing it from RPI
which has shown specific and clear percentage as it has high outcome percentage. In 2009, it was
reflecting negative outcome but in 2010, it attained growth to 4.6 which is drastic change. From
year 2011 it was decreasing by year to year and this trend continued till 2015 then it was raising
till 2017. From this analysis, it could be suggested that RPI of UK is growing strongly with
capability of gathering proper outcomes (D'Costa and et.al., 2017).
2
Paraphrase This Document
Need a fresh take? Get an instant paraphrase of this document with our AI Paraphraser

C. Explaining differences among these indices
Parameter Retail Price Index Consumer price Index
Formed (year and
place)
In year 1956 in United Kingdom. In year 1996 in Europe.
Exclusion While comparing it from household
expenditure, it excludes life
insurance, Income tax and charges
of pension.
In the similar aspect, mortgage
interest payments, house
purchase cost, council tax,
ground rent, house prices along
with holiday spending abroad
and income tax as well.
Consideration It includes spending with abroad on
holiday.
It considers tuition fees from
foreign students and forex
commission with context of
tourists.
Averaged data It is combination of average ratios
and average of relatives such as
work out price alteration at every
store.
It takes geometric mean along
with average of normal ratios.
Population with
context of weighing
Wealthy and pensioners with state
benefits are excluded
The residents of United
Kingdom
Data source The living cost and survey of food
by Office of national statistics
(CPI(H) vs RPI, 2017).
In the similar context, household
monetary expenditure of
consumption on basis of
national accounts.
Application for indices Pensions of private sector, huge
pay negotiations and government
debt payments.
Pensions of public service and
tax credits.
3

The CPI and RPI both are inflation measure as it could be elaborated by considering
basket of goods such as petrol, food clothing and observing their cost of previous, present year
and for extracting proportional variance. However, CPI has left cost of home out of basket along
with increment in payments of mortgage, council tax and rents as in reality it had been paid but
not reflected. Hence, RPI account these costs and in the similar aspect, it has presence of
mathematical difference as well. RPI extracts proportional variance with application of
arithmetical mean among new and old price though CPI uses geometric mean. Further, it had
been articulated that RPI always present big future with context of inflation as compared to CPI.
D. Explaining application for calculating annual inflation
Year 2007 2008 2009 2010 2011 2012 2013 2014 2015 2016 2017
CPIH 2.4 3.5 2 2.5 3.8 2.6 2.3 1.5 0.4 1 2.6
Inflati
on rate 0 0.46 -0.43 0.25 0.52 -0.32 -0.12 -0.35 -0.73 1.5 1.6
Interpretation: The above tabular representation is identifying inflation rate with helps on
consumer price index. It is articulating increment in inflation level while comparing it from past
period. It is indicator of economy of UK which has shown improper CPI. Hence, level of result
of payments and results are not fully satisfied with context of reduction in inflation rate. There
was presence of negative inflation from year 2012 to 2015 which could be favoured for
economy's market condition related to the best outcome of business entity. However, in year
2016 and 2017 it had reflected drastic alteration with reference to rate of inflation. There was
positive change in inflation which was directly giving challenge to economy along with
increment in prices of different commodities which will impact per capita income and brings
instability in nation's financial condition.
E. Specifying reason about importance of inflation rate
In the present scenario, it is mandatory for having appropriate analysis of rate of inflation.
The economic condition could be analysed with various economists and smart plan could be
generated for purpose of overcoming various crisis. However, economy has numerous
importance of inflation rate as it is insisting increment in inflation rate which will affect
commodity's price for uplifting it. The necessary need of consumer would be met as they will be
4
⊘ This is a preview!⊘
Do you want full access?
Subscribe today to unlock all pages.
Trusted by 1+ million students worldwide

spending high on commodity which will help economy for having huge circulation in monetary
aspect. It would be raising level of supply of money as government would be gathering huge
funds along with reserves for purpose of future developments (Krackhardt, Schwab and
Starbuck, 2017).
Furthermore, the increment in rate of inflation has negative effect on GDP rate or per
capita income in economy. With this context, consumer would spend highly on various
commodities which will direct impact their savings and no money would be left in banks. In the
similar aspect, it would be inviting fluctuation in rate of inflation and helps numerous economists
for designing rules and planning policies for governing its operational tasks.
ACTIVITY 2 (1 Client B)
Hourly pay rates in different UK regions
A.1 Using ogive for estimating median hourly earnings and quartiles
The difference among professionals hourly earning had been analysed at numerous
location with application of different statistical tools. There will be presence of descriptive
analysis of specific database which is included in analysing quartile and median like:
Median:
This is method which determines variation among numerous variable at higher and lower
scale. Generally, its outcome is equal and more than value which will be undertaken in above. In
the similar aspect, it is replicated as database's middle value which will be proper for analysing
its outcome and for performing proper analysis of operations (Bhattacharyya, 2018).
Hourly
Earnings CI
No. of leisure
centre staff
(F) R frequency CF CRF
0 to 10 4 4% 4 4%
10 to 20 23 23% 27 27%
20 to 30 13 13% 40 40%
30 to 40 7 7% 47 47%
40 to 50 3 3% 50 50%
5
Paraphrase This Document
Need a fresh take? Get an instant paraphrase of this document with our AI Paraphraser

Hourly
Earnings CI 0 to 10 10 to 20 20 to 30 30 to 40 40 to 50
No. of leisure
canter staff (F) 4 23 13 7 3
CF 4 27 40 47 50
Median
Formula L- Cf-n/ f* i
20-(40-5)/ 50 * 10
13
Hourly Earnings (CI)
Number of leisure centre staff
(F)
0 to 10 4
10 to 20 23
20 to 30 13
30 to 40 7
40 to 50 3
Quartile 1 Quartile 2 Quartile 3
3 3 3
6

Interpretation: The above tabular and graphical representation is for measurement of
quartile and median where value is derived with context of different techniques. While extracting
median it had been determined as 13 which is comprised in working team of range of 10 to 20
hours. In simple words, its middle value is 13 and similarly while performing quartile analysis of
its table of frequency is reflecting identical outcome with context of each 3 quartiles which is 3.
A.2 Calculating mean and standard deviation for purpose of hourly earnings
There are various variables which are defined in above aspect as in this context, it would
be pertaining to its standard deviation along with mean value (Seo, 2017). It analysis has been
showed below:
Mean value
It is replicated as statistical measure which is explanation of attaining average value.
With application of minimum resources and time there is availability of numerous complex and
complicated measures where mean is replicated desirable for attaining quick and proper estimate
of return of future on basis of availability of returns via asset in the past. It identifies the average
of database which would be used for analysing the results. Further, Hourly earning's mean of
employees of London region which is stated below:
Hourly Earnings CI
No. of
leisure
centre staff
(F)
Mid value
(X) FX Mean
7
⊘ This is a preview!⊘
Do you want full access?
Subscribe today to unlock all pages.
Trusted by 1+ million students worldwide
0 to 10 4 5 20 ƸFX ƸF
10 to 20 23 15 345 1070 50
20 to 30 13 25 325
21.4
30 to 40 7 35 245
40 to 50 3 45 135
Total 50 125 1070
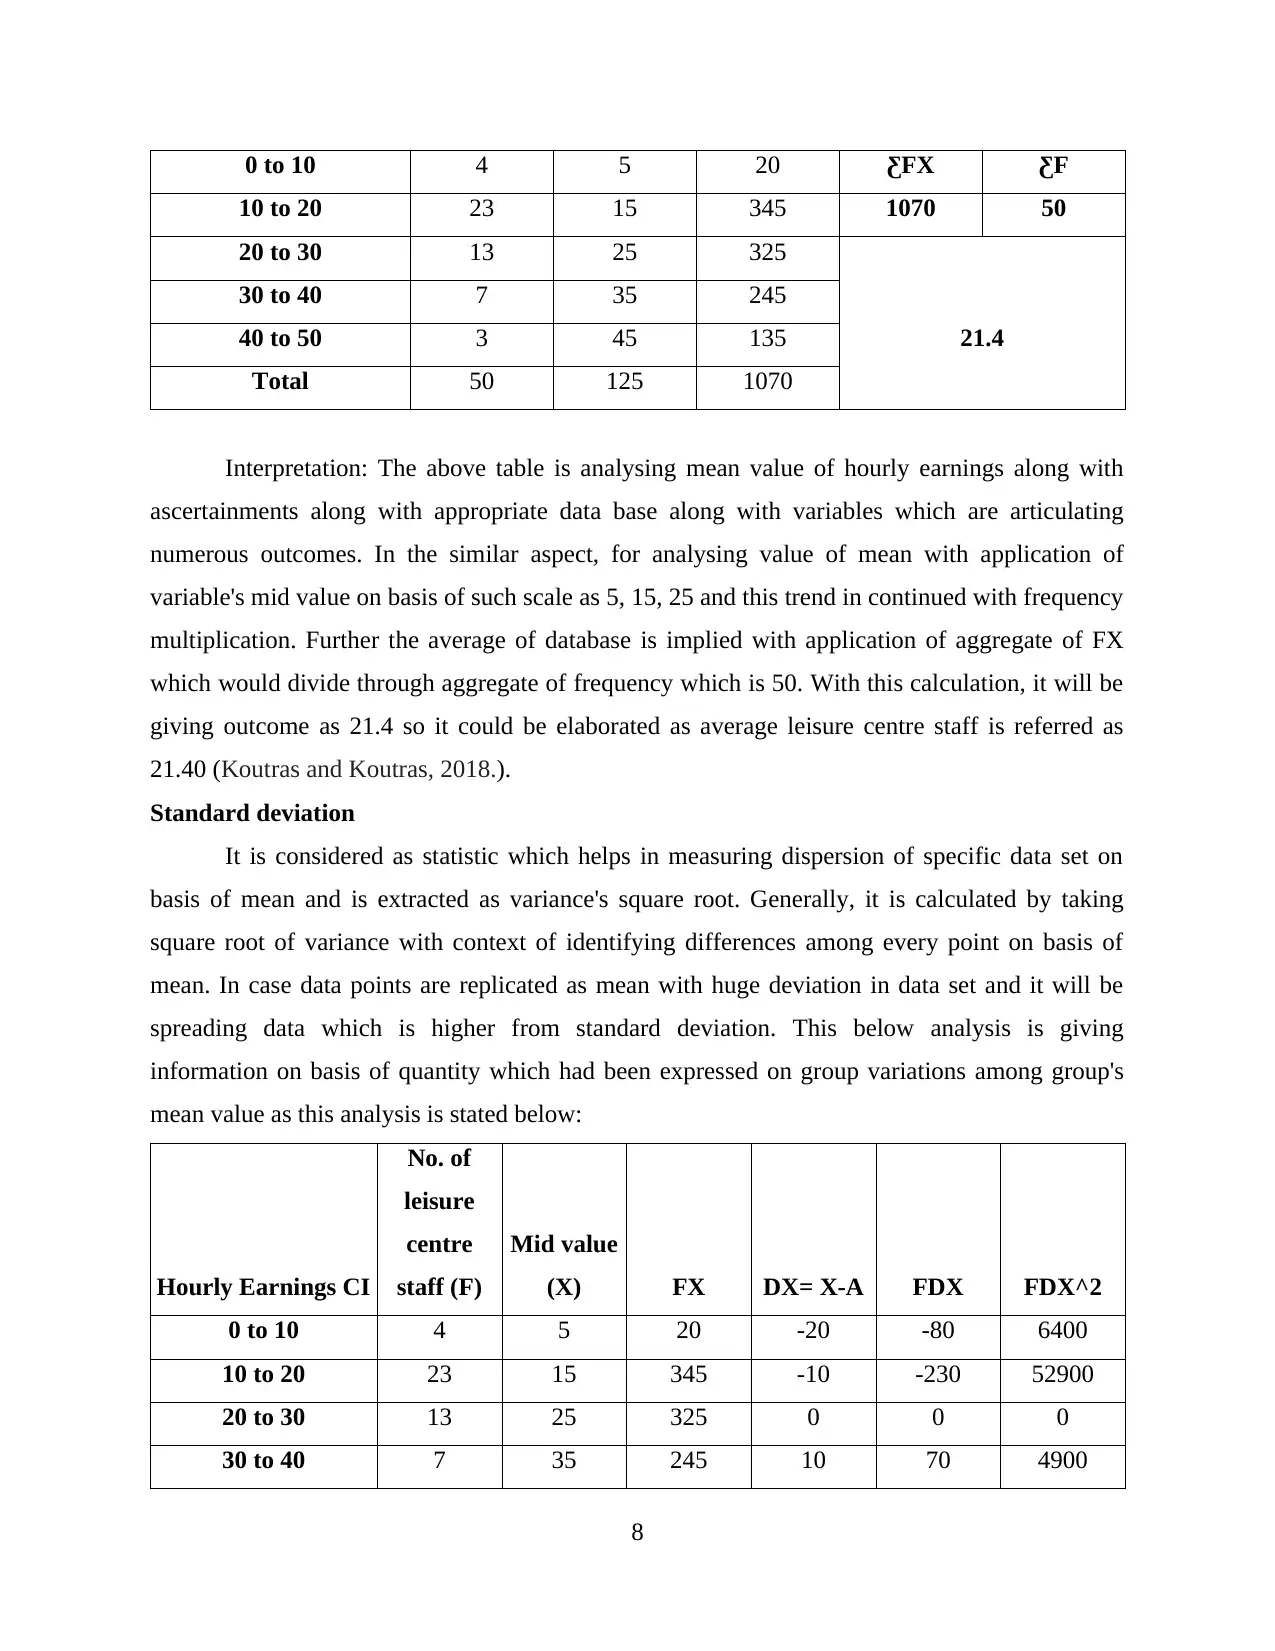
Interpretation: The above table is analysing mean value of hourly earnings along with
ascertainments along with appropriate data base along with variables which are articulating
numerous outcomes. In the similar aspect, for analysing value of mean with application of
variable's mid value on basis of such scale as 5, 15, 25 and this trend in continued with frequency
multiplication. Further the average of database is implied with application of aggregate of FX
which would divide through aggregate of frequency which is 50. With this calculation, it will be
giving outcome as 21.4 so it could be elaborated as average leisure centre staff is referred as
21.40 (Koutras and Koutras, 2018.).
Standard deviation
It is considered as statistic which helps in measuring dispersion of specific data set on
basis of mean and is extracted as variance's square root. Generally, it is calculated by taking
square root of variance with context of identifying differences among every point on basis of
mean. In case data points are replicated as mean with huge deviation in data set and it will be
spreading data which is higher from standard deviation. This below analysis is giving
information on basis of quantity which had been expressed on group variations among group's
mean value as this analysis is stated below:
Hourly Earnings CI
No. of
leisure
centre
staff (F)
Mid value
(X) FX DX= X-A FDX FDX^2
0 to 10 4 5 20 -20 -80 6400
10 to 20 23 15 345 -10 -230 52900
20 to 30 13 25 325 0 0 0
30 to 40 7 35 245 10 70 4900
8
10 to 20 23 15 345 1070 50
20 to 30 13 25 325
21.4
30 to 40 7 35 245
40 to 50 3 45 135
Total 50 125 1070
Interpretation: The above table is analysing mean value of hourly earnings along with
ascertainments along with appropriate data base along with variables which are articulating
numerous outcomes. In the similar aspect, for analysing value of mean with application of
variable's mid value on basis of such scale as 5, 15, 25 and this trend in continued with frequency
multiplication. Further the average of database is implied with application of aggregate of FX
which would divide through aggregate of frequency which is 50. With this calculation, it will be
giving outcome as 21.4 so it could be elaborated as average leisure centre staff is referred as
21.40 (Koutras and Koutras, 2018.).
Standard deviation
It is considered as statistic which helps in measuring dispersion of specific data set on
basis of mean and is extracted as variance's square root. Generally, it is calculated by taking
square root of variance with context of identifying differences among every point on basis of
mean. In case data points are replicated as mean with huge deviation in data set and it will be
spreading data which is higher from standard deviation. This below analysis is giving
information on basis of quantity which had been expressed on group variations among group's
mean value as this analysis is stated below:
Hourly Earnings CI
No. of
leisure
centre
staff (F)
Mid value
(X) FX DX= X-A FDX FDX^2
0 to 10 4 5 20 -20 -80 6400
10 to 20 23 15 345 -10 -230 52900
20 to 30 13 25 325 0 0 0
30 to 40 7 35 245 10 70 4900
8
Paraphrase This Document
Need a fresh take? Get an instant paraphrase of this document with our AI Paraphraser

40 to 50 3 45 135 20 60 3600
Total 50 125 1070 0 -180 32400
Standard deviation
Formula √ƸFdx^2/N - (ƸFdx/ N)^2
√32400/ 50 -(-180/50)^2
12.96
25.45
12.50
Interpretation: The above data is specifying analysis about measures which are
concentrating data with context of mean smaller from standard deviation. It is related to
movement of risk on basis of mean value by 12.50 times with reference to numerous variables.
Hence, there is presence of 12.50 as variation among hourly wages of employees of region of
London.
B. Providing comparison among earnings in two regions
Parameters Median
Interquartile
range (IQ) Mean
Standard
deviation
London (£) 13 3 13 12.5
Manchester (£) 14 7.5 16.5 7
Interpretation: The above table is specifying comparison among earnings in London and
Manchester on basis of hourly payments wages with reference to descriptive statistics. It
comprises median as 13 in London and Manchester as 14 which shows cut throat competition
where Manchester is leading by difference of 1. In the similar aspect, Interquartile range is
specified of both region where is presence of huge variation as London has 3 and Manchester has
7.5 similarly to median (Naidu. and Sanford, 2017).
While comparing regions on basis of hourly payment wages, it has specified difference
with reference to mean and standard deviation. Manchester has average of 16.5 where London
has 13 in which movement of risk has been measured on basis of standard deviation. London has
huge risk movement as 12.5 on contrary, Manchester has 7 which is low in this comparison.
9

ACTIVITY 3 (2 Client E)
A. Carrying paired t test at 5% significance level
Hypothesis
H0: Null hypothesis: There is no significant difference among the mean value of new system
and old system.
H1: Alternative hypothesis: There is significant difference among the mean value of new
system and old system.
t-Test: Paired 2 Sample for Means
New Old
Mean 54.95 56.01
Variance 146.93 126.76
Observations 10 10
Pearson Correlation 0.96
Hypothesized Mean Difference 0
Df (degree of freedom) 9
T statistic 0.98
P(T<=t) 1-tail 0.18
t Critical 1-tail 1.83
P(T<=t) 2-tail 0.36
t Critical 2-tail 2.26
B. Stating usual conditions for paired t test
Interpretation: The above table is representing t-test which is paired with 2 sample means
of new and old system. The degree of freedom is 9 of old system and with new system there is
only presence of mean, variance and observations other variables are extracted among both
variables. There is application of T-test analysis which is beneficial for reflecting results for both
new and old system for determining relationship in new and old variable which shows P on value
of tails as 0.18 and two tail as 0.36.
C. Constructing 99% confidence interval for mean reduction
T-Test: Paired Two Sample for Means (99%)
10
⊘ This is a preview!⊘
Do you want full access?
Subscribe today to unlock all pages.
Trusted by 1+ million students worldwide
1 out of 15
Related Documents


Your All-in-One AI-Powered Toolkit for Academic Success.
+13062052269
info@desklib.com
Available 24*7 on WhatsApp / Email
![[object Object]](/_next/static/media/star-bottom.7253800d.svg)
Unlock your academic potential
Copyright © 2020–2026 A2Z Services. All Rights Reserved. Developed and managed by ZUCOL.