Strategic Analysis of Inditex Group: Financial and Strategic Report
VerifiedAdded on 2023/03/31
|57
|10127
|83
Report
AI Summary
This report offers a comprehensive strategic analysis of the Inditex Group, examining its financial performance, including profitability, liquidity, and leverage, and benchmarking it against competitors like H&M and GAP. The analysis incorporates PESTLE and Five Forces frameworks to assess the macro and micro environments, identifying opportunities and threats. The report proposes strategic recommendations, including market penetration and development strategies, evaluated using the SAF framework. It also provides a financial analysis of the company over a 5-year period and includes limitations of the analysis, followed by conclusions and recommendations for the Inditex Group's future growth and competitive advantage in the fashion industry. The report highlights key performance indicators and concludes with a detailed recommendations modeling and SAF analysis.
Running head: INDITEX REPORT
INDITEX REPORT
Name of the Student
Name of the University
Author Note
INDITEX REPORT
Name of the Student
Name of the University
Author Note
Paraphrase This Document
Need a fresh take? Get an instant paraphrase of this document with our AI Paraphraser
1INDITEX REPORT
Executive Summary
The business environment is dynamic and hence, all the businesses as present in the business
environment would be required to undertake processes which would help to attain their overall
targets easily. The given report is based on the report of the Inditex group and the overall
analysis of the firm has been done. The report begins with a brief introduction which has then
been followed by the overall financial and strategic analysis of Inditex and benchmarked with its
competitors H and M and GAP. This is then followed by the recommendation of strategies which
the Inditex can adopt. The recommendations have been scrutinized with the help of the SAF
Framework and the Recommendations modelling has been done.
2INDITEX REPORT
Table of Contents
1. Introduction..................................................................................................................................4
1.1 Report objectives...................................................................................................................4
1.2 Case context of analysis.........................................................................................................4
1.3 Overview of Organization.....................................................................................................6
1.4 Current key issues and rationale for choosing the organization............................................7
2. Financial Analysis.......................................................................................................................9
2.1 Profitability............................................................................................................................9
2.2Liquidity...............................................................................................................................12
2.3Leverage...............................................................................................................................13
2.4 Investors...............................................................................................................................15
3. Strategic Analysis......................................................................................................................17
3.1 Macro environmental analysis- PESTLE............................................................................17
3.1.1 Summary...........................................................................................................................27
3.2 Micro environmental analysis-Five Force...........................................................................28
3.3 Identification of Opportunities and Threats.........................................................................34
3.4 Key performance Indicators................................................................................................34
4. Proposed strategy –Ansoff.........................................................................................................37
4.1 Market Penetration...............................................................................................................38
4.2 Market development............................................................................................................39
⊘ This is a preview!⊘
Do you want full access?
Subscribe today to unlock all pages.
Trusted by 1+ million students worldwide
3INDITEX REPORT
5. Limitation of the Analysis.........................................................................................................40
5.1 Limitations of the Strategic analysis....................................................................................40
...............................................................................................................................................40
5.2 Limitation of Financial analysis..........................................................................................40
6. Conclusions................................................................................................................................41
6.1 Overview..............................................................................................................................41
6.2 SAF Analysis of Strategies..................................................................................................42
7. Recommendations modeling.....................................................................................................45
References......................................................................................................................................49
Appendix........................................................................................................................................52
Paraphrase This Document
Need a fresh take? Get an instant paraphrase of this document with our AI Paraphraser
4INDITEX REPORT
1. Introduction
1.1 Report objectives
Strategic Management can be considered to be a crucial part of the organization and in
this aspect, it becomes essentially crucial for the firm to see to it that, it is successfully able to
meet the needs of the stakeholders (Inditex.com 2019). Hence, the primary focus of the report
can be understood to be to understand the overall business strategy of the Inditex group and in
line of this, compare this strategy to the overall strategy of other business as present in the
similar industry. This analysis will help in comparing the overall performance of the business
and in line of this, recommendations for a strong growth can be provided to the company. Hence,
by following these recommendations, the firm will successfully be able to achieve competitive
advantage in the long run.
1.2 Case context of analysis
The luxury clothing environment has become considerably competitive in nature and
hence, in line of this, it can be rightfully mentioned that, in order to attain success in the long
run, the different firms as present would be required to undertake considerable initiatives so as to
maintain their considerable share in the market. In line of this, when Inditex will be compared
with H and M and GAP, the analysis will be based on the manner in which these firms have been
able to meet the needs of the different firms and in a manner similar to this, it shall also analyses
how the organizations have been successful in the industry. Through the analysis, Inditex will be
able to assess and analyses how they will be able to win over the competition as present and
additionally be able to examine the manner in which, they can attain success in the long run. For
5INDITEX REPORT
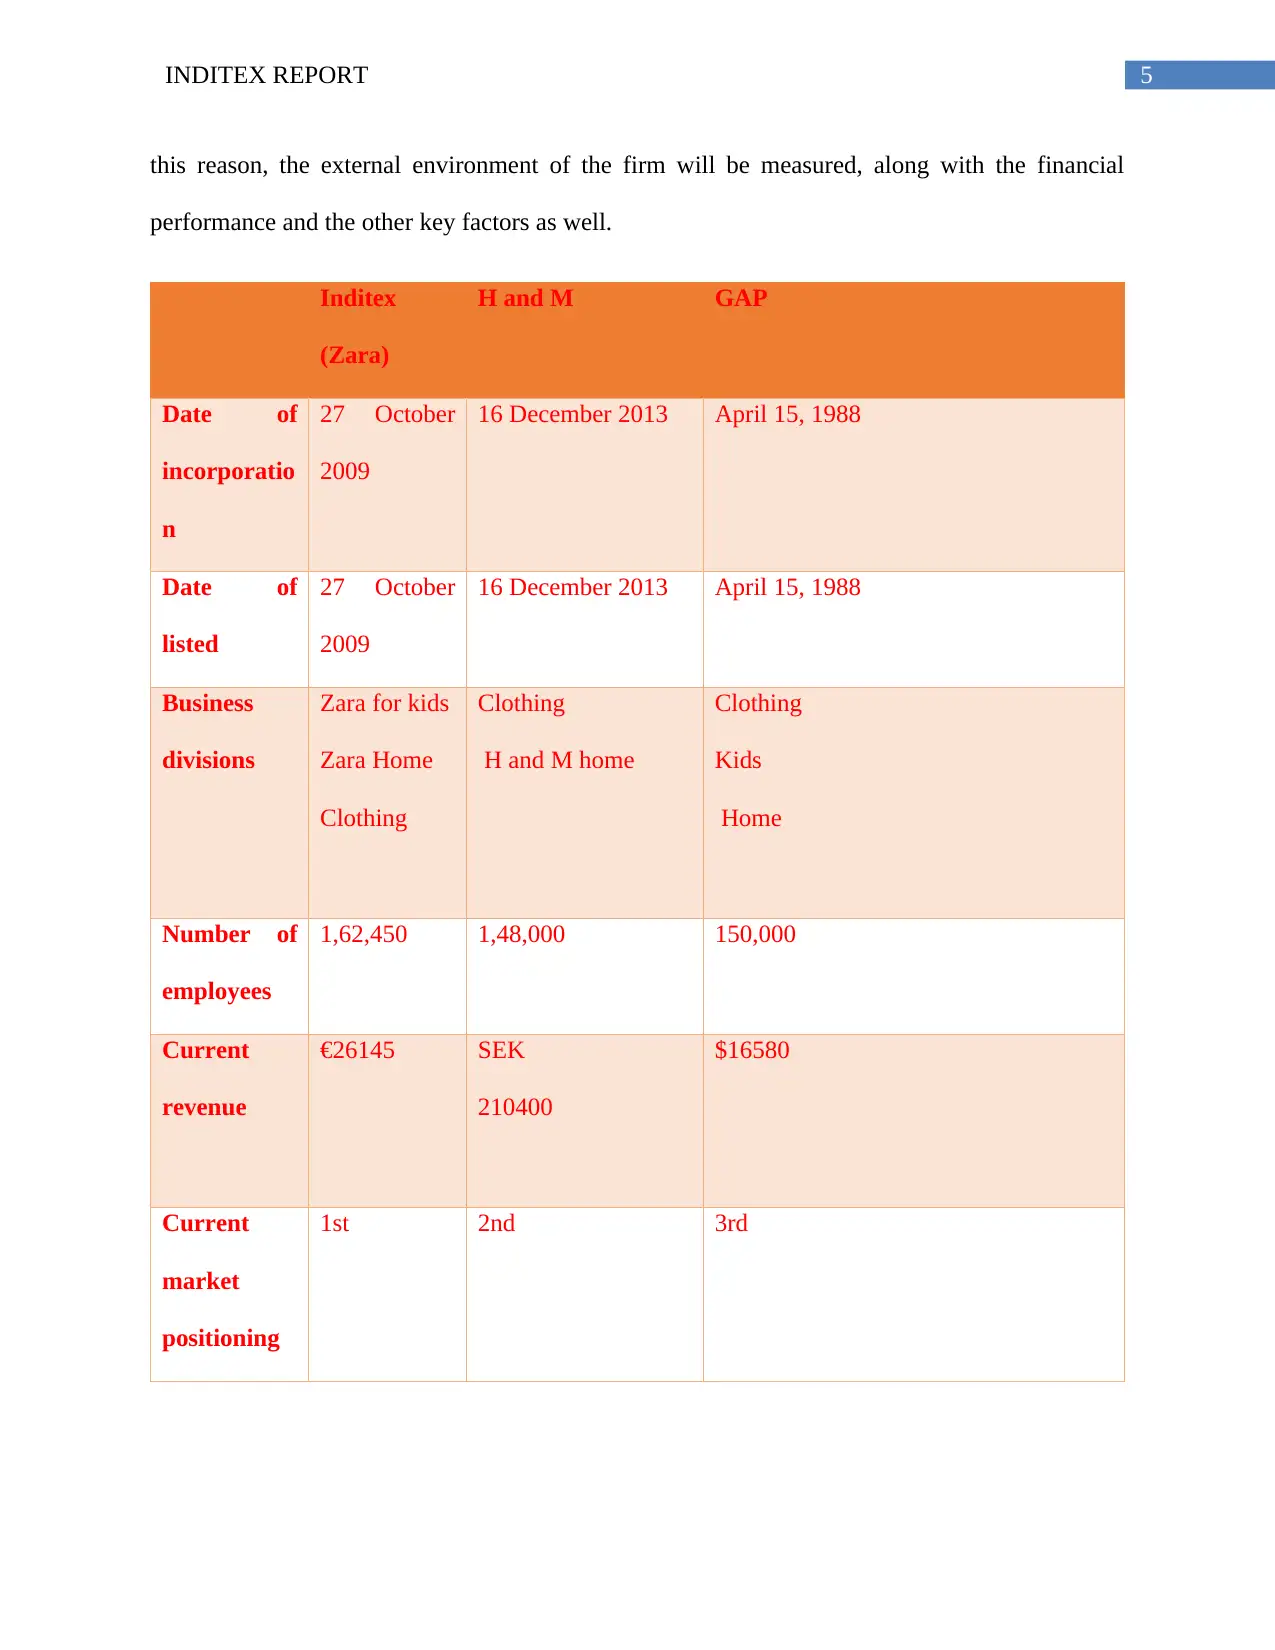
this reason, the external environment of the firm will be measured, along with the financial
performance and the other key factors as well.
Inditex
(Zara)
H and M GAP
Date of
incorporatio
n
27 October
2009
16 December 2013 April 15, 1988
Date of
listed
27 October
2009
16 December 2013 April 15, 1988
Business
divisions
Zara for kids
Zara Home
Clothing
Clothing
H and M home
Clothing
Kids
Home
Number of
employees
1,62,450 1,48,000 150,000
Current
revenue
€26145 SEK
210400
$16580
Current
market
positioning
1st 2nd 3rd
⊘ This is a preview!⊘
Do you want full access?
Subscribe today to unlock all pages.
Trusted by 1+ million students worldwide
6INDITEX REPORT
Logo
1.3 Overview of Organization
The Inditex can be understood to be a Spanish multinational clothing company which has
its headquarters in Galicia. The Inditex can be understood to be one of the biggest fashion groups
as present around the globe and thereby tends to operate more than 7200 stores in 93 markets
around the globe. Although the company`s Flagship store is Zara, but it also owns the chains like
Zara Home. Oysho, Pull and Bear, Uterque and the Stradivarius (Inditex.com 2019). The
company has owned stores as well as dealings in the franchising model.
The company began its operations back in the year 1963 and what began as a small
family business, the business has turned out to be a huge name in the fashion industry around the
globe. The customer is at the center of everything which the firm undertakes and hence, in line of
this, the company aims to serve the customers in the right manner by focusing on the elements of
fashion production and bringing the customers closer than ever so as to be able to provide the
customers with a more affordable price (Inditex.com 2019).
Paraphrase This Document
Need a fresh take? Get an instant paraphrase of this document with our AI Paraphraser
7INDITEX REPORT
1.4 Current key issues and rationale for choosing the organization
The Inditex group has had a considerable unique marketing strategy from the very
beginning of the operations and hence, it does not make use of the traditional media to advertise
its products. The group believes that if it wants to ensure success in the long run then in such a
case, it will be required to adopt suitable customized strategy which would allow the firm to
improve its overall operations (Lasserre 2017). Hence, the first issue lies to determine the overall
marketing strategy which the firm has to adopt on its own. In addition to this, when the company
opens various branches of production of selling in the other countries it rends to be affected by
various labor unions and related activities at large (Inditex.com 2019). Hence, it can be largely
understood that the competition of the business against the various local manufacturers and
designers along with the international brands have increased considerably and in line of this, The
Zara and Inditex has been finding it increasingly difficult to perform well due to these increased
pressure. For this reason, it is crucial that, the business understands the manner in which it will
be required to combat this competition and make a string standing for itself in the long run will
be examined and discussed accordingly in the coming sections.
8INDITEX REPORT
2014 2015 2016 2017 2018
€ -
€ 5,000.00
€ 10,000.00
€ 15,000.00
€ 20,000.00
€ 25,000.00
€ 30,000.00
€ 18,117.00
€ 20,900.00
€ 23,311.00
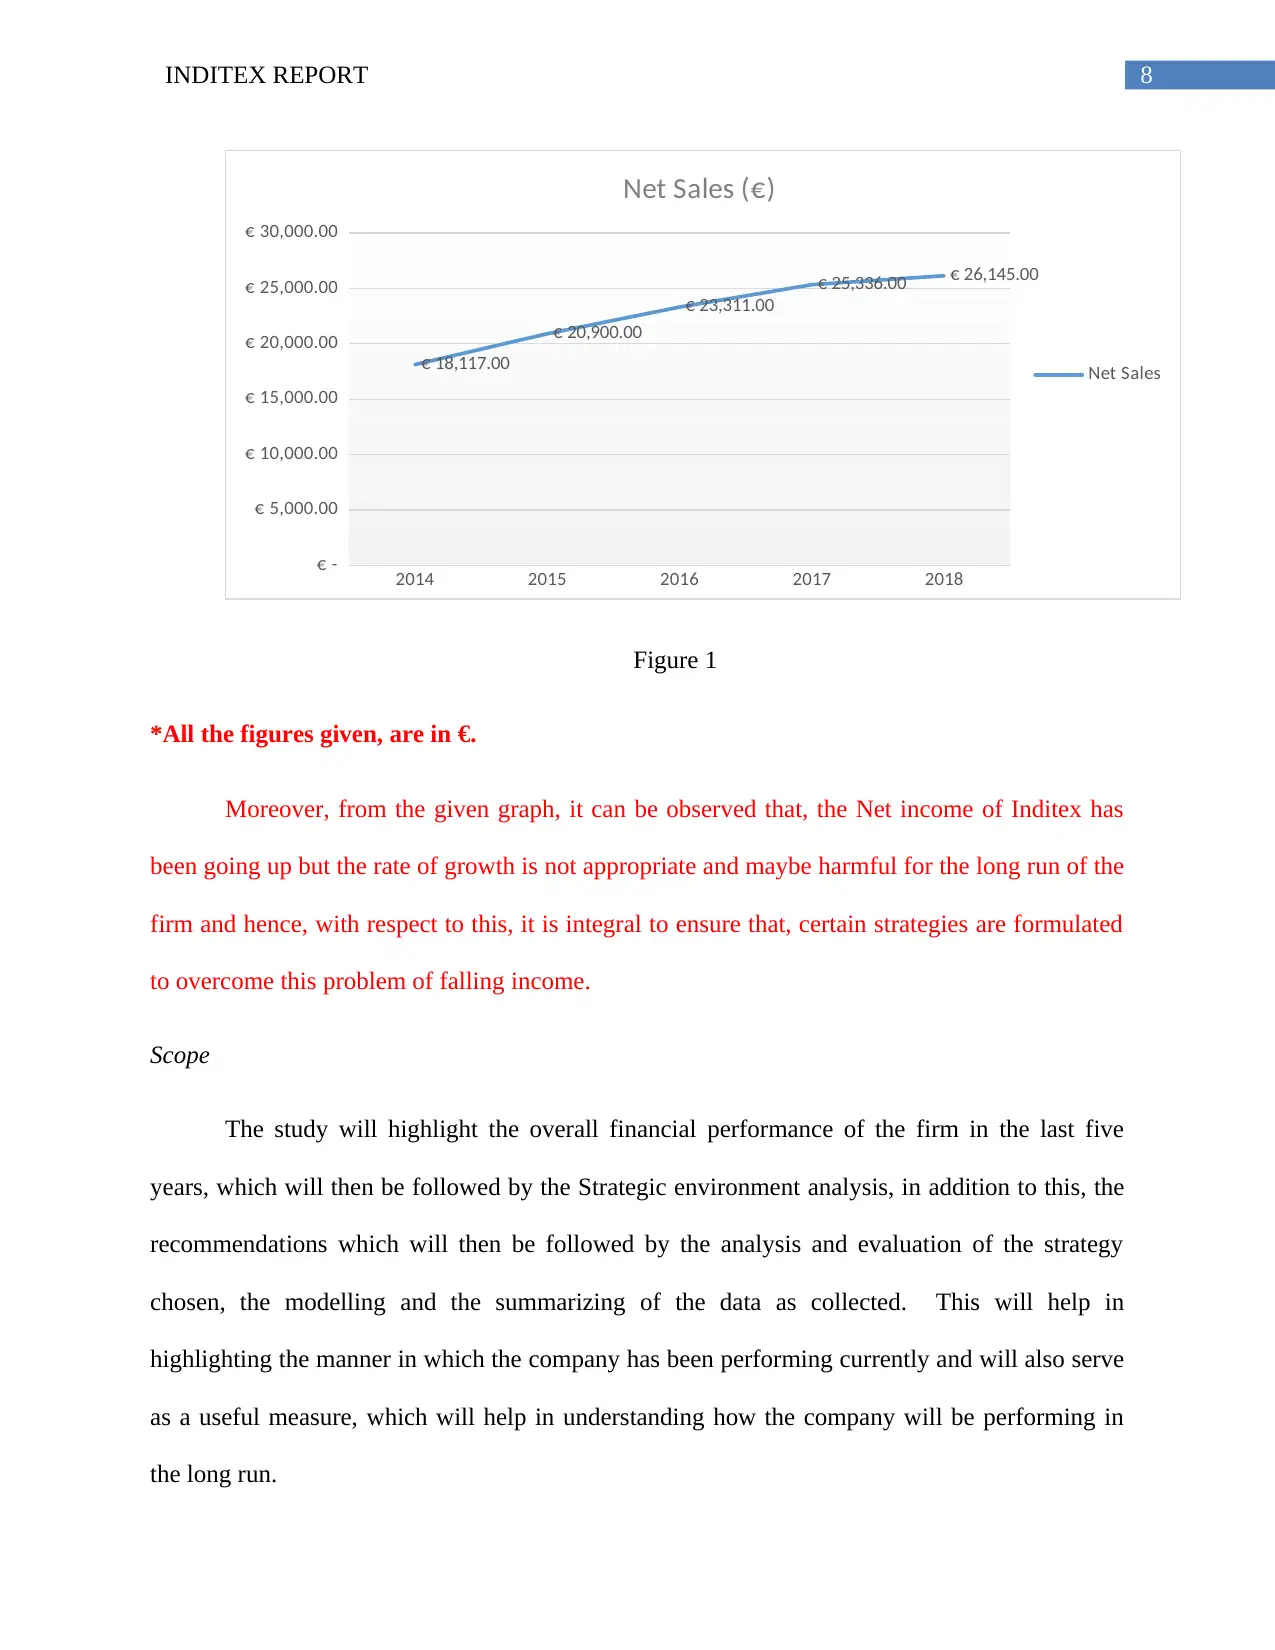
€ 25,336.00 € 26,145.00
Net Sales (€)
Net Sales
Figure 1
*All the figures given, are in €.
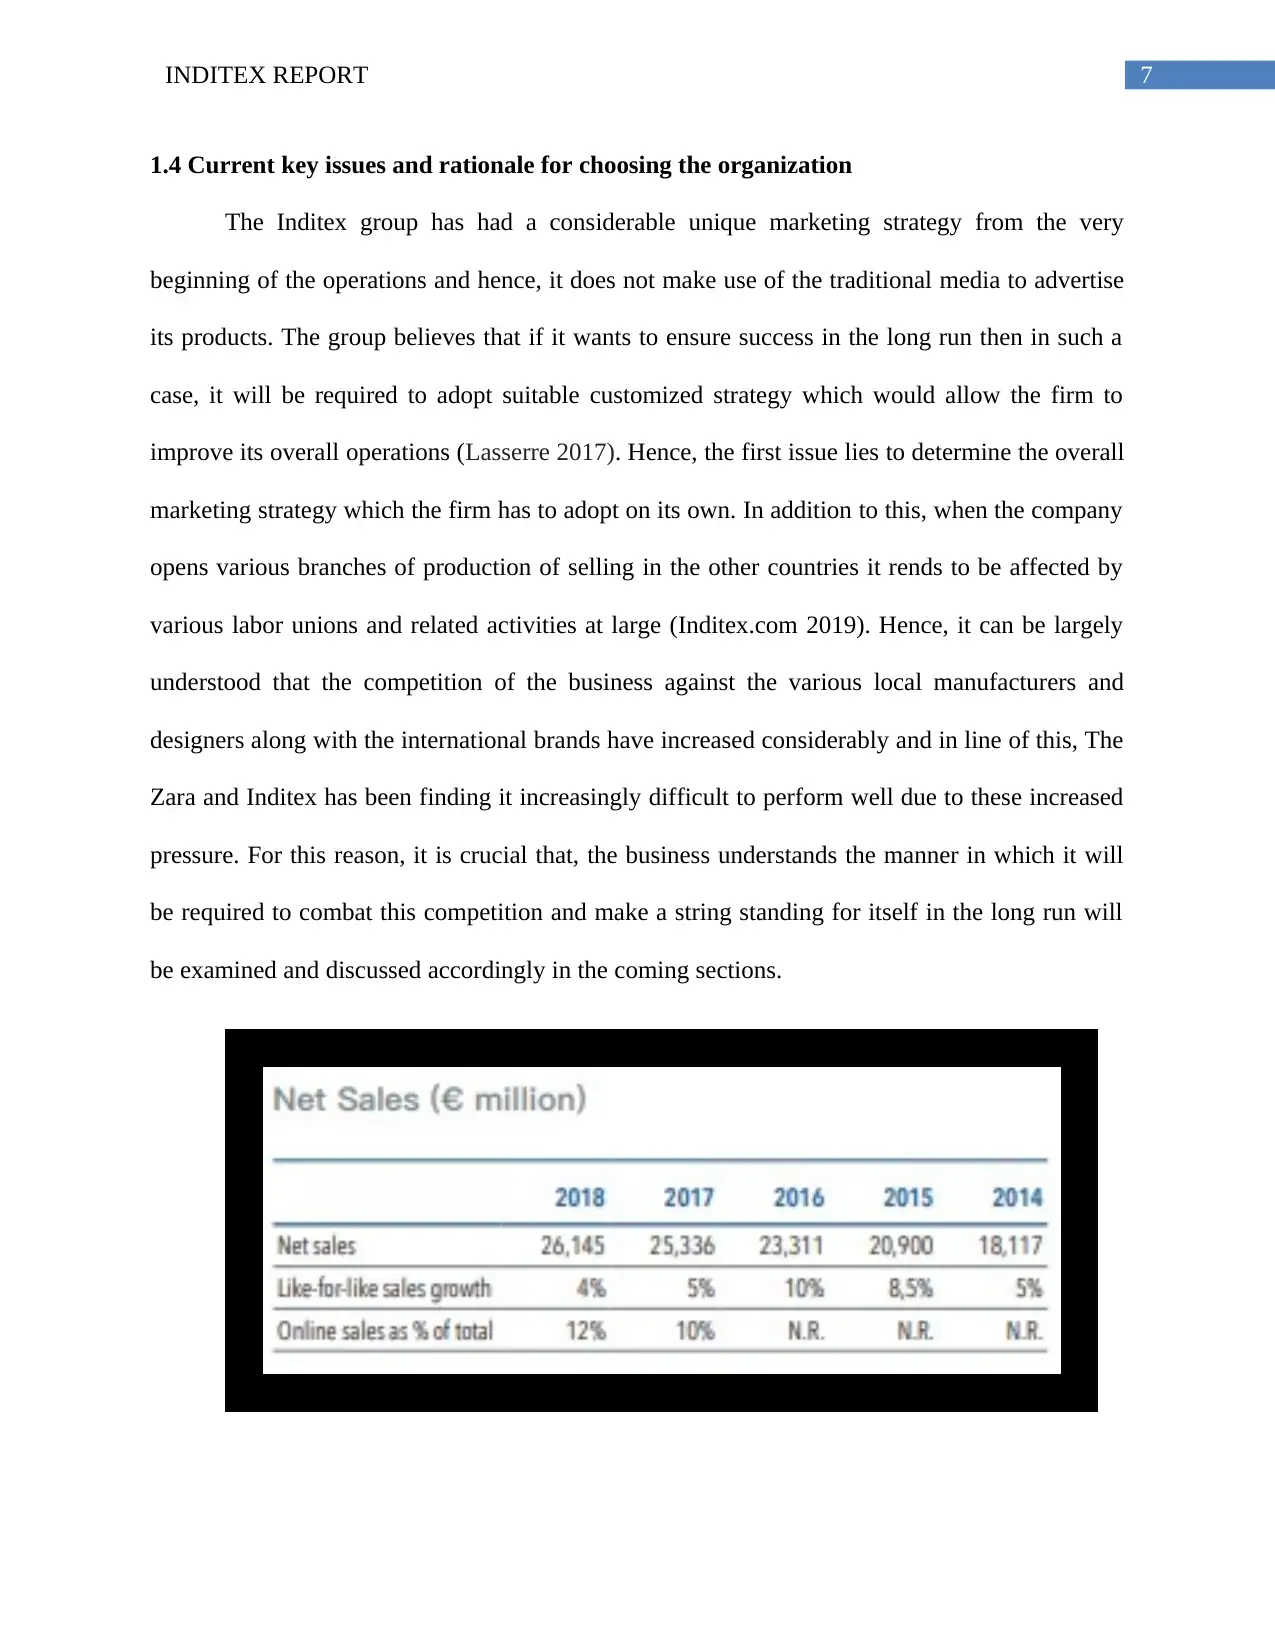
Moreover, from the given graph, it can be observed that, the Net income of Inditex has
been going up but the rate of growth is not appropriate and maybe harmful for the long run of the
firm and hence, with respect to this, it is integral to ensure that, certain strategies are formulated
to overcome this problem of falling income.
Scope
The study will highlight the overall financial performance of the firm in the last five
years, which will then be followed by the Strategic environment analysis, in addition to this, the
recommendations which will then be followed by the analysis and evaluation of the strategy
chosen, the modelling and the summarizing of the data as collected. This will help in
highlighting the manner in which the company has been performing currently and will also serve
as a useful measure, which will help in understanding how the company will be performing in
the long run.
2014 2015 2016 2017 2018
€ -
€ 5,000.00
€ 10,000.00
€ 15,000.00
€ 20,000.00
€ 25,000.00
€ 30,000.00
€ 18,117.00
€ 20,900.00
€ 23,311.00
€ 25,336.00 € 26,145.00
Net Sales (€)
Net Sales
Figure 1
*All the figures given, are in €.
Moreover, from the given graph, it can be observed that, the Net income of Inditex has
been going up but the rate of growth is not appropriate and maybe harmful for the long run of the
firm and hence, with respect to this, it is integral to ensure that, certain strategies are formulated
to overcome this problem of falling income.
Scope
The study will highlight the overall financial performance of the firm in the last five
years, which will then be followed by the Strategic environment analysis, in addition to this, the
recommendations which will then be followed by the analysis and evaluation of the strategy
chosen, the modelling and the summarizing of the data as collected. This will help in
highlighting the manner in which the company has been performing currently and will also serve
as a useful measure, which will help in understanding how the company will be performing in
the long run.
⊘ This is a preview!⊘
Do you want full access?
Subscribe today to unlock all pages.
Trusted by 1+ million students worldwide
9INDITEX REPORT
2. Financial Analysis
The given section seeks to highlight the overall performance of the organization with
respect to the manner in which the firm has been performing in the markets. In order to
understand how the company has been fairing with respect to the rival companies. It is for this
reason that, the performance of the firm will be compared to that of the performance of the firms
like H&M and the GAP. The Financial section will be divided into four different subsections
namely the Profitability section, Liquidity section, Leverage and the Investors.
2.1 Profitability
The profitability ratios can be understood to be the class of metrics which are generally
used to assess the overall ability of a business to perform well or the engage in considerable sales
so as to ensure that they are able to meet up with the exact costs of the business and are being
able to engage in a profit as well. The profitability ratios which will be examined in the
following section can be understood to be as follows:
Gross profit ratio
2018 2017 2016 2015 2014
Inditex 57% 56% 57% 58% 61%
H and M 53% 54% 55% 57% 59%
GAP 38% 38% 36% 36% 38%
Paraphrase This Document
Need a fresh take? Get an instant paraphrase of this document with our AI Paraphraser
10INDITEX REPORT
2018 2017 2016 2015 2014
0%
10%
20%
30%
40%
50%
60%
70%
Gross Profit Ratio (%)
Axis Title
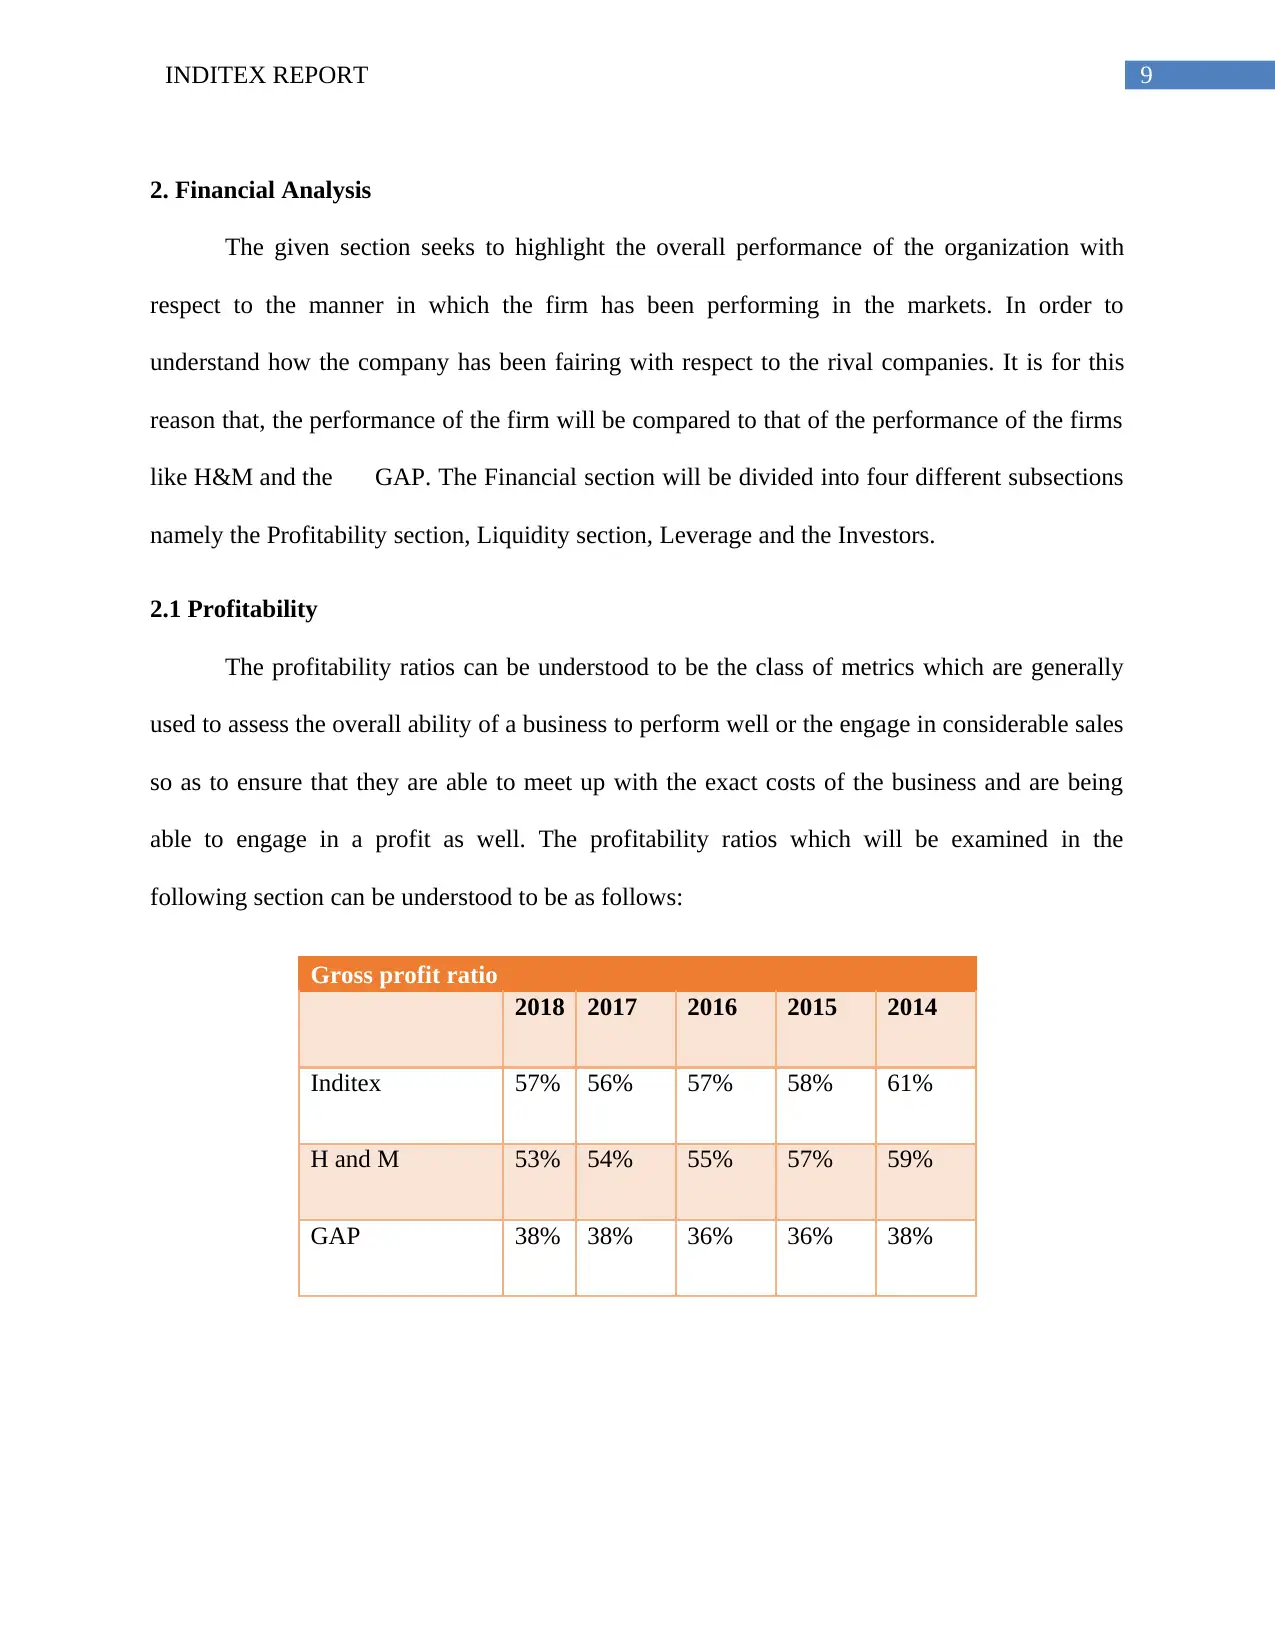
Figure 2: The Gross profit comparison of the companies
From the given analysis, it can be rightfully observed that, the three companies can be
understood to be in a fierce competition with one another. However, the GAP as an organization
has not been performing considerably well and with respect to this, the Gross Profit margin of
the firm can be understood to be considerably low in this case (Yahoo.com 2019). In addition to
this, the gross profit of H& M can be understood to be in alignment with the Inditex but Inditex
can be understood to be the firm which has been performing the best out of the given three
companies with a consistent Gross margin except for the year 2017. In all the years except for
that year, the Gross Margin of the three companies have been considerably high with the closing
margin of 0.56 (57%) for Inditex in 2018.
Net profit ratio
2018 2017 2016 2015 2014
Inditex 13% 13% 14% 14% 15%
H and M 6% 8% 10% 12% 13%
2018 2017 2016 2015 2014
0%
10%
20%
30%
40%
50%
60%
70%
Gross Profit Ratio (%)
Axis Title
Figure 2: The Gross profit comparison of the companies
From the given analysis, it can be rightfully observed that, the three companies can be
understood to be in a fierce competition with one another. However, the GAP as an organization
has not been performing considerably well and with respect to this, the Gross Profit margin of
the firm can be understood to be considerably low in this case (Yahoo.com 2019). In addition to
this, the gross profit of H& M can be understood to be in alignment with the Inditex but Inditex
can be understood to be the firm which has been performing the best out of the given three
companies with a consistent Gross margin except for the year 2017. In all the years except for
that year, the Gross Margin of the three companies have been considerably high with the closing
margin of 0.56 (57%) for Inditex in 2018.
Net profit ratio
2018 2017 2016 2015 2014
Inditex 13% 13% 14% 14% 15%
H and M 6% 8% 10% 12% 13%
11INDITEX REPORT
GAP 6% 5% 4% 6% 8%
2018 2017 2016 2015 2014
0%
2%
4%
6%
8%
10%
12%
14%
16%
18%
Net Profit Ratio (%)
Axis Title
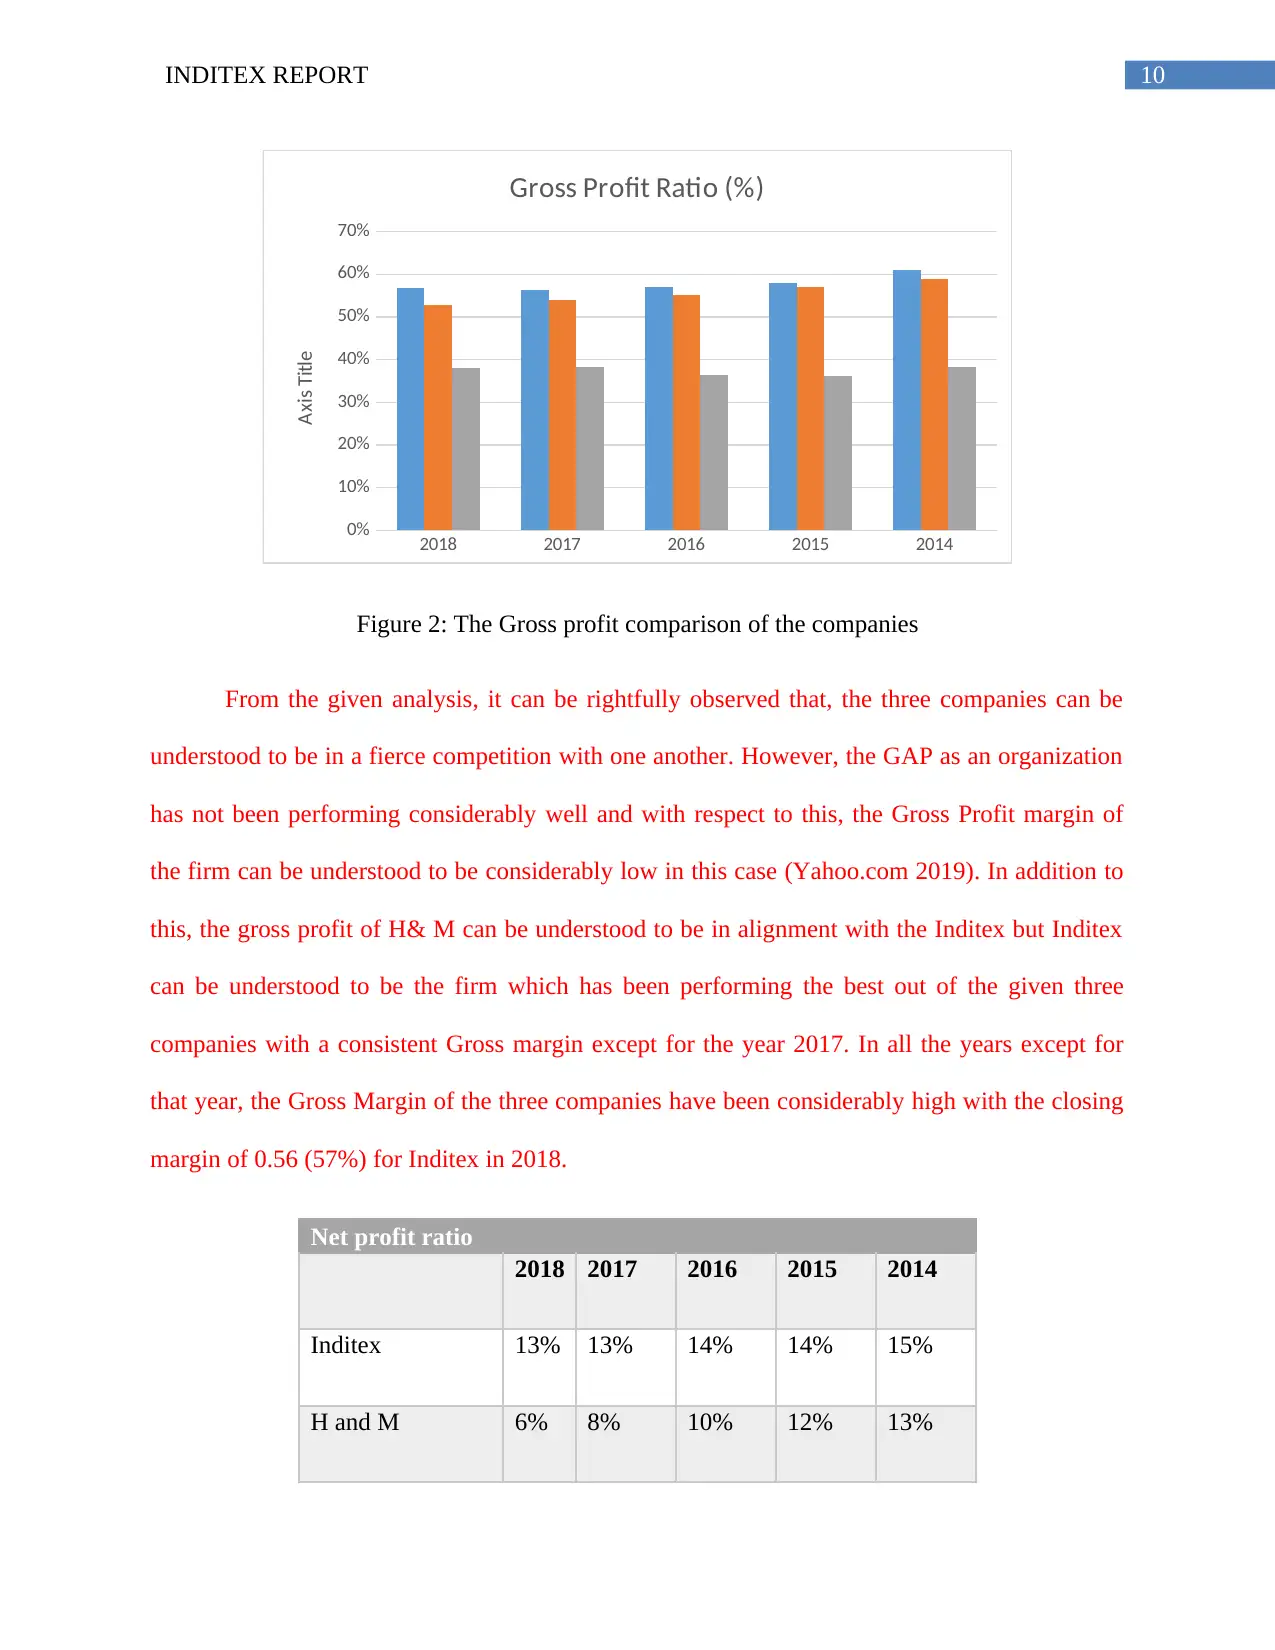
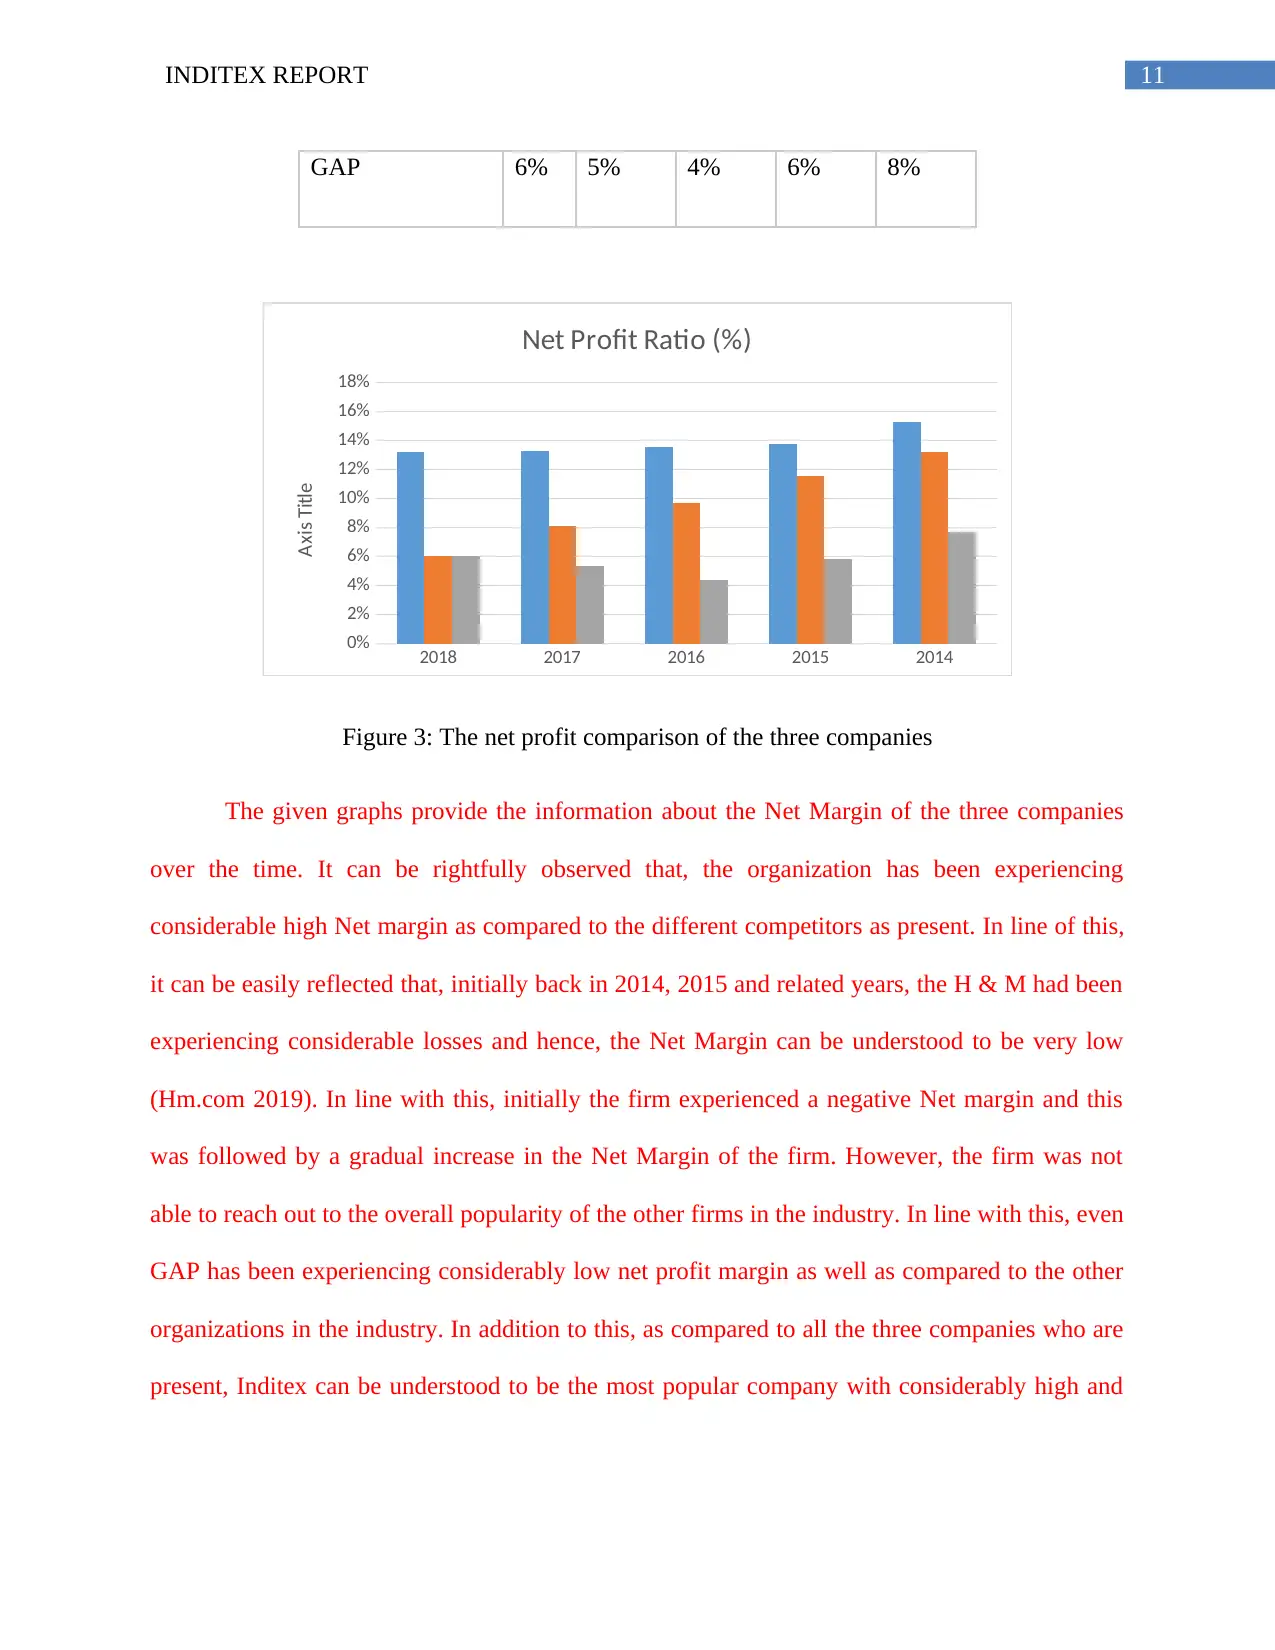
Figure 3: The net profit comparison of the three companies
The given graphs provide the information about the Net Margin of the three companies
over the time. It can be rightfully observed that, the organization has been experiencing
considerable high Net margin as compared to the different competitors as present. In line of this,
it can be easily reflected that, initially back in 2014, 2015 and related years, the H & M had been
experiencing considerable losses and hence, the Net Margin can be understood to be very low
(Hm.com 2019). In line with this, initially the firm experienced a negative Net margin and this
was followed by a gradual increase in the Net Margin of the firm. However, the firm was not
able to reach out to the overall popularity of the other firms in the industry. In line with this, even
GAP has been experiencing considerably low net profit margin as well as compared to the other
organizations in the industry. In addition to this, as compared to all the three companies who are
present, Inditex can be understood to be the most popular company with considerably high and
GAP 6% 5% 4% 6% 8%
2018 2017 2016 2015 2014
0%
2%
4%
6%
8%
10%
12%
14%
16%
18%
Net Profit Ratio (%)
Axis Title
Figure 3: The net profit comparison of the three companies
The given graphs provide the information about the Net Margin of the three companies
over the time. It can be rightfully observed that, the organization has been experiencing
considerable high Net margin as compared to the different competitors as present. In line of this,
it can be easily reflected that, initially back in 2014, 2015 and related years, the H & M had been
experiencing considerable losses and hence, the Net Margin can be understood to be very low
(Hm.com 2019). In line with this, initially the firm experienced a negative Net margin and this
was followed by a gradual increase in the Net Margin of the firm. However, the firm was not
able to reach out to the overall popularity of the other firms in the industry. In line with this, even
GAP has been experiencing considerably low net profit margin as well as compared to the other
organizations in the industry. In addition to this, as compared to all the three companies who are
present, Inditex can be understood to be the most popular company with considerably high and
⊘ This is a preview!⊘
Do you want full access?
Subscribe today to unlock all pages.
Trusted by 1+ million students worldwide
1 out of 57
Related Documents


Your All-in-One AI-Powered Toolkit for Academic Success.
+13062052269
info@desklib.com
Available 24*7 on WhatsApp / Email
![[object Object]](/_next/static/media/star-bottom.7253800d.svg)
Unlock your academic potential
Copyright © 2020–2026 A2Z Services. All Rights Reserved. Developed and managed by ZUCOL.