Individual Assignment Report: ECON 1030 Business Statistics 1 Analysis
VerifiedAdded on 2022/11/25
|16
|3891
|200
Report
AI Summary
This individual assignment for ECON 1030 analyzes the impact of global warming on country growth and development using descriptive statistics, regression analysis, and correlation. The study examines the relationship between mean temperature, precipitation, and annual GDP growth, identifying hot and dry countries and their growth rates. The report calculates sample covariance and correlation, and employs simple and multiple regression to explore these relationships. The findings indicate that there's no significant relationship between the analyzed variables, with the significance value exceeding 0.05. The analysis also highlights the use of various statistical tools and techniques to interpret data and formulate valid conclusions regarding the impacts of temperature on economic growth. The report suggests that the temperature of a country does not necessarily affect the growth rate or possibility of countries and that other factors have a greater influence on annual GDP growth.
ECON 1030 – BUSINESS
STATISTICS 1:
INDIVIDUAL
ASSIGNMENT
STATISTICS 1:
INDIVIDUAL
ASSIGNMENT
Paraphrase This Document
Need a fresh take? Get an instant paraphrase of this document with our AI Paraphraser
EXECUTIVE SUMMARY
In addition to this report also highlighted the fact that multiple regressions outline the
relationship between one dependent factor with two or more independent factors. For the
discussion relating to hypothesis testing and the two tailed hypothesis has been undertaken
along with the interpretation of adjusted R squared value. In the end alternative factors was
suggested for the influence the annual growth of per capita GDP undertakes.
Table of Contents
INTRODUCTION......................................................................................................................4
1.) Analysis of warmer and drier globe on the basis of Descriptive Statistics................4
2.) Analysis of hot countries and dry countries with growth rate to identify their poor
category.................................................................................................................................5
. 3. Calculating the sample covariance and correlation of the two relationships
identified in above question.................................................................................................8
. 4. Simple regression to explore relation between the following.....................................9
5. Multiple regression used for exploring the relationship of annual growth of per capita
GDP with the mean temperature and mean precipitation....................................................10
6. Illustration of....................................................................................................................11
7. Interpreting the adjusted R squared within the multiple regression analysis...................12
8. Additional data for the study of factors which can influence the annual growth of per
capita GDP...........................................................................................................................13
CONCLUSION........................................................................................................................14
REFERENCES.........................................................................................................................15
⊘ This is a preview!⊘
Do you want full access?
Subscribe today to unlock all pages.
Trusted by 1+ million students worldwide
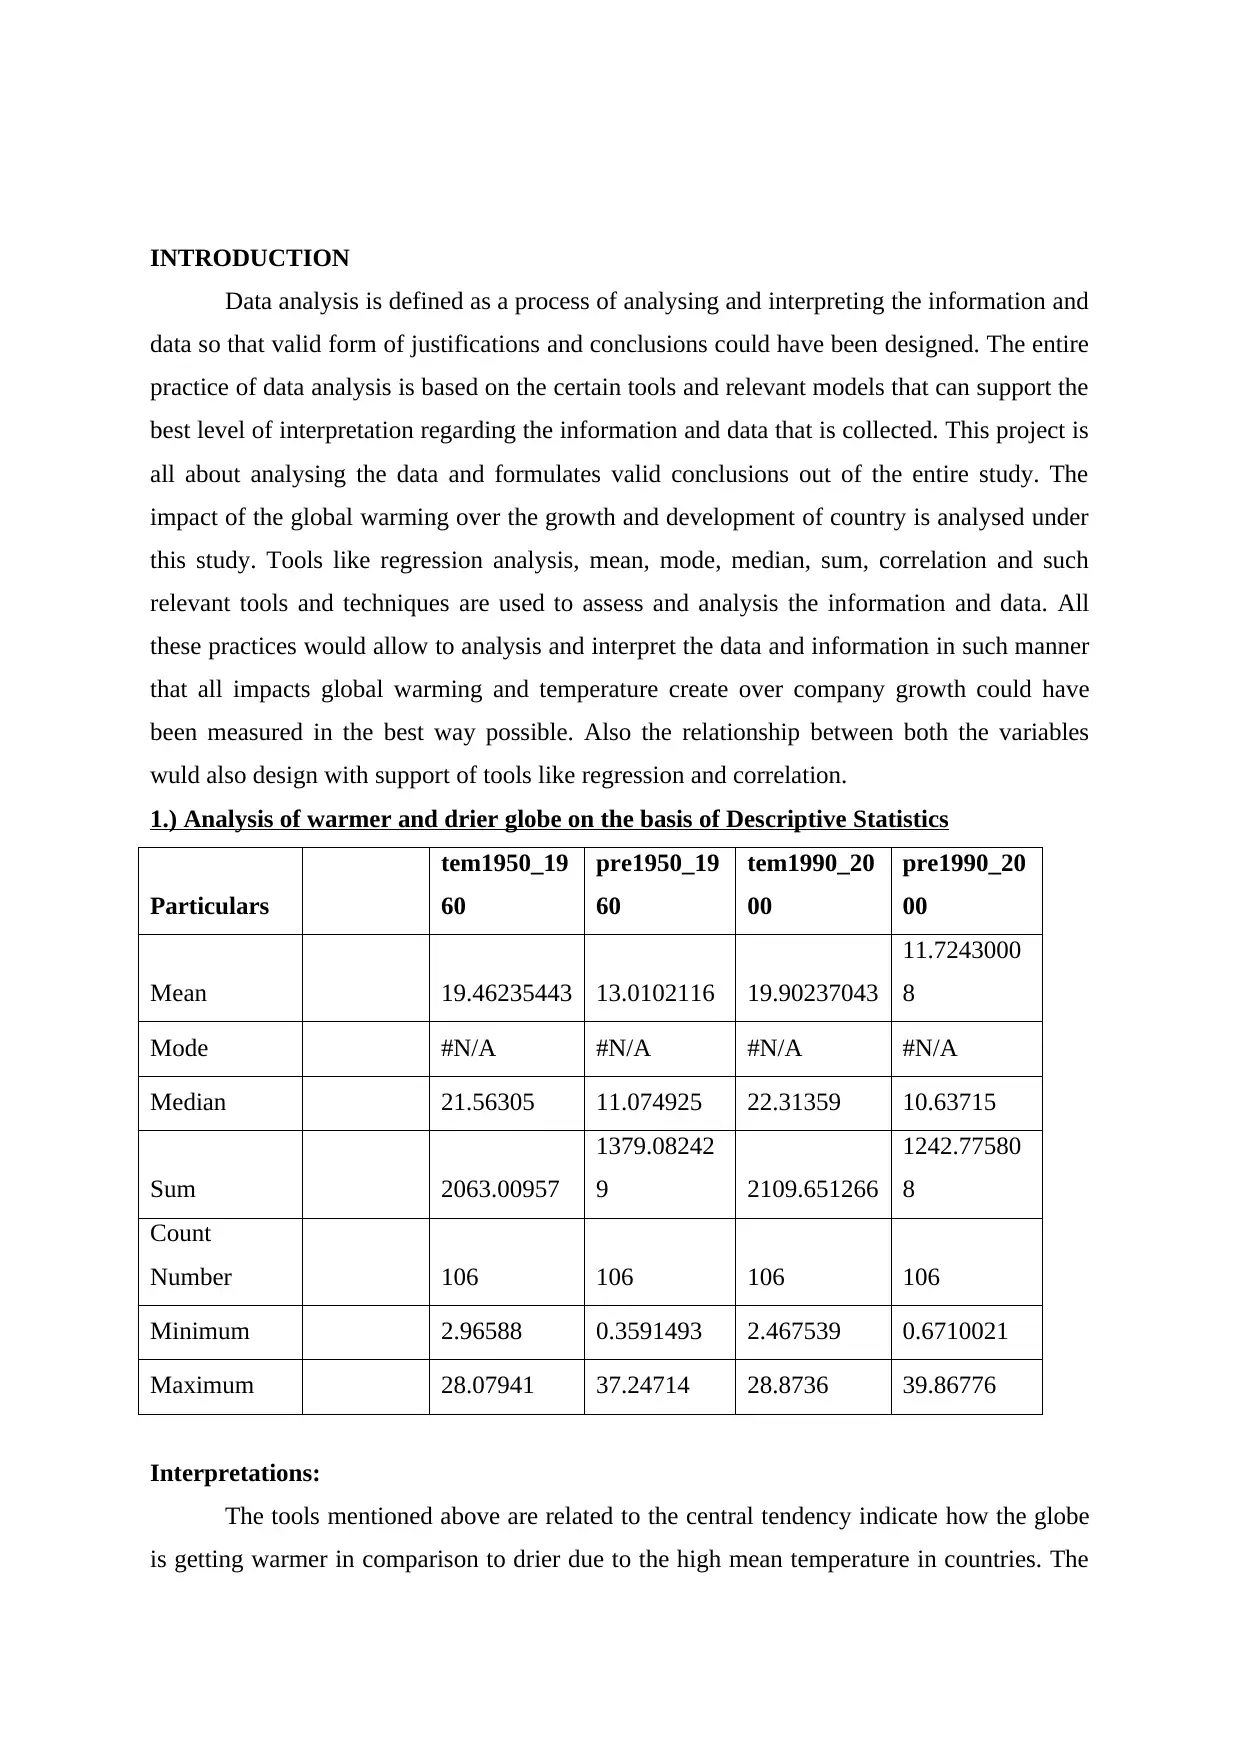
INTRODUCTION
Data analysis is defined as a process of analysing and interpreting the information and
data so that valid form of justifications and conclusions could have been designed. The entire
practice of data analysis is based on the certain tools and relevant models that can support the
best level of interpretation regarding the information and data that is collected. This project is
all about analysing the data and formulates valid conclusions out of the entire study. The
impact of the global warming over the growth and development of country is analysed under
this study. Tools like regression analysis, mean, mode, median, sum, correlation and such
relevant tools and techniques are used to assess and analysis the information and data. All
these practices would allow to analysis and interpret the data and information in such manner
that all impacts global warming and temperature create over company growth could have
been measured in the best way possible. Also the relationship between both the variables
wuld also design with support of tools like regression and correlation.
1.) Analysis of warmer and drier globe on the basis of Descriptive Statistics
Particulars
tem1950_19
60
pre1950_19
60
tem1990_20
00
pre1990_20
00
Mean 19.46235443 13.0102116 19.90237043
11.7243000
8
Mode #N/A #N/A #N/A #N/A
Median 21.56305 11.074925 22.31359 10.63715
Sum 2063.00957
1379.08242
9 2109.651266
1242.77580
8
Count
Number 106 106 106 106
Minimum 2.96588 0.3591493 2.467539 0.6710021
Maximum 28.07941 37.24714 28.8736 39.86776
Interpretations:
The tools mentioned above are related to the central tendency indicate how the globe
is getting warmer in comparison to drier due to the high mean temperature in countries. The
Paraphrase This Document
Need a fresh take? Get an instant paraphrase of this document with our AI Paraphraser
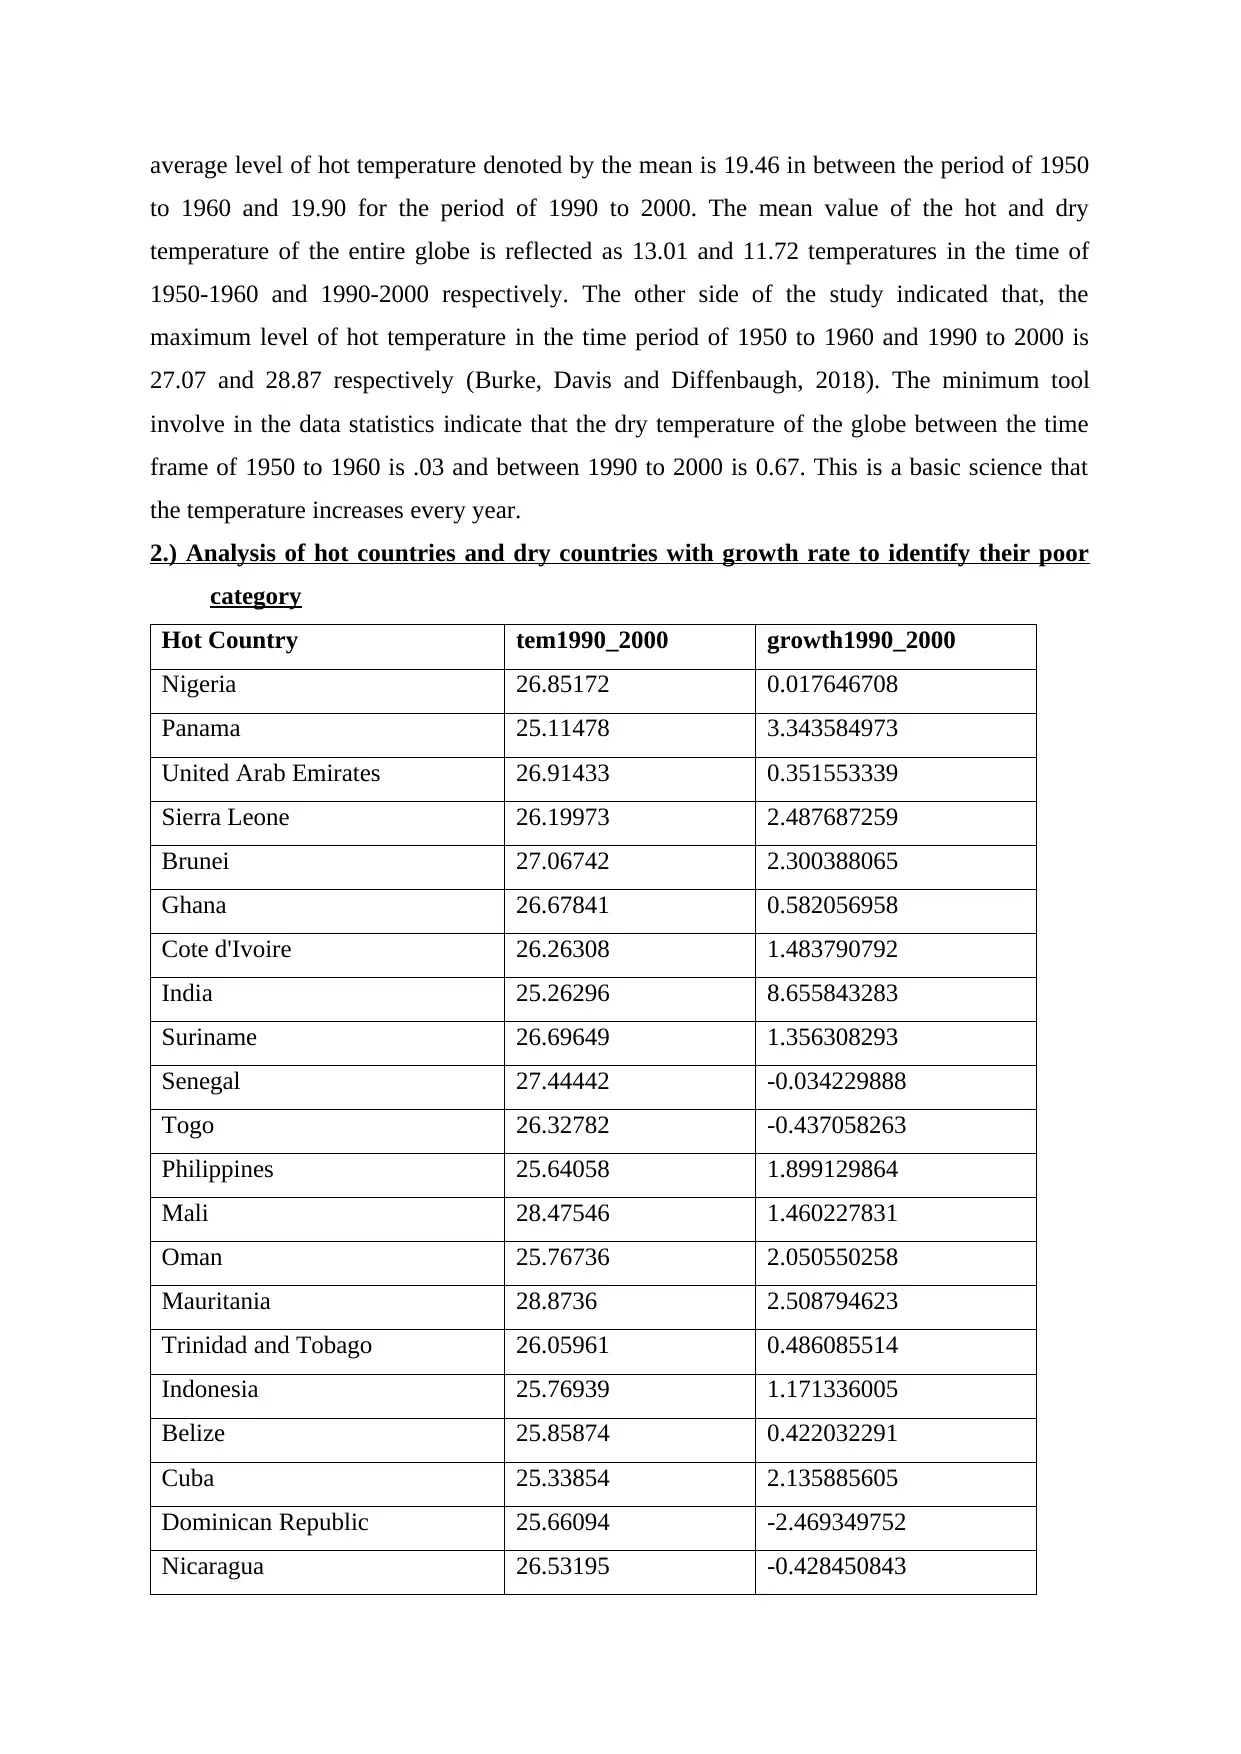
average level of hot temperature denoted by the mean is 19.46 in between the period of 1950
to 1960 and 19.90 for the period of 1990 to 2000. The mean value of the hot and dry
temperature of the entire globe is reflected as 13.01 and 11.72 temperatures in the time of
1950-1960 and 1990-2000 respectively. The other side of the study indicated that, the
maximum level of hot temperature in the time period of 1950 to 1960 and 1990 to 2000 is
27.07 and 28.87 respectively (Burke, Davis and Diffenbaugh, 2018). The minimum tool
involve in the data statistics indicate that the dry temperature of the globe between the time
frame of 1950 to 1960 is .03 and between 1990 to 2000 is 0.67. This is a basic science that
the temperature increases every year.
2.) Analysis of hot countries and dry countries with growth rate to identify their poor
category
Hot Country tem1990_2000 growth1990_2000
Nigeria 26.85172 0.017646708
Panama 25.11478 3.343584973
United Arab Emirates 26.91433 0.351553339
Sierra Leone 26.19973 2.487687259
Brunei 27.06742 2.300388065
Ghana 26.67841 0.582056958
Cote d'Ivoire 26.26308 1.483790792
India 25.26296 8.655843283
Suriname 26.69649 1.356308293
Senegal 27.44442 -0.034229888
Togo 26.32782 -0.437058263
Philippines 25.64058 1.899129864
Mali 28.47546 1.460227831
Oman 25.76736 2.050550258
Mauritania 28.8736 2.508794623
Trinidad and Tobago 26.05961 0.486085514
Indonesia 25.76939 1.171336005
Belize 25.85874 0.422032291
Cuba 25.33854 2.135885605
Dominican Republic 25.66094 -2.469349752
Nicaragua 26.53195 -0.428450843
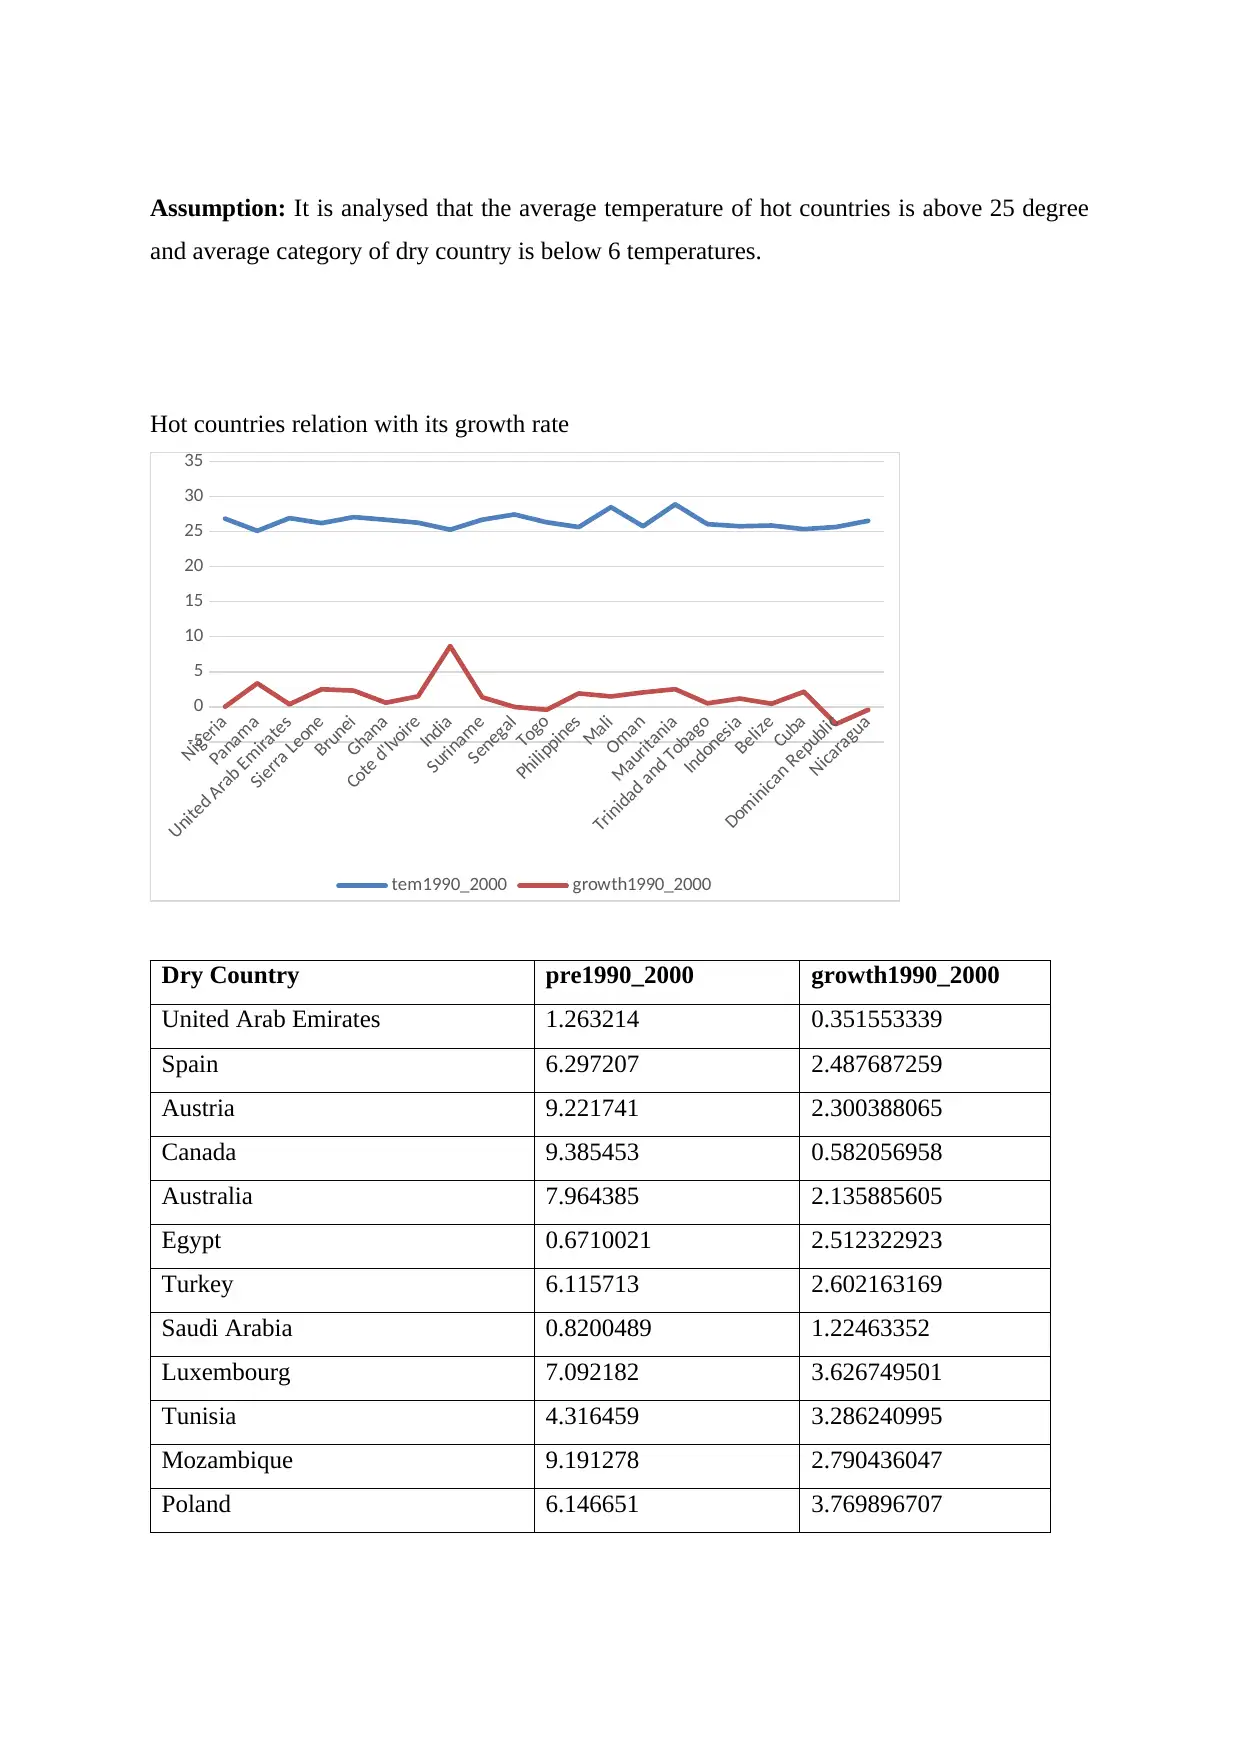
Assumption: It is analysed that the average temperature of hot countries is above 25 degree
and average category of dry country is below 6 temperatures.
Hot countries relation with its growth rate
Nigeria
Panama
United Arab Emirates
Sierra Leone
Brunei
Ghana
Cote d'Ivoire
India
Suriname
Senegal
Togo
Philippines
Mali
Oman
Mauritania
Trinidad and Tobago
Indonesia
Belize
Cuba
Dominican Republic
Nicaragua
-5
0
5
10
15
20
25
30
35
tem1990_2000 growth1990_2000
Dry Country pre1990_2000 growth1990_2000
United Arab Emirates 1.263214 0.351553339
Spain 6.297207 2.487687259
Austria 9.221741 2.300388065
Canada 9.385453 0.582056958
Australia 7.964385 2.135885605
Egypt 0.6710021 2.512322923
Turkey 6.115713 2.602163169
Saudi Arabia 0.8200489 1.22463352
Luxembourg 7.092182 3.626749501
Tunisia 4.316459 3.286240995
Mozambique 9.191278 2.790436047
Poland 6.146651 3.769896707
⊘ This is a preview!⊘
Do you want full access?
Subscribe today to unlock all pages.
Trusted by 1+ million students worldwide
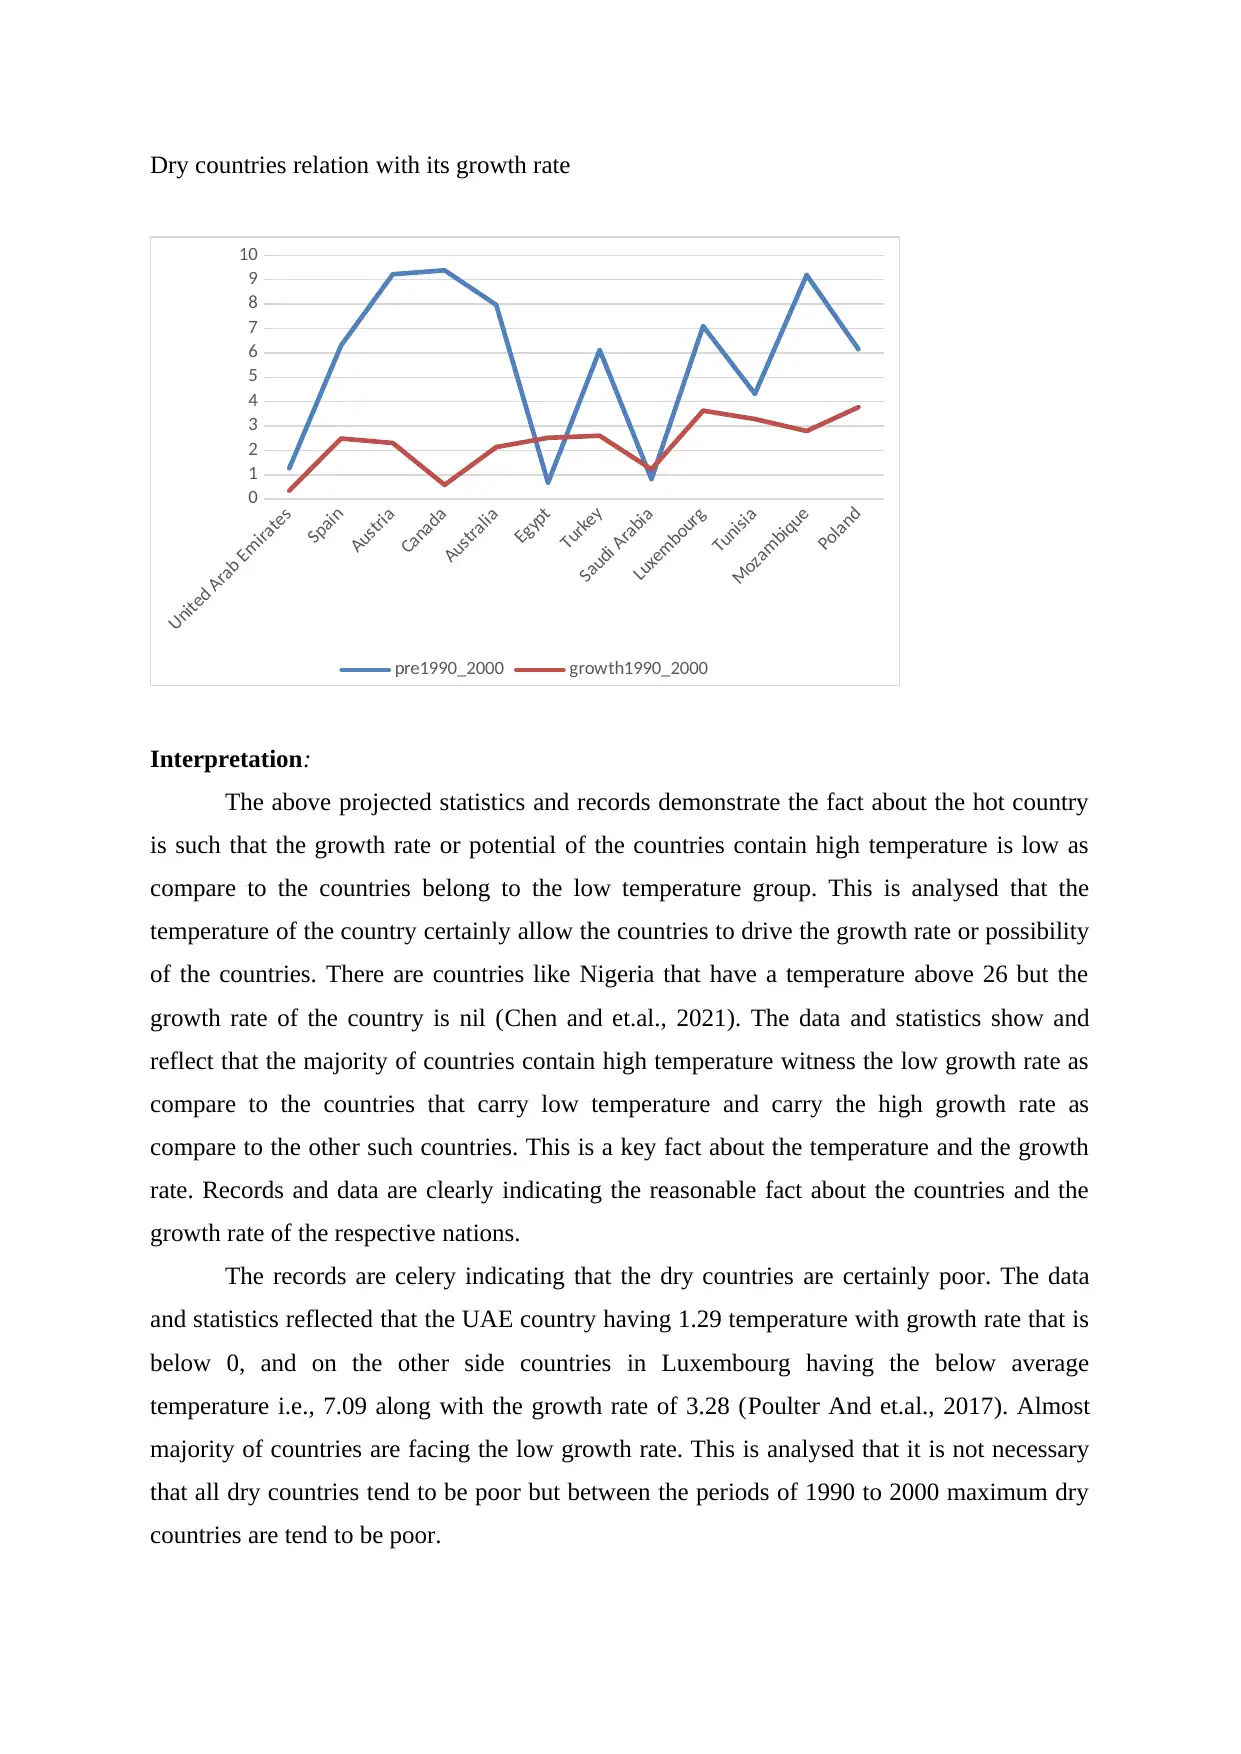
Dry countries relation with its growth rate
United Arab Emirates
Spain
Austria
Canada
Australia
Egypt
Turkey
Saudi Arabia
Luxembourg
Tunisia
Mozambique
Poland
0
1
2
3
4
5
6
7
8
9
10
pre1990_2000 growth1990_2000
Interpretation:
The above projected statistics and records demonstrate the fact about the hot country
is such that the growth rate or potential of the countries contain high temperature is low as
compare to the countries belong to the low temperature group. This is analysed that the
temperature of the country certainly allow the countries to drive the growth rate or possibility
of the countries. There are countries like Nigeria that have a temperature above 26 but the
growth rate of the country is nil (Chen and et.al., 2021). The data and statistics show and
reflect that the majority of countries contain high temperature witness the low growth rate as
compare to the countries that carry low temperature and carry the high growth rate as
compare to the other such countries. This is a key fact about the temperature and the growth
rate. Records and data are clearly indicating the reasonable fact about the countries and the
growth rate of the respective nations.
The records are celery indicating that the dry countries are certainly poor. The data
and statistics reflected that the UAE country having 1.29 temperature with growth rate that is
below 0, and on the other side countries in Luxembourg having the below average
temperature i.e., 7.09 along with the growth rate of 3.28 (Poulter And et.al., 2017). Almost
majority of countries are facing the low growth rate. This is analysed that it is not necessary
that all dry countries tend to be poor but between the periods of 1990 to 2000 maximum dry
countries are tend to be poor.
Paraphrase This Document
Need a fresh take? Get an instant paraphrase of this document with our AI Paraphraser
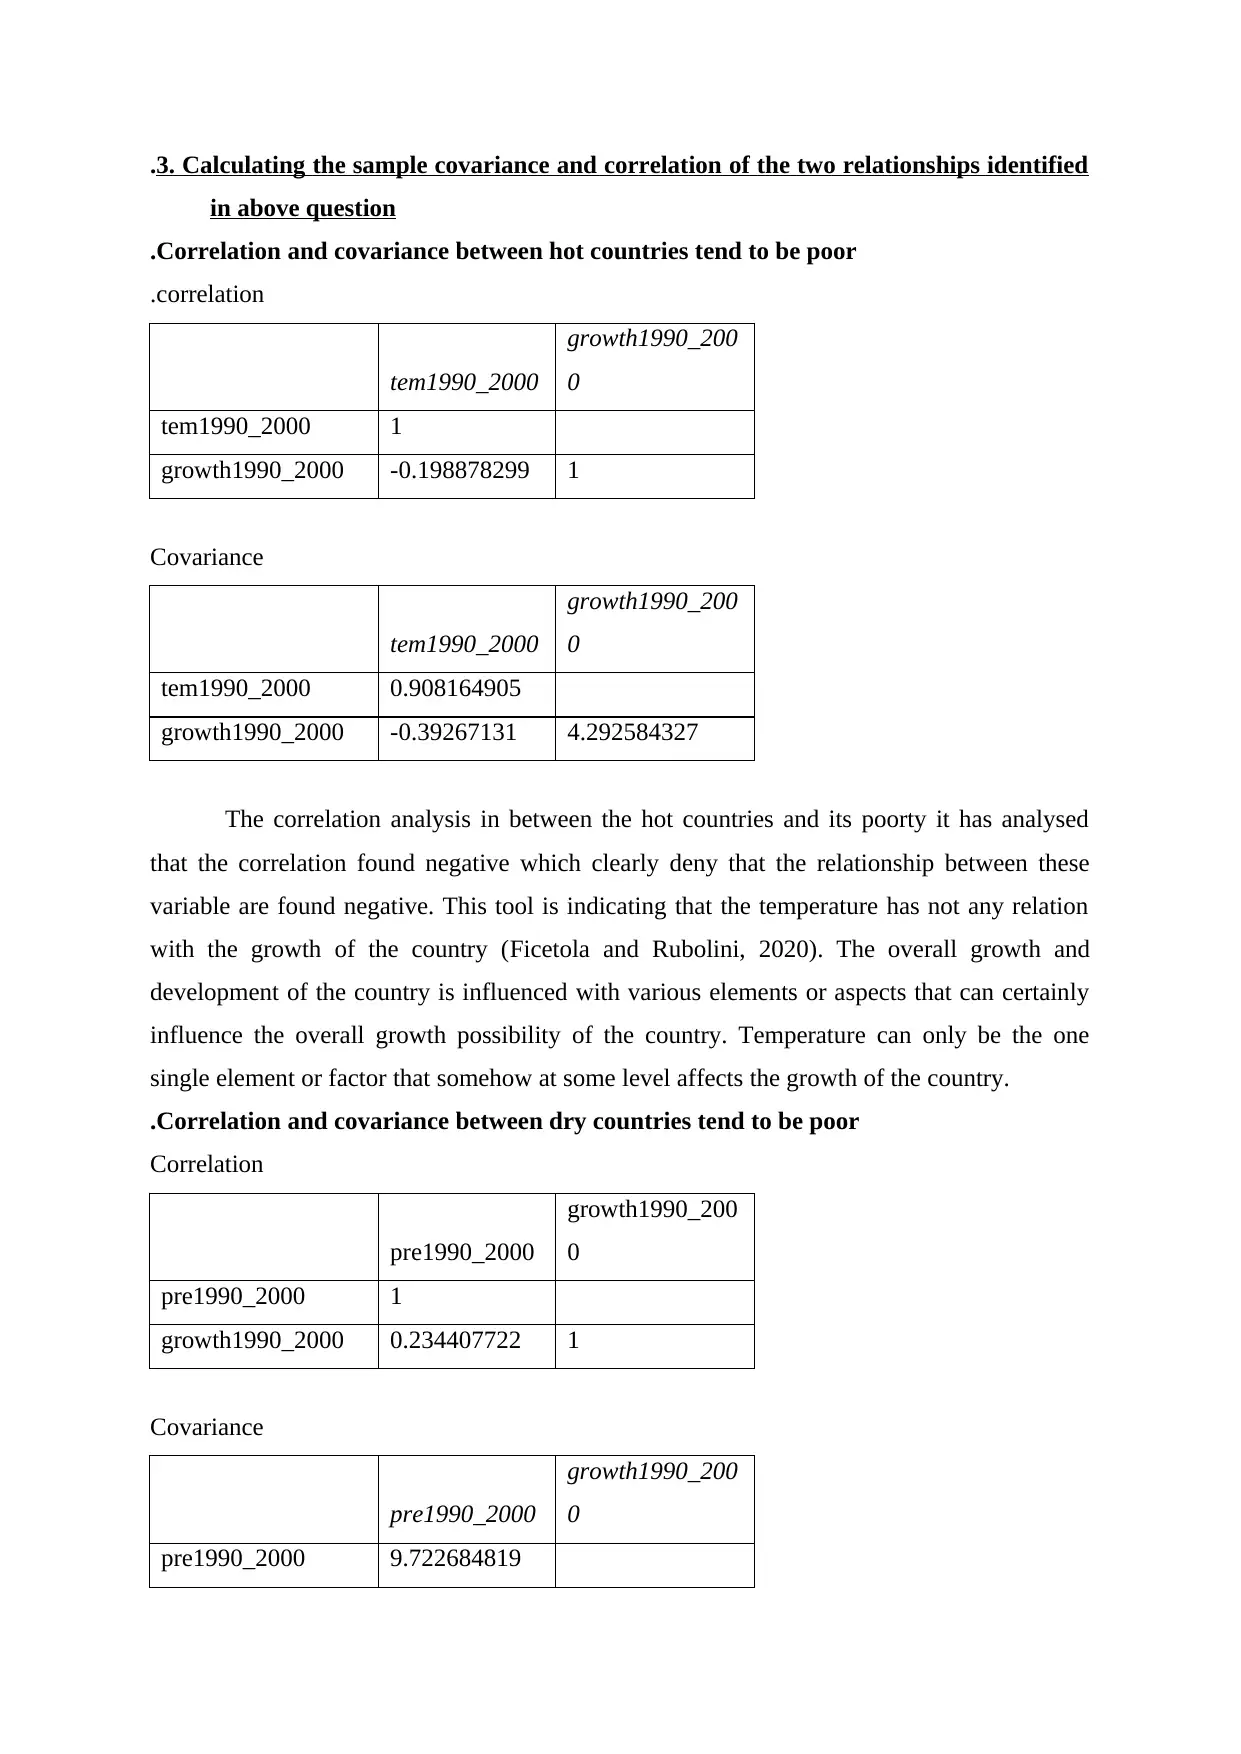
.3. Calculating the sample covariance and correlation of the two relationships identified
in above question
.Correlation and covariance between hot countries tend to be poor
.correlation
tem1990_2000
growth1990_200
0
tem1990_2000 1
growth1990_2000 -0.198878299 1
Covariance
tem1990_2000
growth1990_200
0
tem1990_2000 0.908164905
growth1990_2000 -0.39267131 4.292584327
The correlation analysis in between the hot countries and its poorty it has analysed
that the correlation found negative which clearly deny that the relationship between these
variable are found negative. This tool is indicating that the temperature has not any relation
with the growth of the country (Ficetola and Rubolini, 2020). The overall growth and
development of the country is influenced with various elements or aspects that can certainly
influence the overall growth possibility of the country. Temperature can only be the one
single element or factor that somehow at some level affects the growth of the country.
.Correlation and covariance between dry countries tend to be poor
Correlation
pre1990_2000
growth1990_200
0
pre1990_2000 1
growth1990_2000 0.234407722 1
Covariance
pre1990_2000
growth1990_200
0
pre1990_2000 9.722684819
growth1990_2000 0.767642507 1.103031703
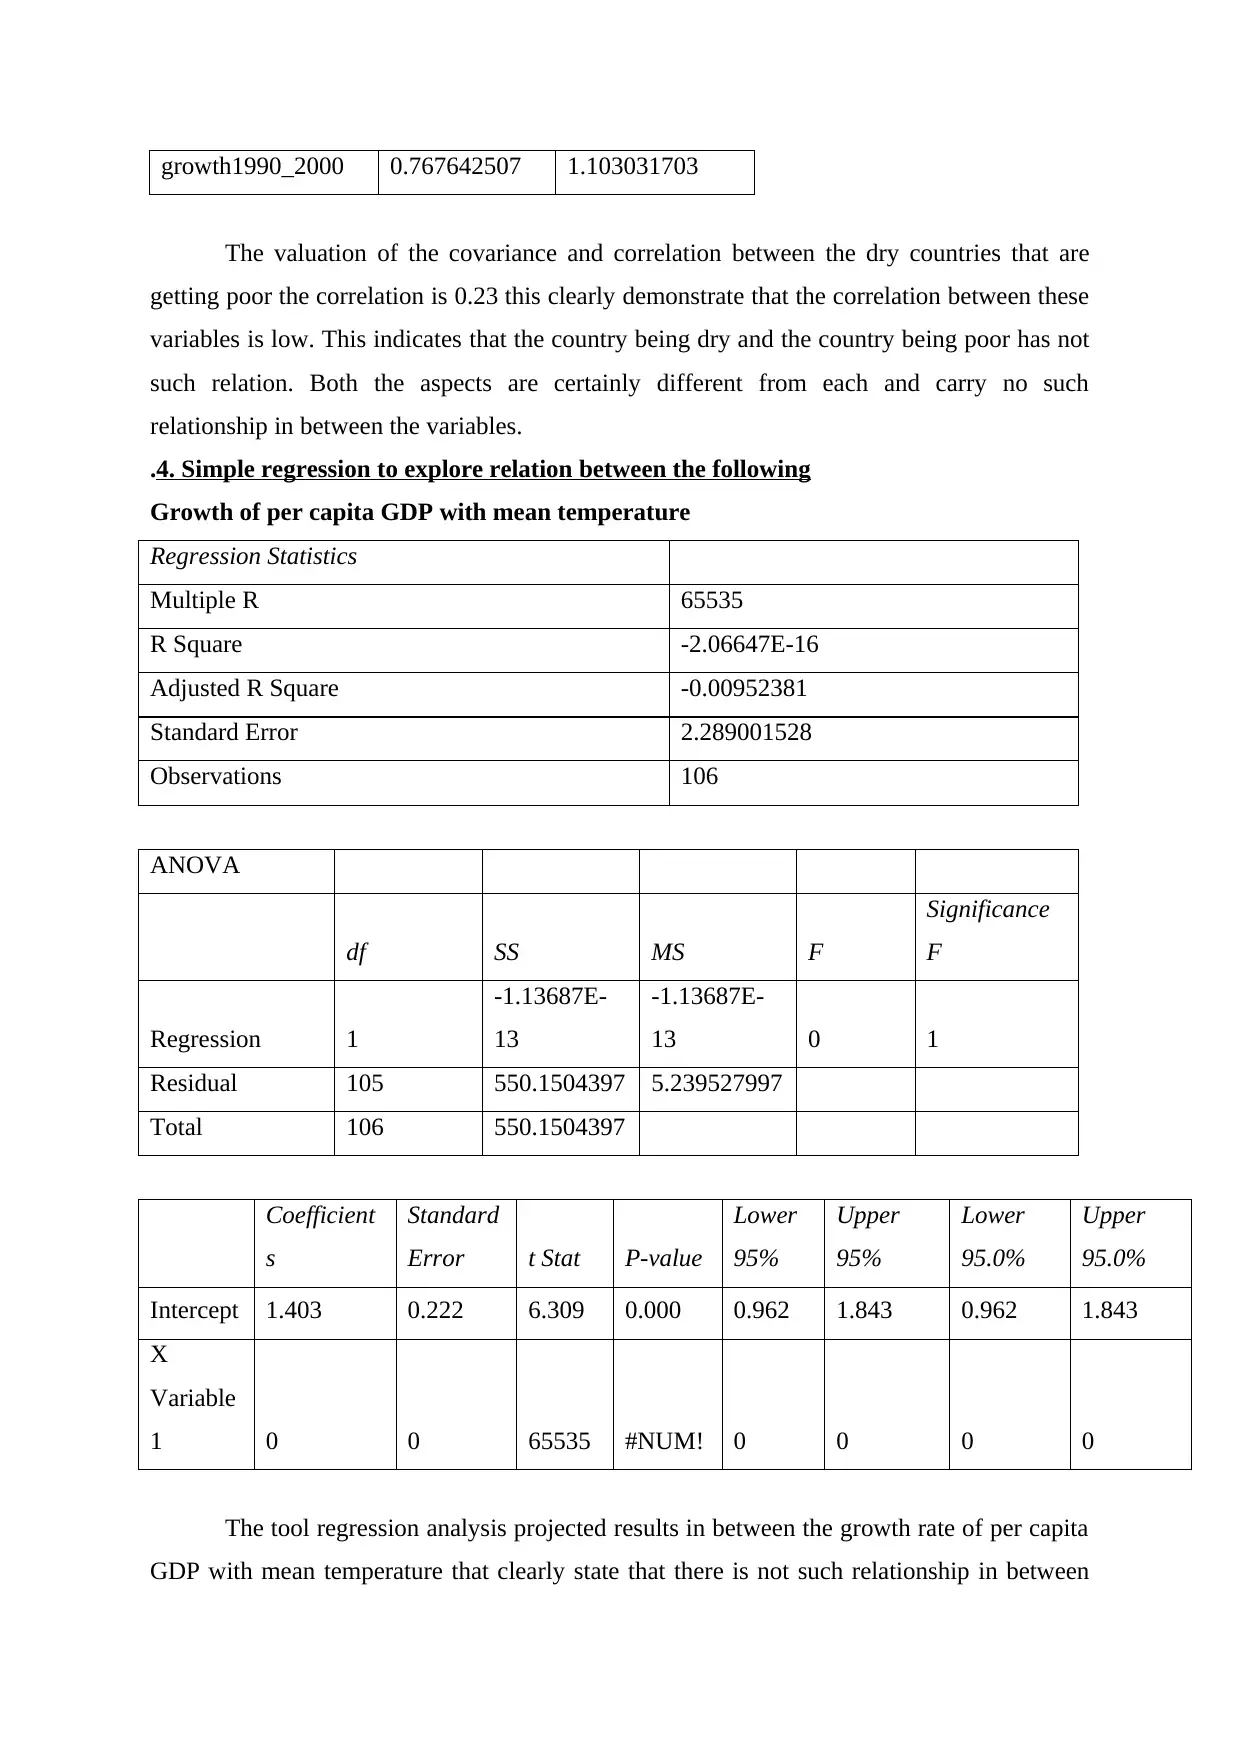
The valuation of the covariance and correlation between the dry countries that are
getting poor the correlation is 0.23 this clearly demonstrate that the correlation between these
variables is low. This indicates that the country being dry and the country being poor has not
such relation. Both the aspects are certainly different from each and carry no such
relationship in between the variables.
.4. Simple regression to explore relation between the following
Growth of per capita GDP with mean temperature
Regression Statistics
Multiple R 65535
R Square -2.06647E-16
Adjusted R Square -0.00952381
Standard Error 2.289001528
Observations 106
ANOVA
df SS MS F
Significance
F
Regression 1
-1.13687E-
13
-1.13687E-
13 0 1
Residual 105 550.1504397 5.239527997
Total 106 550.1504397
Coefficient
s
Standard
Error t Stat P-value
Lower
95%
Upper
95%
Lower
95.0%
Upper
95.0%
Intercept 1.403 0.222 6.309 0.000 0.962 1.843 0.962 1.843
X
Variable
1 0 0 65535 #NUM! 0 0 0 0
The tool regression analysis projected results in between the growth rate of per capita
GDP with mean temperature that clearly state that there is not such relationship in between
⊘ This is a preview!⊘
Do you want full access?
Subscribe today to unlock all pages.
Trusted by 1+ million students worldwide
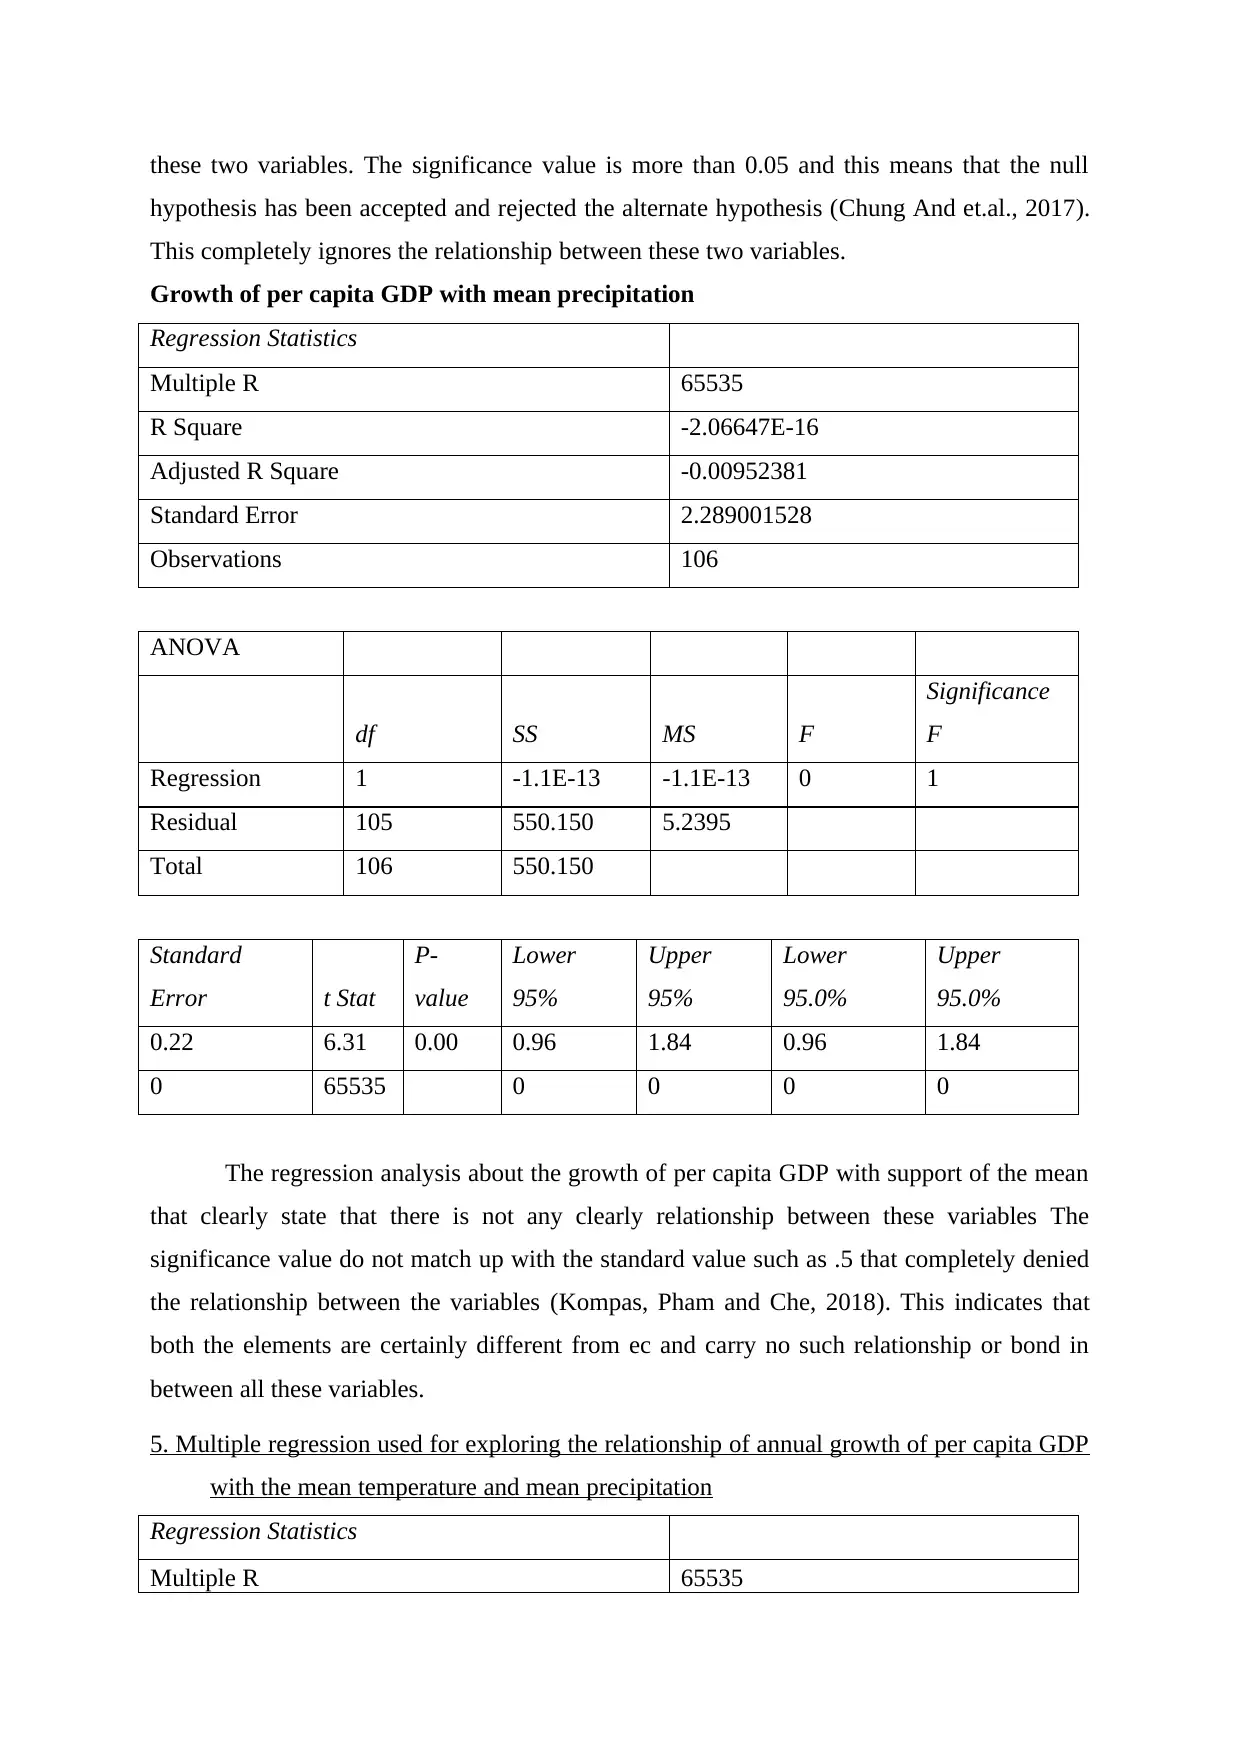
these two variables. The significance value is more than 0.05 and this means that the null
hypothesis has been accepted and rejected the alternate hypothesis (Chung And et.al., 2017).
This completely ignores the relationship between these two variables.
Growth of per capita GDP with mean precipitation
Regression Statistics
Multiple R 65535
R Square -2.06647E-16
Adjusted R Square -0.00952381
Standard Error 2.289001528
Observations 106
ANOVA
df SS MS F
Significance
F
Regression 1 -1.1E-13 -1.1E-13 0 1
Residual 105 550.150 5.2395
Total 106 550.150
Standard
Error t Stat
P-
value
Lower
95%
Upper
95%
Lower
95.0%
Upper
95.0%
0.22 6.31 0.00 0.96 1.84 0.96 1.84
0 65535 0 0 0 0
The regression analysis about the growth of per capita GDP with support of the mean
that clearly state that there is not any clearly relationship between these variables The
significance value do not match up with the standard value such as .5 that completely denied
the relationship between the variables (Kompas, Pham and Che, 2018). This indicates that
both the elements are certainly different from ec and carry no such relationship or bond in
between all these variables.
5. Multiple regression used for exploring the relationship of annual growth of per capita GDP
with the mean temperature and mean precipitation
Regression Statistics
Multiple R 65535
Paraphrase This Document
Need a fresh take? Get an instant paraphrase of this document with our AI Paraphraser
R Square -2.1E-16
Adjusted R Square -1.9E-02
Standard Error 2.3E+00
Observations 106
.
ANOVA
df SS MS F
Significance
F
Regression 2 -1.1E-13 -5.7E-14 0 1
Residual 105 550.150 5.240
Total 107 550.150
.
Standard
Error t Stat
P-
value
Lower
95%
Upper
95%
Lower
95.0%
Upper
95.0%
0.222 6.309 0.000 0.962 1.843 0.962 1.843
0 65535
#NUM
! 0 0 0 0
0 65535
#NUM
! 0 0 0 0
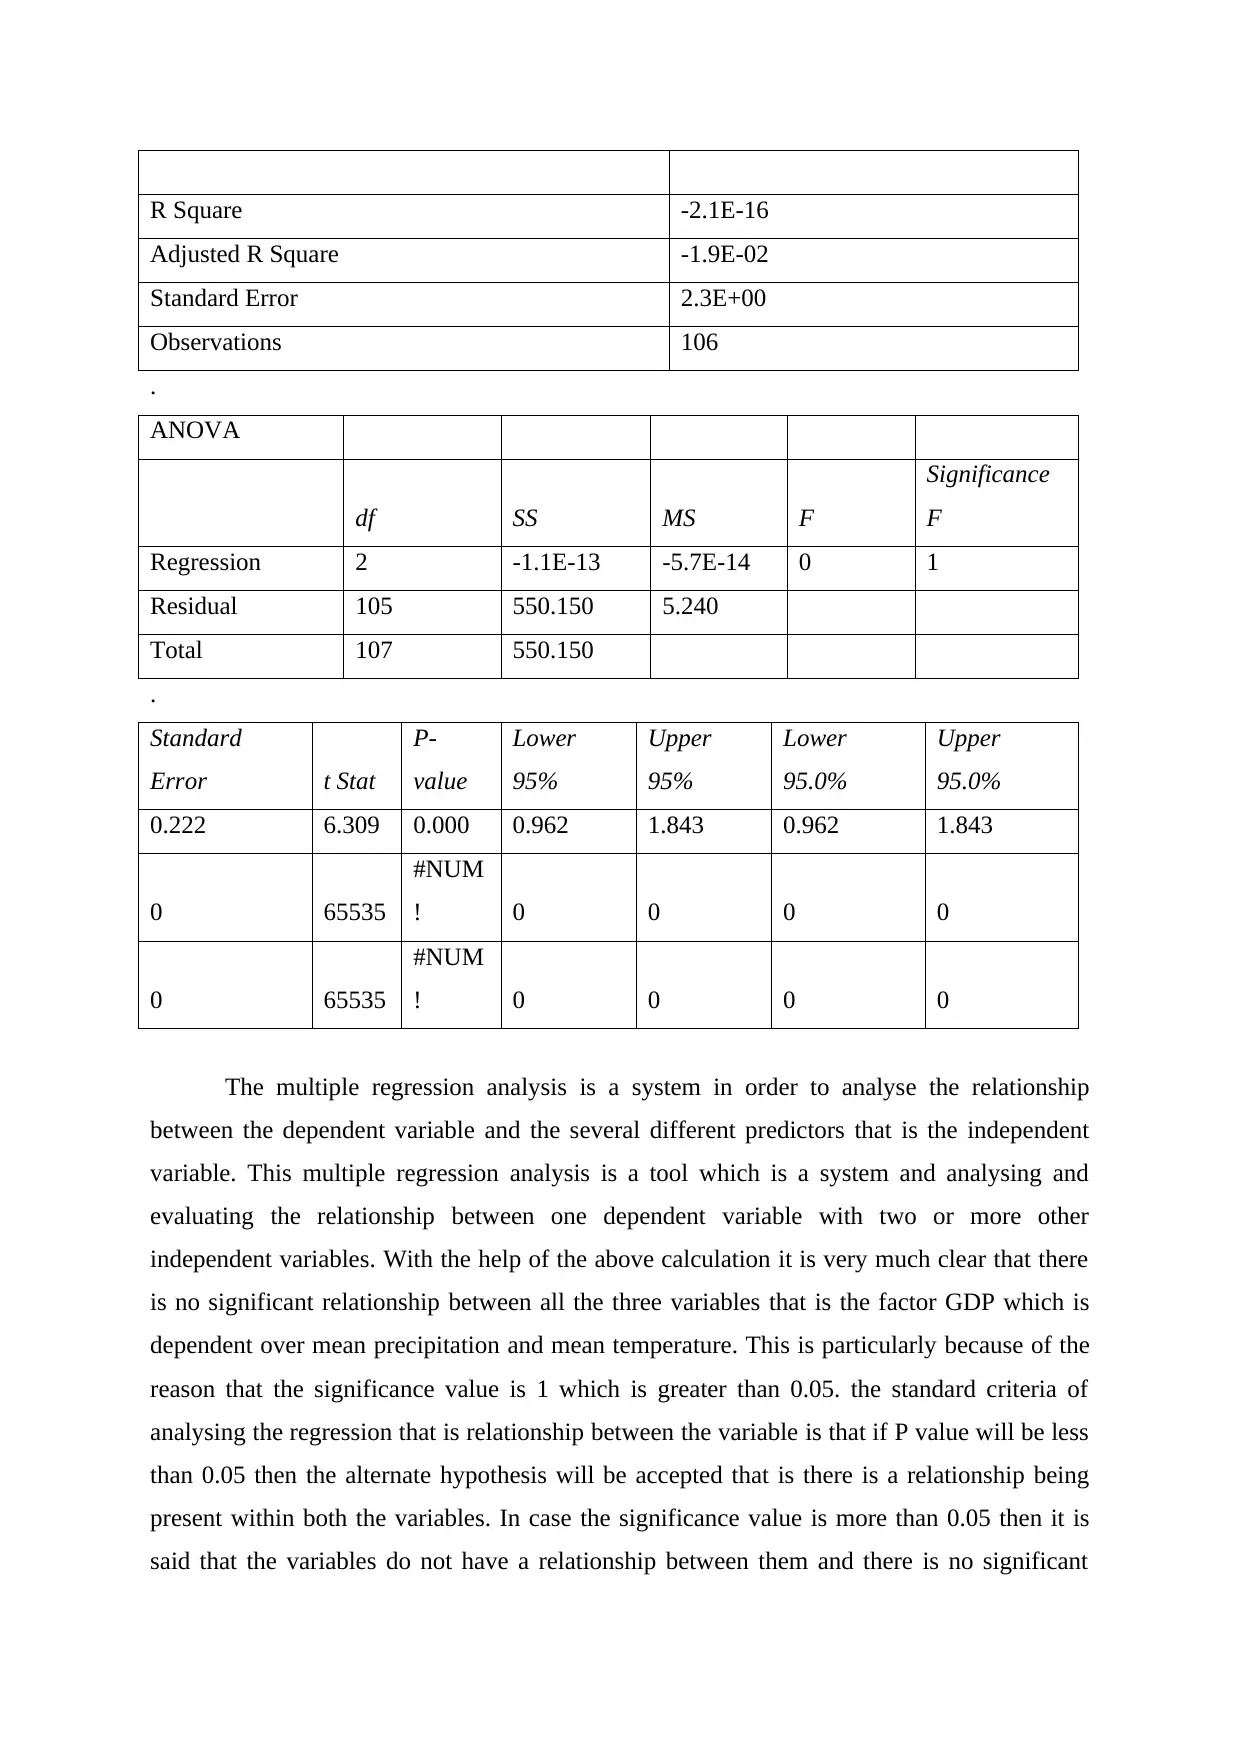
The multiple regression analysis is a system in order to analyse the relationship
between the dependent variable and the several different predictors that is the independent
variable. This multiple regression analysis is a tool which is a system and analysing and
evaluating the relationship between one dependent variable with two or more other
independent variables. With the help of the above calculation it is very much clear that there
is no significant relationship between all the three variables that is the factor GDP which is
dependent over mean precipitation and mean temperature. This is particularly because of the
reason that the significance value is 1 which is greater than 0.05. the standard criteria of
analysing the regression that is relationship between the variable is that if P value will be less
than 0.05 then the alternate hypothesis will be accepted that is there is a relationship being
present within both the variables. In case the significance value is more than 0.05 then it is
said that the variables do not have a relationship between them and there is no significant
Adjusted R Square -1.9E-02
Standard Error 2.3E+00
Observations 106
.
ANOVA
df SS MS F
Significance
F
Regression 2 -1.1E-13 -5.7E-14 0 1
Residual 105 550.150 5.240
Total 107 550.150
.
Standard
Error t Stat
P-
value
Lower
95%
Upper
95%
Lower
95.0%
Upper
95.0%
0.222 6.309 0.000 0.962 1.843 0.962 1.843
0 65535
#NUM
! 0 0 0 0
0 65535
#NUM
! 0 0 0 0
The multiple regression analysis is a system in order to analyse the relationship
between the dependent variable and the several different predictors that is the independent
variable. This multiple regression analysis is a tool which is a system and analysing and
evaluating the relationship between one dependent variable with two or more other
independent variables. With the help of the above calculation it is very much clear that there
is no significant relationship between all the three variables that is the factor GDP which is
dependent over mean precipitation and mean temperature. This is particularly because of the
reason that the significance value is 1 which is greater than 0.05. the standard criteria of
analysing the regression that is relationship between the variable is that if P value will be less
than 0.05 then the alternate hypothesis will be accepted that is there is a relationship being
present within both the variables. In case the significance value is more than 0.05 then it is
said that the variables do not have a relationship between them and there is no significant
relationship among them (Liu and et.al., 2019). Hence with the valuation of the above data it
is very much clear that the relationship between GDP and the mean precipitation and
temperature is not there because its significance value is one which is more than 0.05. Thus
statistically it can be stated that there is not a significant relationship between all these
variables and the null hypothesis is being accepted rejecting the alternate hypothesis.
6. Illustration of
A Hypothesis testing is required in regression analysis
The hypotheses is been defined as theme assumption which is being underline the
whole research. In simple words it can be stated that the hypotheses is the based on which the
whole of the research study is being established. The major aim of the research is to prove the
hypothesis and to identify the relationship between both the variables within the hypotheses.
Hence for the regression analysis the hypothesis testing is very essential and crucial. The
reason underlying this fact is that in case the hypothesis will not be there then the researcher
or the other person will not be having any base that how they have to conduct the research
(Black, 2019). For example in the present case the hypotheses was to analyse that whether
there is any relationship between the per capita growth of GDP with mean temperature and
the precipitation. Hence in case if they would not been these hypotheses present then how the
researcher would have conducted the study and how they would have analysed and prove the
aim of the study. Hence for effectively completing the research it is very essential that
hypotheses are being properly set so that there is proper guidance to the researcher and other
people associated with the research. In addition to this the hypotheses also provides an idea to
the reader of the research or the regression analysis that what was the aim and why the
research was being conducted. hence this is very helpful to The reader who do not have any
base of the study but then also they can understand that what the regression analysis
highlights in the present study.
B Two tailed hypothesis mechanism
Two tailed hypothesis is being defined as the method of testing the critical area of the
distribution of two sided distribution diagram. The major reason underlying the use of two
tailed hypothesis is to identify the critical area and to test that whether the sample is greater
than or less than the range of the values (Liu, 2017). In case the sample which is being tested
is falling within either of the critical area then the alternative hypothesis is being accepted.
Selection of the alternative hypothesis means that there is a significant relationship between
all the variables been tested. in contrast to this in case the sample does not fall within either
⊘ This is a preview!⊘
Do you want full access?
Subscribe today to unlock all pages.
Trusted by 1+ million students worldwide
1 out of 16
Related Documents


Your All-in-One AI-Powered Toolkit for Academic Success.
+13062052269
info@desklib.com
Available 24*7 on WhatsApp / Email
![[object Object]](/_next/static/media/star-bottom.7253800d.svg)
Unlock your academic potential
Copyright © 2020–2026 A2Z Services. All Rights Reserved. Developed and managed by ZUCOL.