Individual Market Analysis Report: Penske Automotive Group, BUS 101
VerifiedAdded on 2019/10/18
|11
|4009
|221
Report
AI Summary
This individual market analysis report examines Penske Automotive Group, focusing on its market position and strategies within the automotive industry. The report begins with an executive summary that provides an overview of the company and its financial performance, including its revenue and growth. A situation analysis is then presented, which includes a sector description and industry overview, highlighting the growth of the automotive industry and the performance of key competitors like CarMax and AutoNation. The report identifies and analyzes three key market segments: Baby Boomers, Gen X, and Millennials, detailing their demographic, psychographic, behavioral, and geographical characteristics and their impact on the used car market. The marketing mix is discussed, with a focus on product strategy, particularly the development of online car-buying experiences to cater to different consumer preferences. The report emphasizes the importance of secondary research and provides examples of how to conduct market analysis, along with a sample individual market analysis of virtual used car lots, including a table of contents, executive summary, situation analysis, segment information, marketing mix, product/service development, and references.
Individual Market Analysis (IMA)
This paper is to have your explore a market individually and not as a group. The preliminary
analysis is general market and segment information. Please do a research from A&M library or
google.com to write a paper about Identify general market and segment information on the.
However, the information required is below.
Projects are chosen just prior to class.
Choose a project and a city.
Steps to accomplish this are below.
This is an individual student project. Paper (as a Word attachment) is to be submitted directly
to the DROPBOX.For this assignment, late projects will not be acceptable. The maximum
pages for the paper should be no more than 4 content pages, using Times New Roman, 12 point
font, and APA (single spaced is required). (Please note quantity NEVER equals quality). In
addition, you should cite at least 6 credible sources (i.e., NON peer review journal articles are
preferred, but journal articles may be appropriate as well) in the paper (no more than 5 websites
may be used). You will need to include a title page with your name, table of contents, 4 pages of
content, a reference list, table, figure, and an appendix (if necessary).
PLEASE DO NOT SUBMIT AN ITEM IN THE WRONG DROPBOX.
Individual Analysis Rubric Items
Executive Summary
Details from approximately each para/section 10-20% of document
Situation Analysis
Brief Company overview(estimated (units or sales), growth of last (3-5 yrs), company trends,
details about the company, history, competitive advantage, etc.
Industry overview & sector description; industry trends, industry trends, size of market (units
or sales), growth of last (3-5 yrs), key competitors, etc.
Paraphrase This Document
Need a fresh take? Get an instant paraphrase of this document with our AI Paraphraser
Segment Information
Identify at least 3 segments
Segment 1: Identify all of these: demographic characteristics of the segment, psychographic
characteristics of the segment, behaviors of the segment, geographical characteristics of the
segment
Segment 2: Identify all of these: demographic characteristics of the segment, psychographic
characteristics of the segment, behaviors of the segment, geographical characteristics of the
segment
Segment 3: Identify all of these: demographic characteristics of the segment, psychographic
characteristics of the segment, behaviors of the segment, geographical characteristics of the
segment
Marketing Mix (generally all 4Ps, but I request only one for this assignment) (you get to choose
the appropriate marketing mix item (Product, Price, Promotion, or Place)
Product/Service Development and Strategy
Please describe the top one or two examples of the best products/services for your
Analysis
Product and Competition Table required
Levels for the rubric levels
NI – Needs Improvement: Not consistent with text and lectures
P – Proficient: Consistent with text and lectures but could be improved
E – Exemplary: Exceeds information covered in text and lectures
ACTUAL RUBRIC THAT WILL BE RETURNED TO YOU WHEN YOUR
ASSIGNMENT IS GRADED.
-rX or r10, “r” indicates that I’m returning the document and that
x or 10 is the number of points received.
Also, please see the rubric in the syllabus for details on how
points are allocated.
NI – Needs Improvement: Not consistent with text and lectures
P – Proficient: Consistent with text and lectures but could be
improved
E – Exemplary: Exceeds information covered in text and lectures
Individual Analysis Rubric Items Pts
Executive Summary (6pts)
Brief Company overview 2
Key details from approximately each para/section 10-20% of
document 4
Situation Analysis (6pts)
Sector description 2
Industry overview: Size of market (units or sales), growth of last
(3-5 yrs), industry trends, key competitors, etc. 4
Segment Information (6pts)
Segment 1: Identify all of these: demographic characteristics of
the segment, psychographic characteristics of the segment,
behaviors of the segment, geographical characteristics of the
segment
2
Segment 2: Identify all of these: demographic characteristics of
the segment, psychographic characteristics of the segment,
behaviors of the segment, geographical characteristics of the
segment
2
Segment 3: Identify all of these: demographic characteristics of
the segment, psychographic characteristics of the segment,
behaviors of the segment, geographical characteristics of the
segment
2
Marketing Mix
Product strategy (7pts)
Please describe the top one or two examples of the best
products/services for your analysis 3
Product and Competition Table required 4
Total 25
Conducting a Market Analysis
⊘ This is a preview!⊘
Do you want full access?
Subscribe today to unlock all pages.
Trusted by 1+ million students worldwide
Overview
Whether you are starting a new business or launching a new product, conducting a marketing
analysis is the first step in determining if there is a need or audience for your idea. Knowing the
market's needs and how it is currently serviced provides you with key information that is
essential in developing your product/service and marketing plan. Too often, businesses spend
thousands of dollars launching a "new" idea with a limited market because of competition. The
owner is forced to reevaluate his strategy and determine if there is room for another player.
Although the quality of the product is critical, your development of the best product on the
market will not necessarily correlate with the most sales. Up to 50 percent of a product's price
can be for marketing. The company who wins the marketing game generally will capture the
larger share of the market.
Primary And Secondary Market Research
PLEASE NOTE, I EXPECT THAT ALMOST EVERY SECTION AND KEY PIECES OF
INFORMATION WILL BE FROM SECONDARY SOURCES
If you don't have all the answers to the questions listed in the Problem Definition section, you
can find the answers by either conducting primary research or accessing secondary research.
Primary research is research that is proactively created for a specific purpose. Primary research
may include focus groups, qualitative surveys and phone interviews. This is information you
collect yourself.
In contrast, secondary research is research that has already been conducted for other purposes.
From it valuable information can be gleaned. Secondary research can be found in libraries,
online, through periodicals, books, etc. The easiest and most efficient way of accessing this type
of data is on the Internet.
Library information can also be found on the Internet. Access your favorite search engine and
type in the following:
For businesses
Type in the trade association name followed by either .com or .org
Paraphrase This Document
Need a fresh take? Get an instant paraphrase of this document with our AI Paraphraser
For universities
Type in the name of the institution followed by .edu
For government
Type in the name of the department followed by .gov
If you want to conduct a detailed industry search, access altavista.com and type in "industry
research reports" and you'll receive a variety of sites. The more specific you are, the more
defined your search will be.
The Internet is an excellent tool to conduct a competitive analysis. Simply type in the company
name followed by .com. If this doesn't work, try accessing the online yellow pages and type in
your competitor's company name. If they have a Web site, you'll have an insider's view of their
services and various other reports.
Demographic and competitive reports can be attained for a fee at Dun and Bradstreet's Web site,
dnb.com.
Industry newsletters can be emailed to you when new data is reported. By searching your
industry on the Internet, you will uncover lots of potentially valuable marketing analysis
information.
Other widely used standard research sources include:
Trade and Industry Sources such as Gale Research publishes the Small Business Source
Book, which has a strong focus on retail trade. It lists industry associations, trade shows
and conventions, consultants and venture capital firms.
Forrester Research and Gartner Research publish detailed reports and studies focusing on
the information technology industry.
Federal level and state governments publish reports on specific industries, markets and
products. To receive a list of publications call the U.S. Printing Office in Washington,
D.C. (202) 783-3238
The U.S. Department of Commerce publishes the U.S. Industrial Outlook each January. It
provides a general economic outlook by forecasting growth rates for the coming year and
reporting on the production of the last year.
The U.S. Census Bureau publishes more than 100 current industrial reports on 5,000
manufactured products. Consumer Information Reports, better known as CIRs, provide
information on production, shipping, inventories, consumption and the number of firms
manufacturing each product.
Marketing Analysis - What Is It? Why Should You Do It?
Although the terms "marketing" and "marketing analysis" can both be described as games of
information, they are not to be confused. Marketing encompasses all of the activities that go into
promoting a product or service. A marketing analysis is the actual assessment of the target
population, competition and needs for marketing that product or service.
The marketing analysis process can be broken down into six steps:
1. Defining the problem (understanding the product or service and why individuals buy it)
2. Analysis of the situation
3. Obtaining data that is specific to the problem
4. Analysis and interpreting the data
So, why should you embark on the market analysis process? The primary reasons are:
To determine if there is a market for your products or services
To establish the need for developing a marketing plan
To ascertain market information that will assist in the sale of your product or service
Before embarking on the complete process, THINK ABOUT the following Market Analysis
Questionnaire.
Market Analysis Questionnaire
To begin the market analysis process, you should think about the answers to the following
questions
What defined market am I trying to reach?
1. What specific companies are servicing this market?
a. Are they successful?
b. Are there other companies servicing this market with a similar product?
⊘ This is a preview!⊘
Do you want full access?
Subscribe today to unlock all pages.
Trusted by 1+ million students worldwide
c. Are they successful?
d. What is their market share?
2. Is the market saturated or wide open? If so, why?
3. What is the size of the market?
a. Is it a growing market?
b. Is the industry stable, volatile, growing or trendy?
4. How can I reach this market?
a. How do my competitors reach the market?
5. What are the business models of my competitors?
6. What do customers expect from this type of product or service?
7. What core competencies must the product or service have?
8. What are customers willing to pay for this type of product or service?
9. What is my competitive advantage?
SAMPLE INDIVIDUAL MARKET ANALYSIS
Virtual Used Car Lots
Table of Contents
Executive
Summary............................................................................................................................ 2
Situation
Analysis............................................................................................................................... 2
Segment Information.........................................................................................................................
3
Marketing Mix...................................................................................................................................
4
Product/Service Development and
Strategy....................................................................................... 4
References…..
………………………………………………………………………………………………………
………………………………….5
Paraphrase This Document
Need a fresh take? Get an instant paraphrase of this document with our AI Paraphraser
Executive Summary
Penske Automotive Group (NYSE:PAG) is a publicly traded automotive dealership
which sells new and used automobiles at over 150 physical locations and online through
PenskeCars.com. The company was founded in 1990 as United Auto Group, was purchased in
1999 by Roger Penske, and the name was changed to Penske Automotive Group in 2007. The
second largest USA-based dealership group has its headquarters in Bloomfield Hills, MI – 25
miles north of Detroit (Penske Automotive Group, 2017).
According to Fortune’s 500 List, PAG’s revenues are $20,143 million – a 4% increase
over previous years (Fortune 500 List - Penske Automotive Group, 2017). In March 2015,
Penske began piloting its Preferred Purchase program, which allows users to complete the
majority of the car buying experience from their mobile device or the comfort of their own
homes (LaReau, 2015). Users can value their trade-in, browse inventory, get pre-qualified for a
loan, view financing information, and chat or call a representative to have questions answered
(Preferred Purchase, 2017).
Three of the market segments examined for used cars are Baby Boomers, Gen X, and
Gen Y/Millennials. All three segments have differing buying habits: Baby Boomers and
Millennials tend to purchase small SUVs, Gen X consumers tend to purchase family-friendly
vehicles, and Millennials purchase cars they can customize to reflect their exact specifications
(Archer, 2011). Baby Boomers tend to spend less on used vehicles, while Gen X spends the most
(Bershidsky, 2016). Product strategy is focused on making the car buying process easier and
more convenient for online shoppers. This strategy, while it addresses all noted segments, is
particularly geared toward Millennials, who are very meticulous in doing thorough research prior
to purchasing a vehicle (Harvey, 2016).
Situation Analysis
Sector Description and Industry Overview
According to Forbes, US new and used car sales have increased about 6% for six
consecutive years. Since 2009, the auto industry has grown approximately 68%. Penske
Automotive, CarMax, and AutoNation reported 8%, 3% and 4% growths respectively in the first
quarter of 2016 (GuruFocus, 2016). 38.5 million vehicles were sold in 2016, and the average
used car price was $19,189.00. High used car prices are being driven by the number of off-lease
vehicles on the market and the declining availability of older vehicles (greater than 5 years)
(Used Vehicle Market Report, 2017). Higher value vehicles like pickup trucks and SUVs are
gaining popularity with consumers due, in part, to low gas prices and lower interest levels
available for vehicle financing. Additionally, sales of certified pre-owned vehicles which average
$1,500 higher sale price than other used vehicles, is contributing to the high average cost for a
used vehicle (Drury, 2016).
According to J.D. Power Valuation Services, 2016 was the first time since 2008 that used
car prices decreased, and they anticipate 14 million used vehicles 5 years or less will be on the
market in 2017. Despite a high volume of used vehicles on the market, there are concerns that
increased incentives for new cars could lead to a decline in purchases of used vehicles (Zoia,
2017). Though the general market trend does not indicate a significant decrease in used car
pricing, experts indicate this is likely due to the high volume of off-lease trucks and SUVs on the
market – high-priced vehicles that can skew the data (Irwin, 2017). It is anticipated that used car
pricing will fall in 2017, and thus far, the data supports that projection. As of July 17, 2017,
compact crossover SUV pricing is down .48%, mid-size crossover SUV pricing is down .21%,
and mid-size car pricing is down .45% for model years 2009-2015 in comparison to pricing on
July 7, 2017 (Black Book Market Insights, 2017).
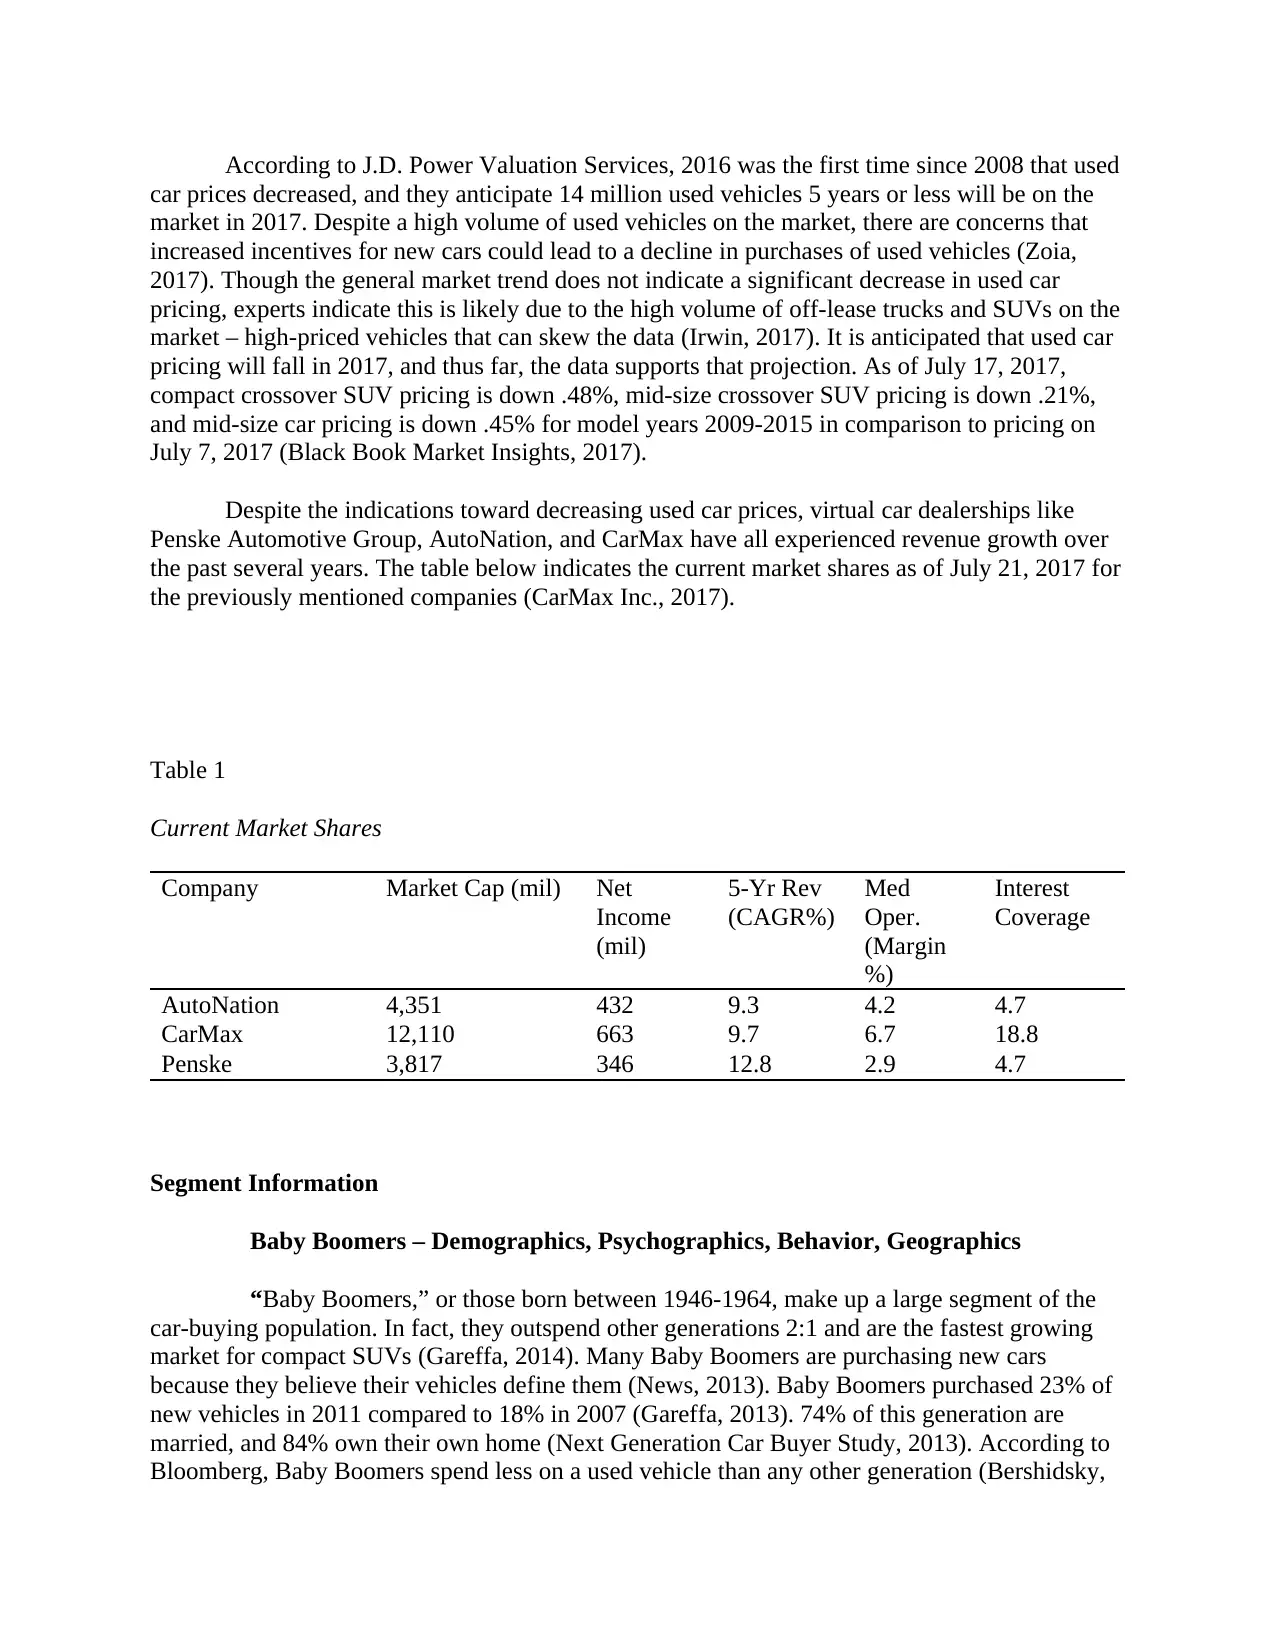
Despite the indications toward decreasing used car prices, virtual car dealerships like
Penske Automotive Group, AutoNation, and CarMax have all experienced revenue growth over
the past several years. The table below indicates the current market shares as of July 21, 2017 for
the previously mentioned companies (CarMax Inc., 2017).
Table 1
Current Market Shares
Company Market Cap (mil) Net
Income
(mil)
5-Yr Rev
(CAGR%)
Med
Oper.
(Margin
%)
Interest
Coverage
AutoNation 4,351 432 9.3 4.2 4.7
CarMax 12,110 663 9.7 6.7 18.8
Penske 3,817 346 12.8 2.9 4.7
Segment Information
Baby Boomers – Demographics, Psychographics, Behavior, Geographics
“Baby Boomers,” or those born between 1946-1964, make up a large segment of the
car-buying population. In fact, they outspend other generations 2:1 and are the fastest growing
market for compact SUVs (Gareffa, 2014). Many Baby Boomers are purchasing new cars
because they believe their vehicles define them (News, 2013). Baby Boomers purchased 23% of
new vehicles in 2011 compared to 18% in 2007 (Gareffa, 2013). 74% of this generation are
married, and 84% own their own home (Next Generation Car Buyer Study, 2013). According to
Bloomberg, Baby Boomers spend less on a used vehicle than any other generation (Bershidsky,
car prices decreased, and they anticipate 14 million used vehicles 5 years or less will be on the
market in 2017. Despite a high volume of used vehicles on the market, there are concerns that
increased incentives for new cars could lead to a decline in purchases of used vehicles (Zoia,
2017). Though the general market trend does not indicate a significant decrease in used car
pricing, experts indicate this is likely due to the high volume of off-lease trucks and SUVs on the
market – high-priced vehicles that can skew the data (Irwin, 2017). It is anticipated that used car
pricing will fall in 2017, and thus far, the data supports that projection. As of July 17, 2017,
compact crossover SUV pricing is down .48%, mid-size crossover SUV pricing is down .21%,
and mid-size car pricing is down .45% for model years 2009-2015 in comparison to pricing on
July 7, 2017 (Black Book Market Insights, 2017).
Despite the indications toward decreasing used car prices, virtual car dealerships like
Penske Automotive Group, AutoNation, and CarMax have all experienced revenue growth over
the past several years. The table below indicates the current market shares as of July 21, 2017 for
the previously mentioned companies (CarMax Inc., 2017).
Table 1
Current Market Shares
Company Market Cap (mil) Net
Income
(mil)
5-Yr Rev
(CAGR%)
Med
Oper.
(Margin
%)
Interest
Coverage
AutoNation 4,351 432 9.3 4.2 4.7
CarMax 12,110 663 9.7 6.7 18.8
Penske 3,817 346 12.8 2.9 4.7
Segment Information
Baby Boomers – Demographics, Psychographics, Behavior, Geographics
“Baby Boomers,” or those born between 1946-1964, make up a large segment of the
car-buying population. In fact, they outspend other generations 2:1 and are the fastest growing
market for compact SUVs (Gareffa, 2014). Many Baby Boomers are purchasing new cars
because they believe their vehicles define them (News, 2013). Baby Boomers purchased 23% of
new vehicles in 2011 compared to 18% in 2007 (Gareffa, 2013). 74% of this generation are
married, and 84% own their own home (Next Generation Car Buyer Study, 2013). According to
Bloomberg, Baby Boomers spend less on a used vehicle than any other generation (Bershidsky,
⊘ This is a preview!⊘
Do you want full access?
Subscribe today to unlock all pages.
Trusted by 1+ million students worldwide
2016). This is likely due to the fact that the majority of this generation are purchasing new
vehicles, rather than used. Increasingly, Baby Boomers are moving to urban areas, and a national
survey by AutoPacific indicates that 74% of people who purchase new vehicles live in urban or
suburban areas (Fetto, 2000).
Gen X - Demographics, Psychographics, Behavior, Geographics
Generation X (those born between 1965-1984) is typically over looked by auto
marketers, simply because there are less Gen Xers than there are Baby Boomers or Millennials
(Buss, 2016). Gen X consumers care less about purchasing a new vehicle than Millennials, and
also plan to keep their vehicles longer (10+ years) than Millennials (Gazdik, 2017). According to
a study by TrueCar, Gen X consumers prefer vehicles that are family-friendly, practical, and
spacious. This is likely due to the age-range, as many have children still living with them
(Archer, 2011). Gen Xers tend to spend more on used cars than Baby Boomers or Millennials
(Bershidsky, 2016).
Gen Y/Millennials - Demographics, Psychographics, Behavior, Geographics
Millennials are those born between 1975-1995. According to recent studies, 72-80% of
millennials purchase a vehicle because they need one, while the remainder purchase a vehicle
simply because they want one (Next Generation Car Buyer Study, 2013). Older millennials (25-
32) are well-educated, but are burdened by student debt. Younger millennials (16-24) are
struggling with a high unemployment rate and lower income (Montoya, 2015). Many millennials
are making the decision to purchase a used vehicle that is still under warranty, rather than
spending more money for a brand-new vehicle (Kurylko, 2017).
A contributing factor to a lower percentage of new or used car purchases by millennials is
ride-sharing companies like Uber or Lyft (Plache, 2012). Additionally, most millennials prefer to
think of automobiles as an on-demand service, and prefer to not pay the fixed price of purchasing
a new or used vehicle. The 2009 recession decreased spending ability, but the recent economic
upswing has allowed millennials to begin purchasing vehicles in large numbers (Demographic
Shifts, 2017/). Millennials buying habits indicate when purchasing a vehicle, they prefer to
purchase used, family-friendly vehicles that also have technological add-ons like GPS,
Bluetooth, etc… (Korosec, 2015), and they prefer to do a lot of research prior to purchasing
(Harvey, 2016).
Marketing Mix
Product Strategy
Penske Automotive Group has over 150 physical locations at which they sell new and
used cars. However, they began piloting a virtual sales program called “Preferred Purchase” in
2015 in 5 of their Florida stores and 6 D.C. stores (LaReau, 2017). Preferred Purchase was
expanded to the entirety of Penske Automotive Group in May 2016 (LaReau, 2016.). Penske’s
key strategy with the Preferred Purchase program is to allow the consumer to do the majority of
the buying process virtually – from their mobile device or their home computer. Consumers still
Paraphrase This Document
Need a fresh take? Get an instant paraphrase of this document with our AI Paraphraser
need to come to a store in-person to verify the value of their trade-in and sign documents
(Preferred Purchase, 2017). The focus is to make the car-buying process as seamless and
convenient as possible for consumers who are increasingly expecting online purchase options.
References
Archer, J. (2011, July). Baby Boomers Buy Their Dream Cars. Retrieved July 22, 2017, from
https://www.autotrader.com/car-news/baby-boomers-buy-their-dream-cars-113023
Bershidsky, L. (2016, January 04). Millennials Are Buying Cars After All. Retrieved July 22,
2017, from https://www.bloomberg.com/view/articles/2016-01-04/millennials-are-
buying-cars-after-all
Black Book Market Insights. (2017, July 17). Retrieved July 22, 2017, from
http://www.blackbook.com/wp-content/uploads/2017/07/MI_7_17_17.pdf
Buss, D. (2016, August 12). Ever Hear About Generation X Buying Cars? Turns Out They Like
Ford Explorer Sport. Retrieved July 22, 2017, from
https://www.forbes.com/sites/dalebuss/2016/08/11/ever-hear-about-generation-x-buying-
cars-turns-out-they-like-ford-explorer-sport/#3f15252b3613
CarMax Inc. (2017, July 21). Retrieved July 22, 2017, from
http://financials.morningstar.com/competitors/industry-peer.action?t=KMX
Demographic Shifts: Shaping the Future of Car Ownership. (2017, February 21). Retrieved July
22, 2017, from http://knowledge.wharton.upenn.edu/article/demographic-shifts-shaping-
future-car-ownership
Drury, I. (2016, April 1). Used Vehicle Market Report - Special NADA Edition. Retrieved July
22, 2017, from https://www.edmunds.com/industry-center/analysis/used-vehicle-market-
report-special-nada-edition.html
Fetto., J. (2000, January 01). Something Old, Something New: Where new and used car buyers
call home. Retrieved July 22, 2017, from http://adage.com/article/american-
demographics/car-buyers-call-home/42124/
Fortune 500 List - Penske Automotive Group. (n.d.). Retrieved July 22, 2017, from
http://fortune.com/fortune500/penske-automotive-group/?iid=sr-link1
Gareffa, P. (2013, May 31). Baby-Boom Generation More Relevant to the Auto Industry Than
Ever. Retrieved July 22, 2017, from https://www.edmunds.com/car-news/baby-boom-
generation-more-relevant-to-the-auto-industry-than-ever.html
1 out of 11
Related Documents


Your All-in-One AI-Powered Toolkit for Academic Success.
+13062052269
info@desklib.com
Available 24*7 on WhatsApp / Email
![[object Object]](/_next/static/media/star-bottom.7253800d.svg)
Unlock your academic potential
Copyright © 2020–2026 A2Z Services. All Rights Reserved. Developed and managed by ZUCOL.