Project Management Individual Assessment: DAM798, Level 7, Semester 1
VerifiedAdded on 2022/09/26
|18
|3026
|16
Project
AI Summary
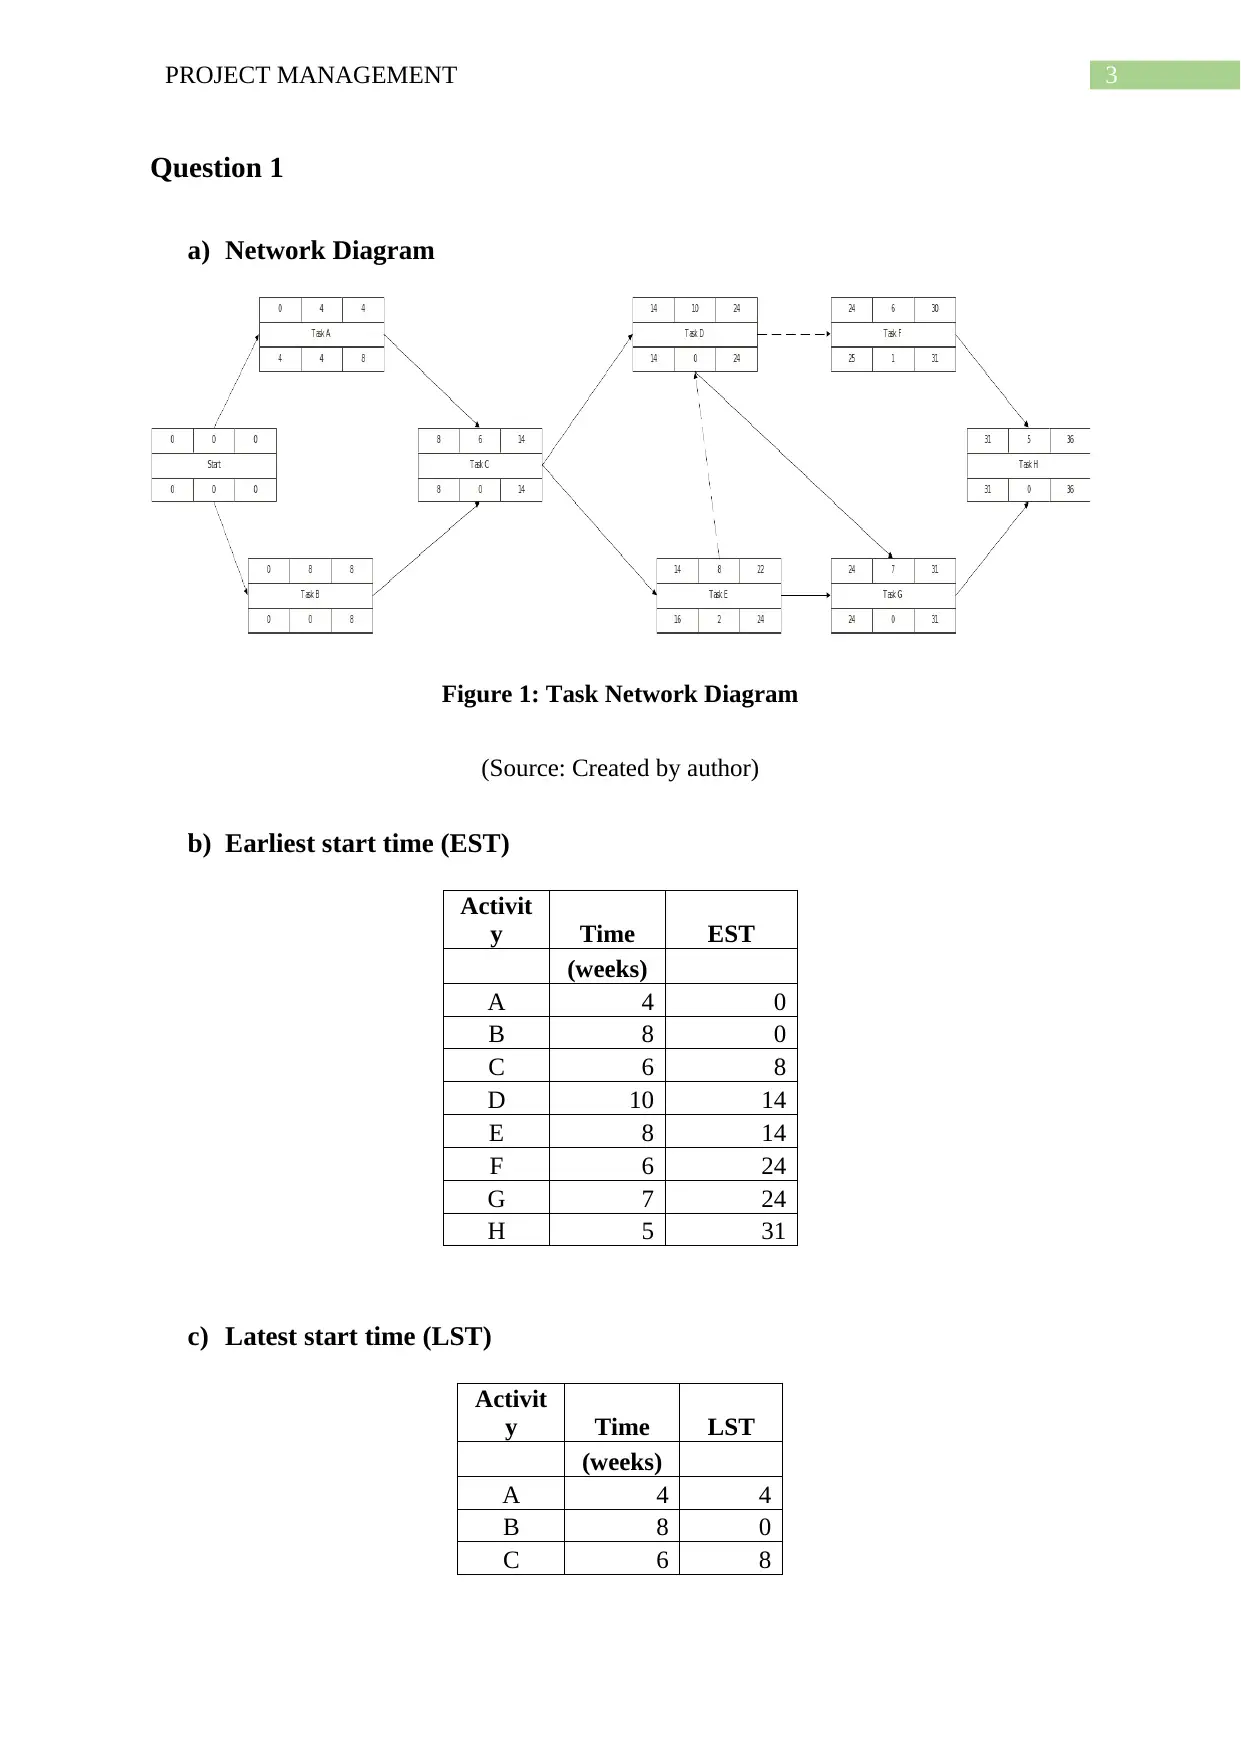
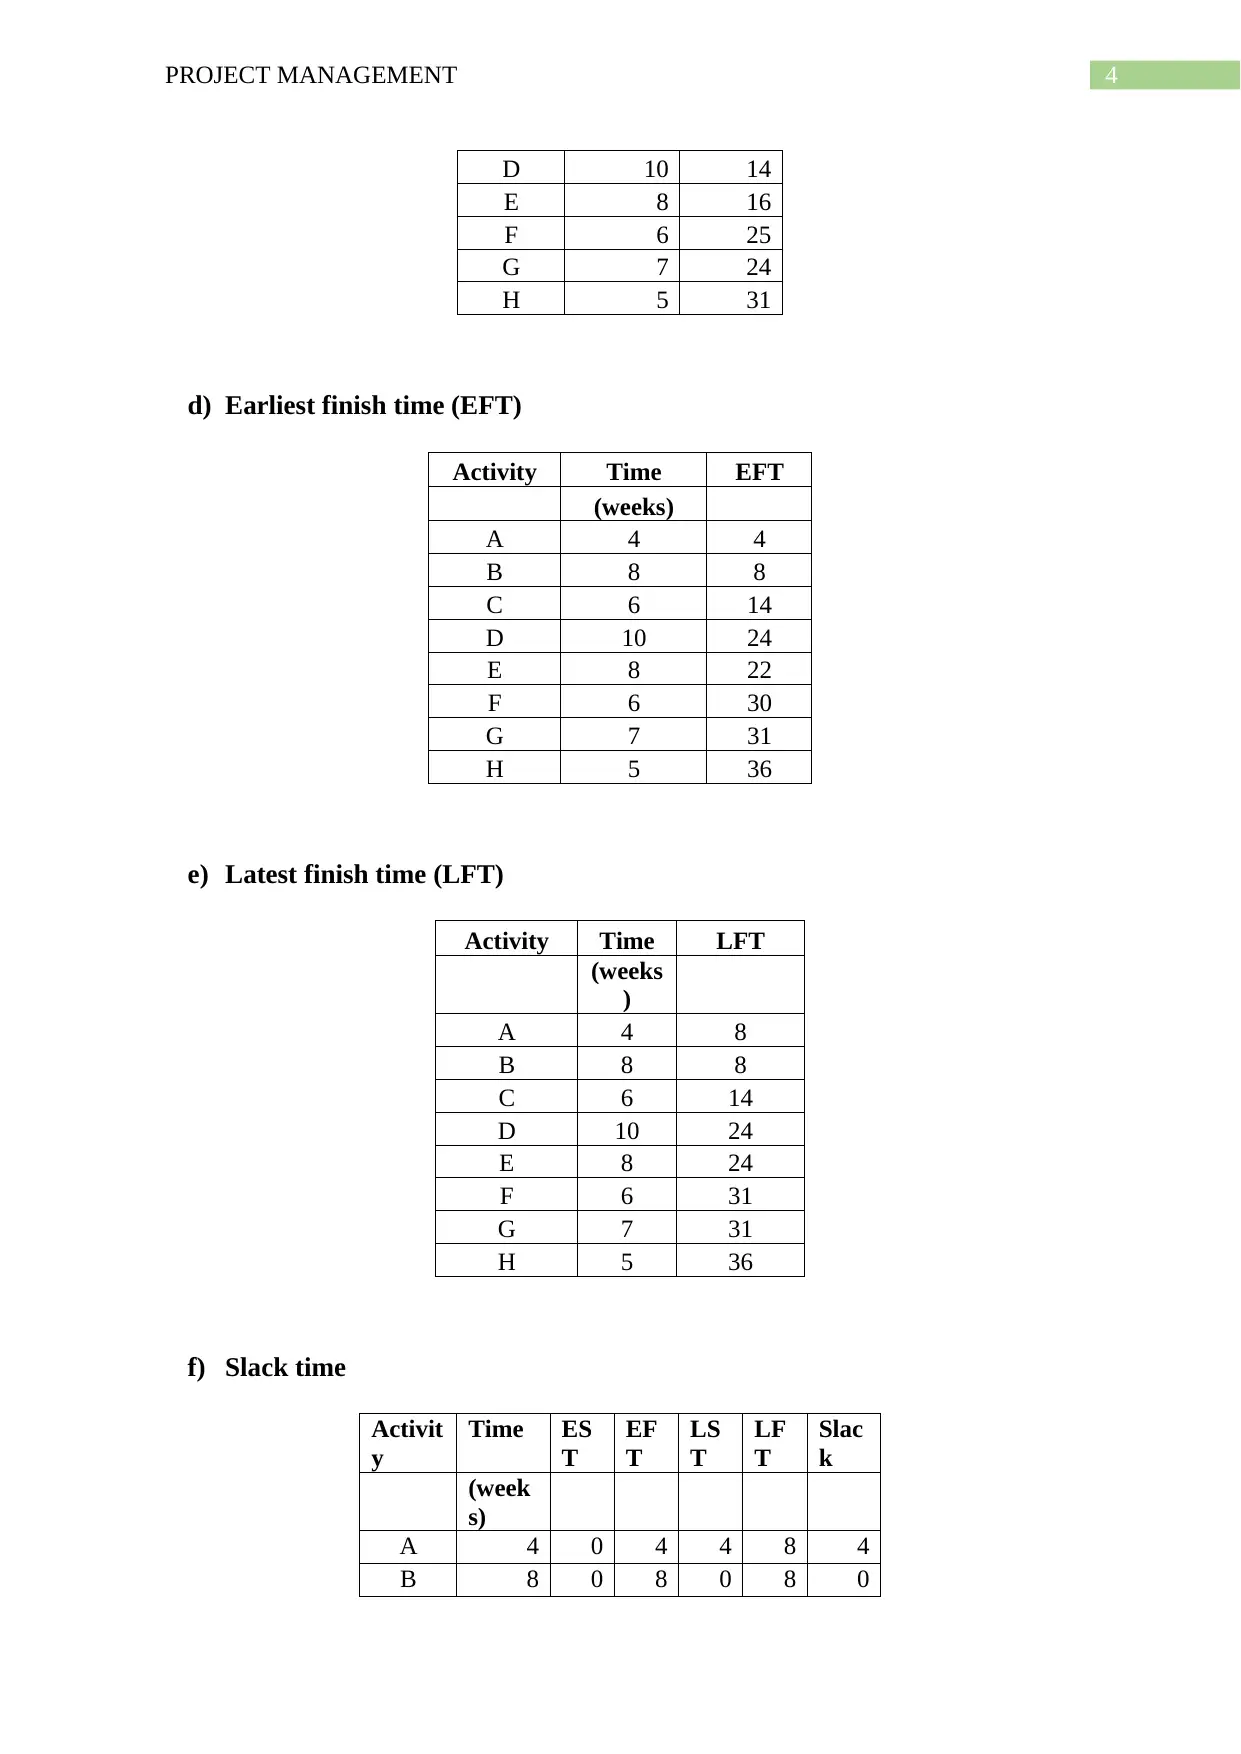
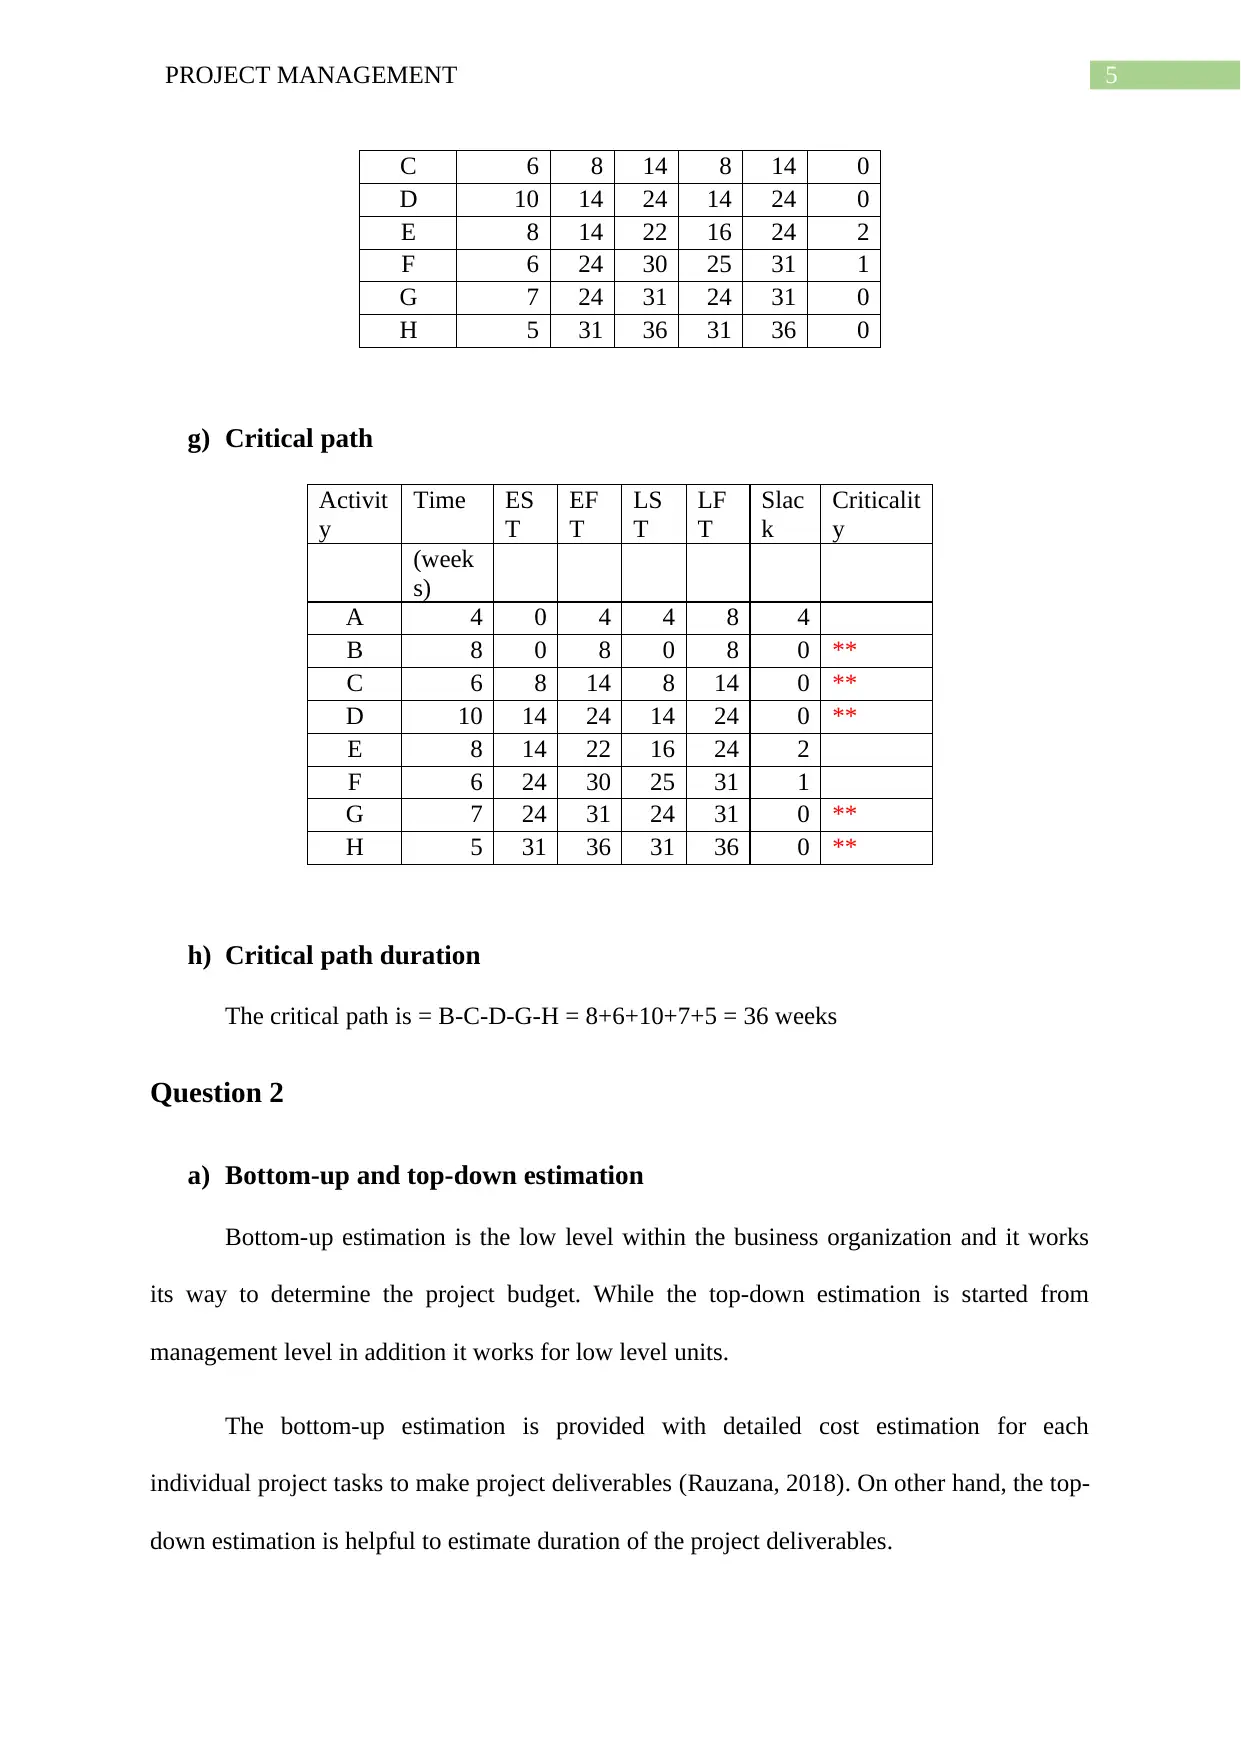
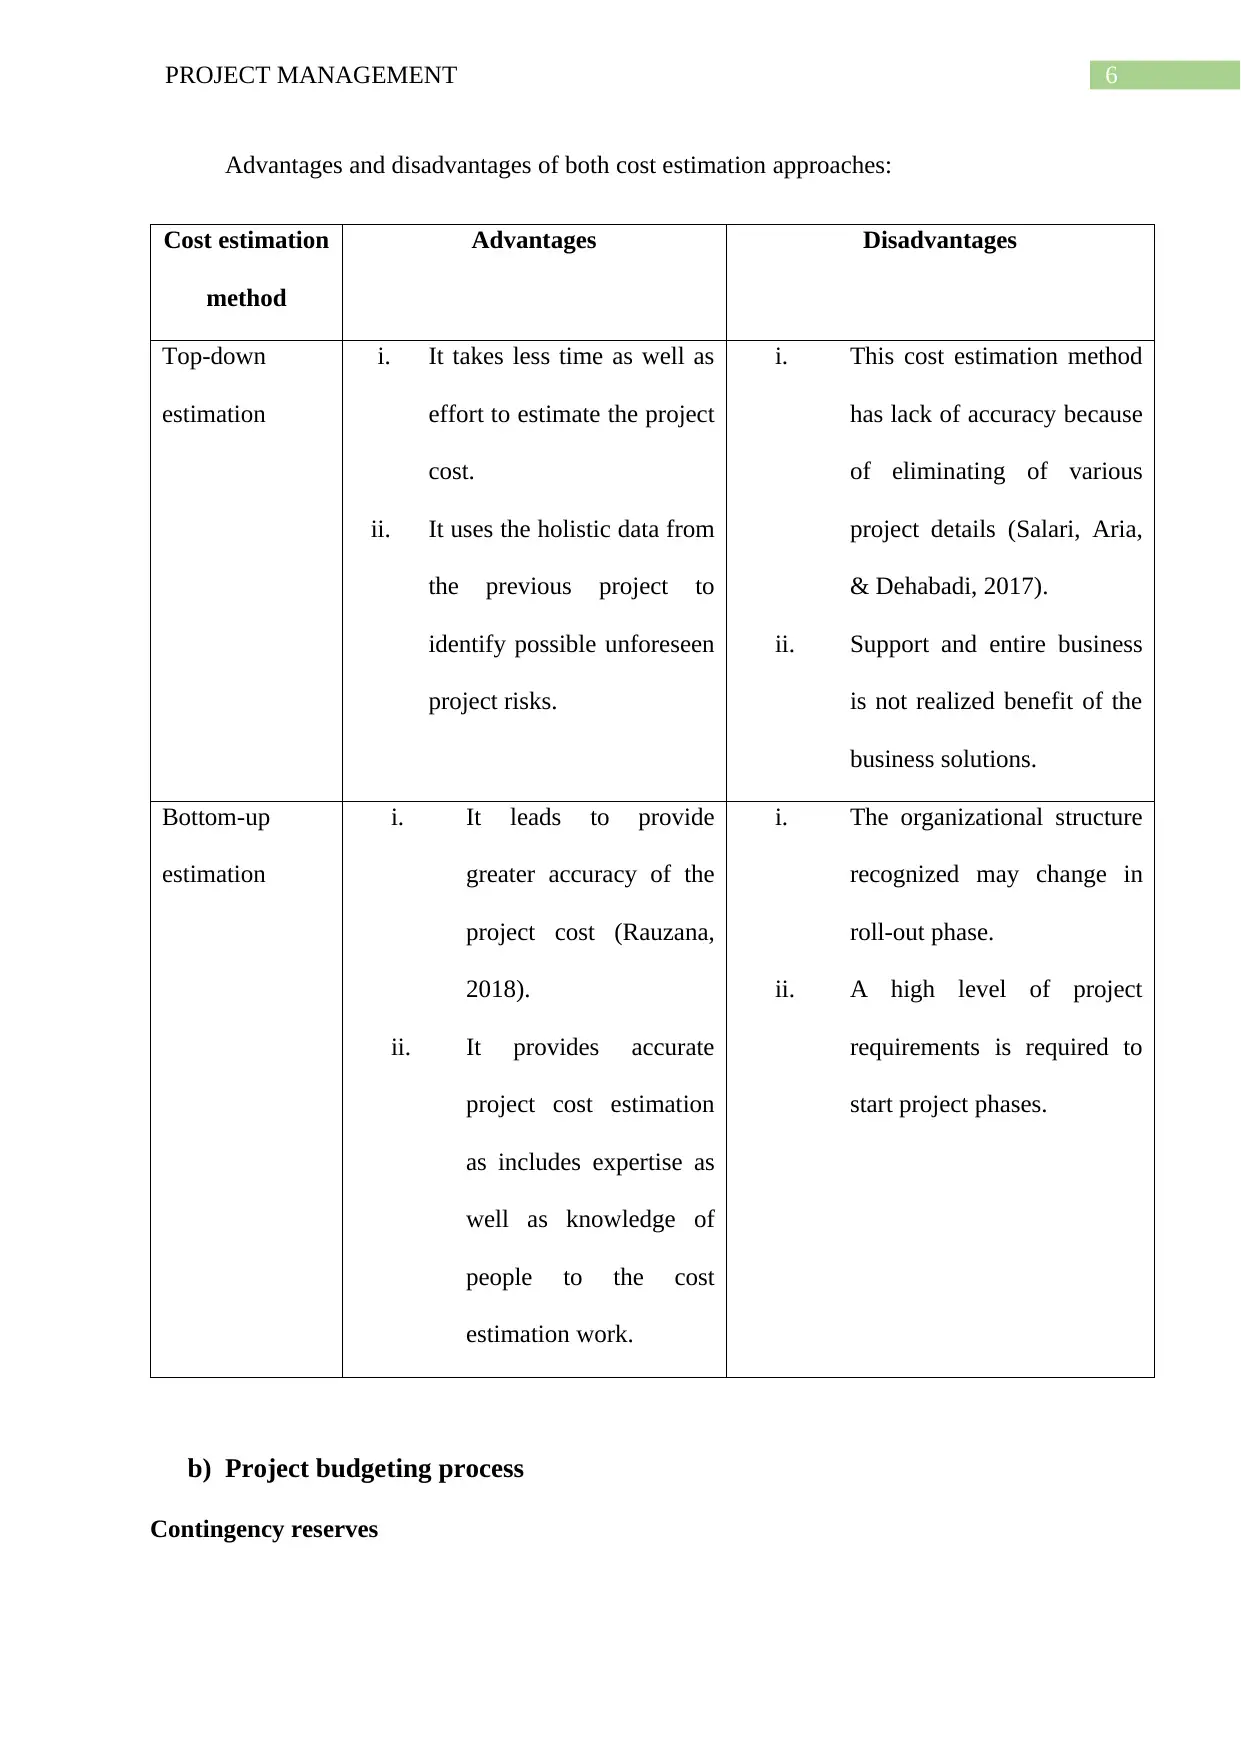
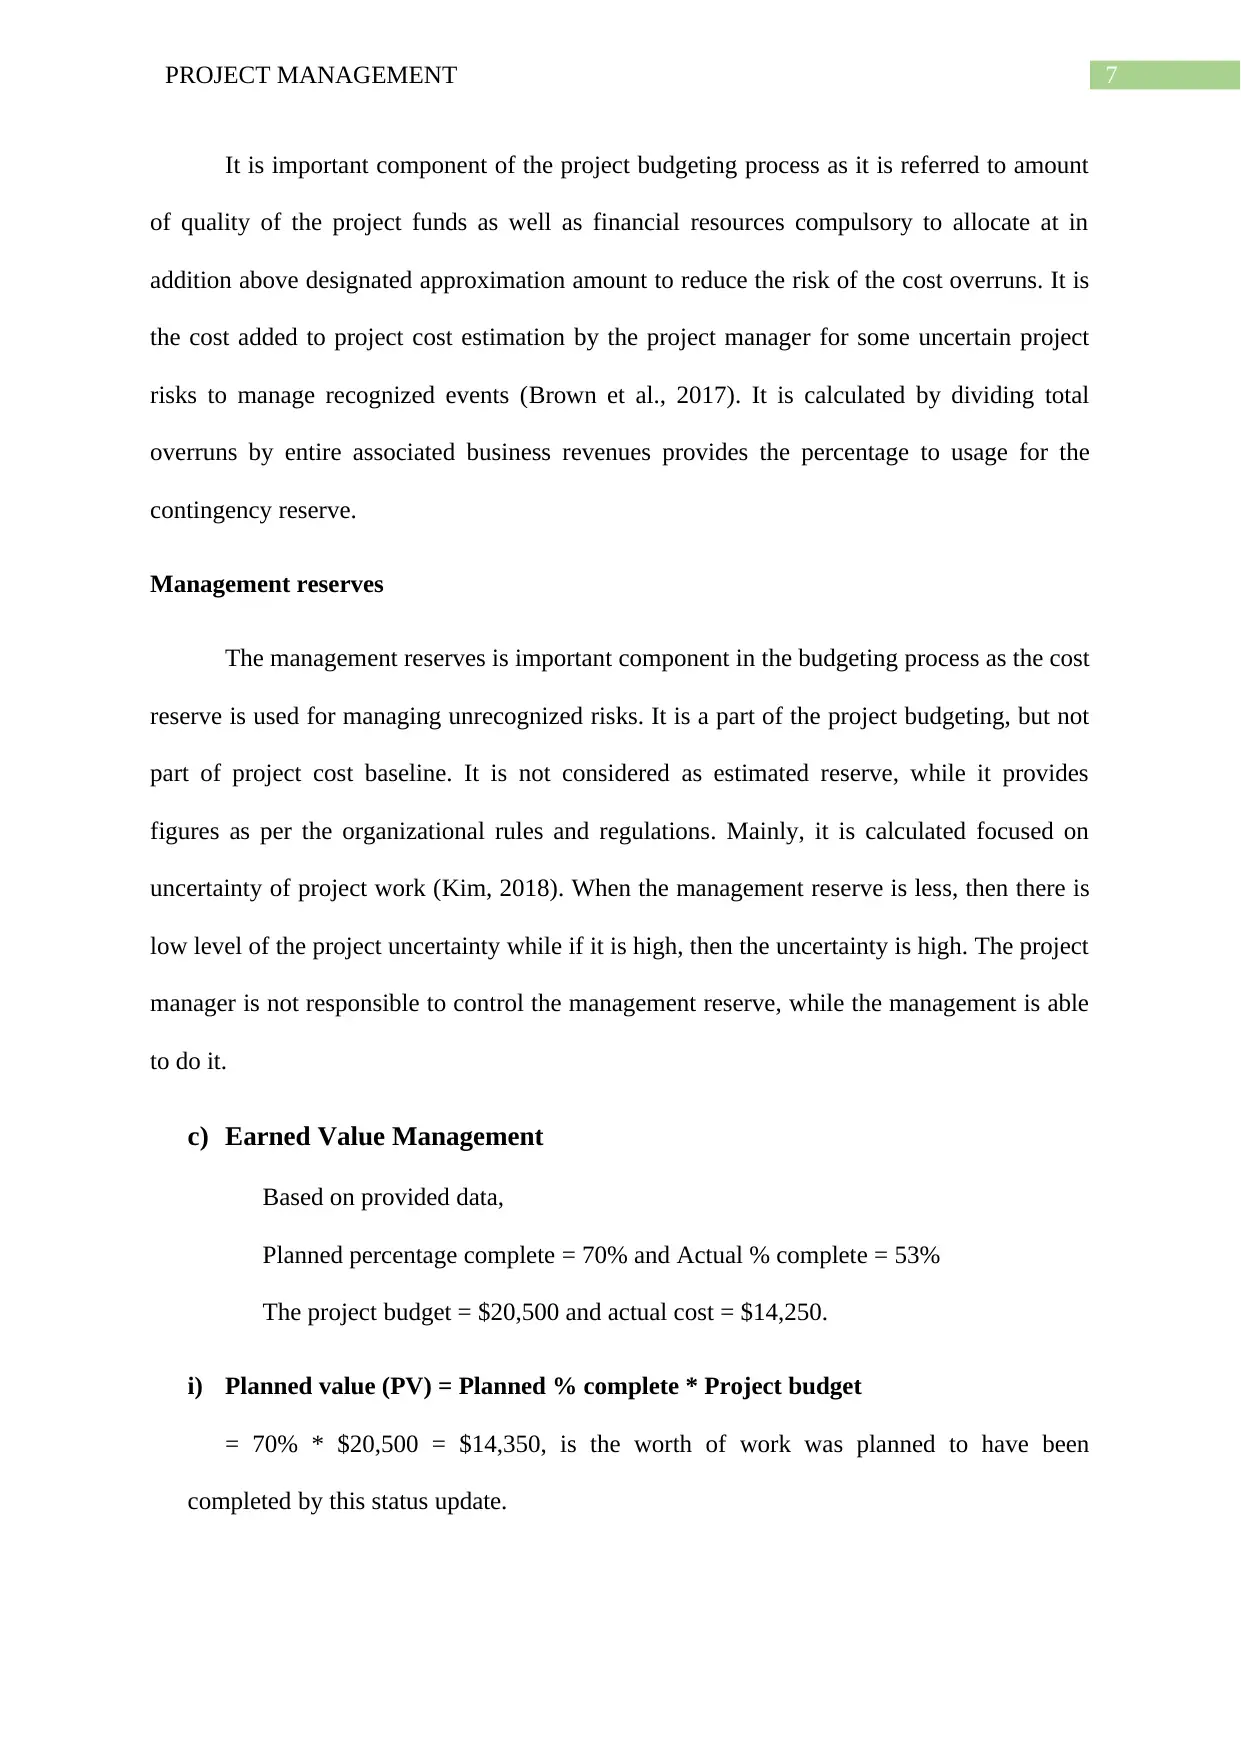
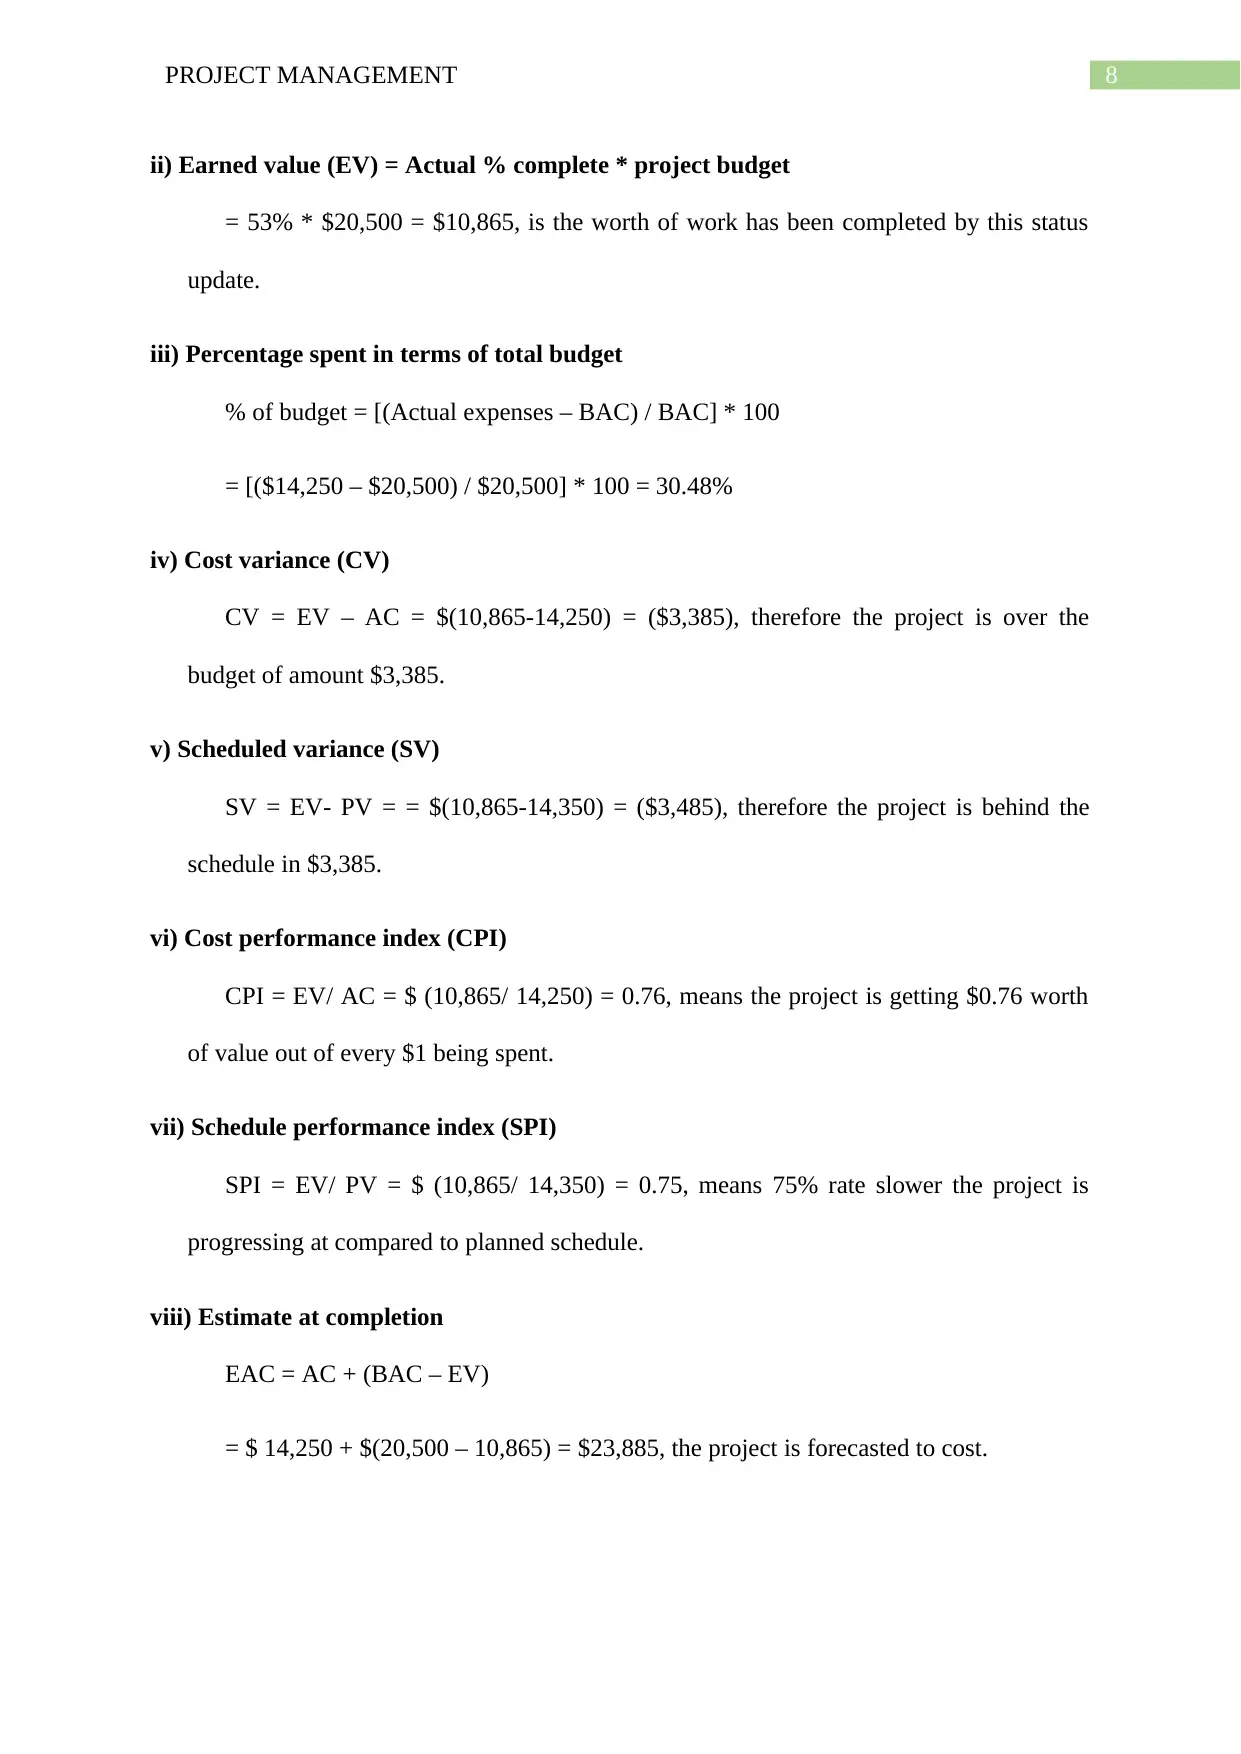
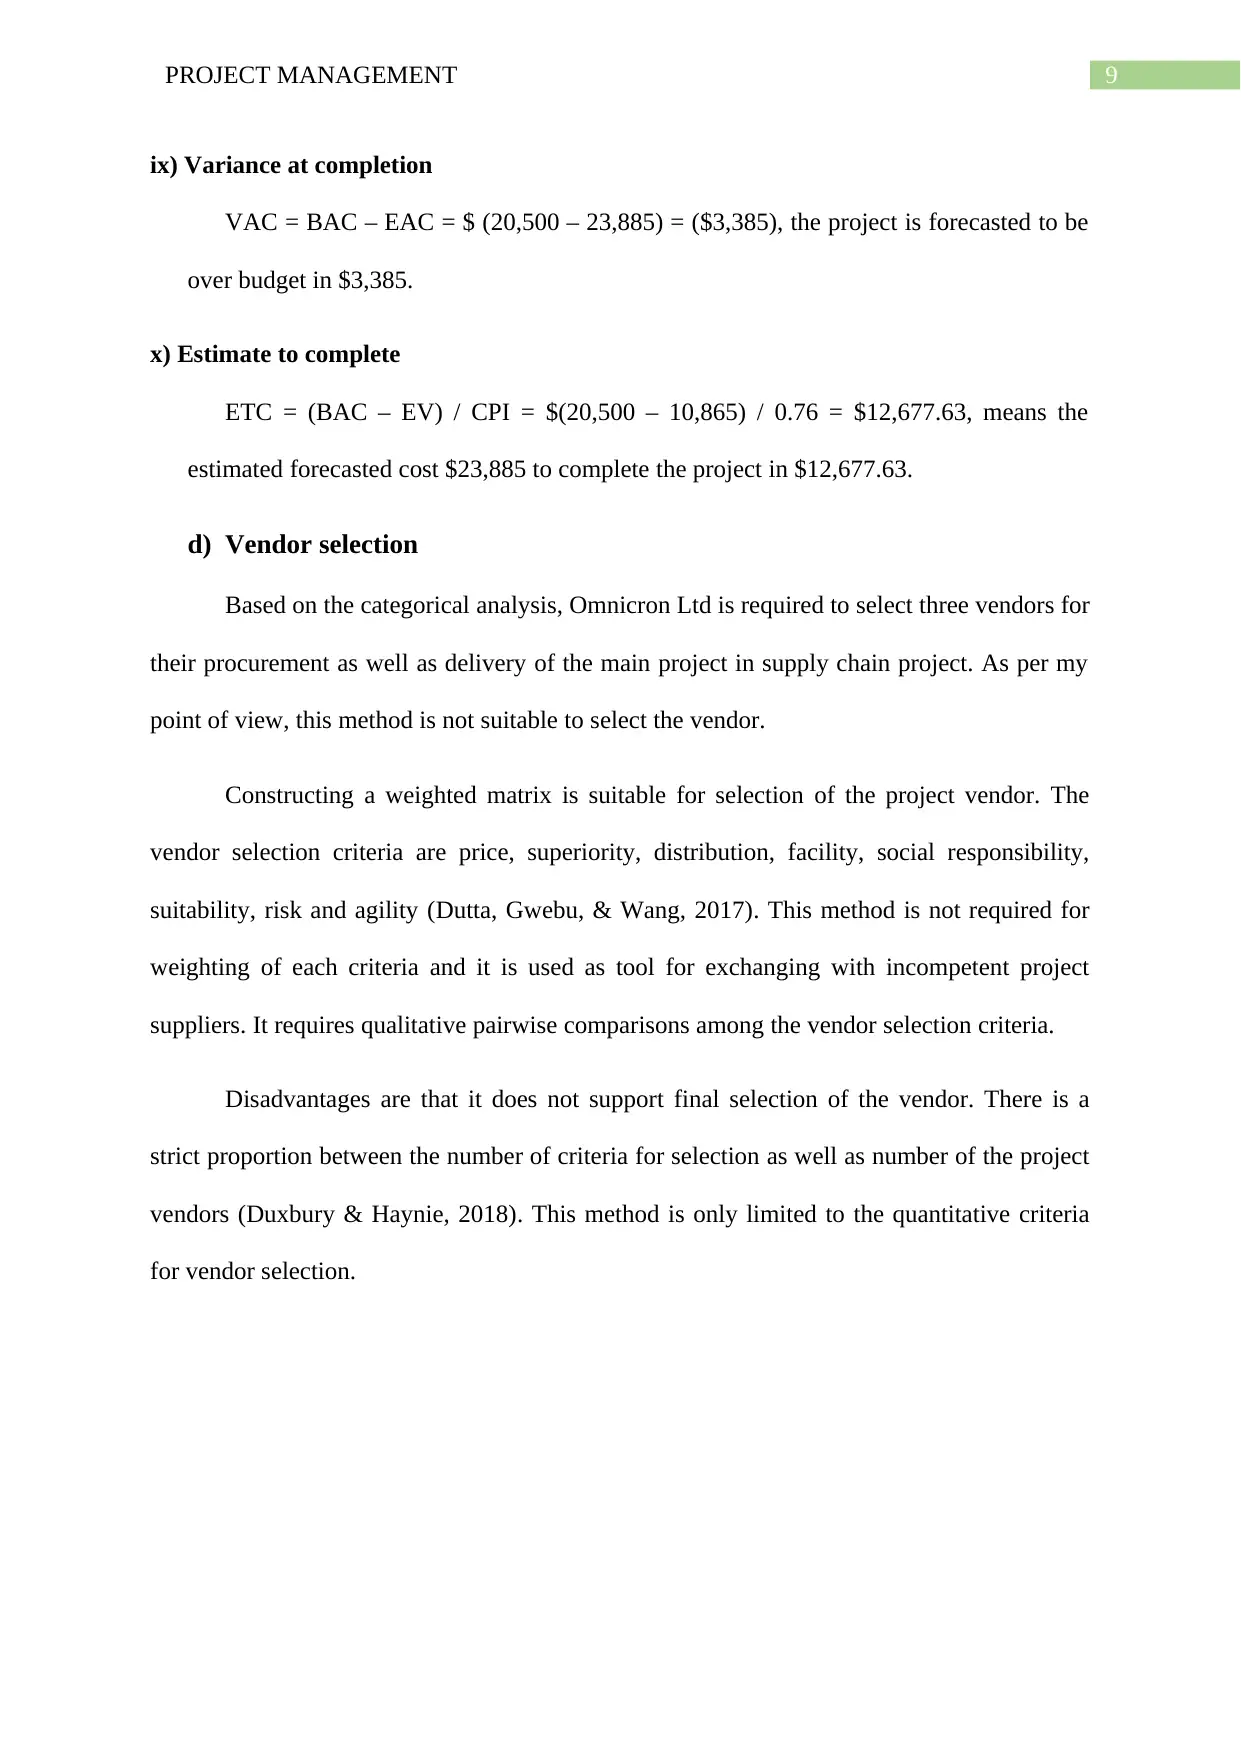
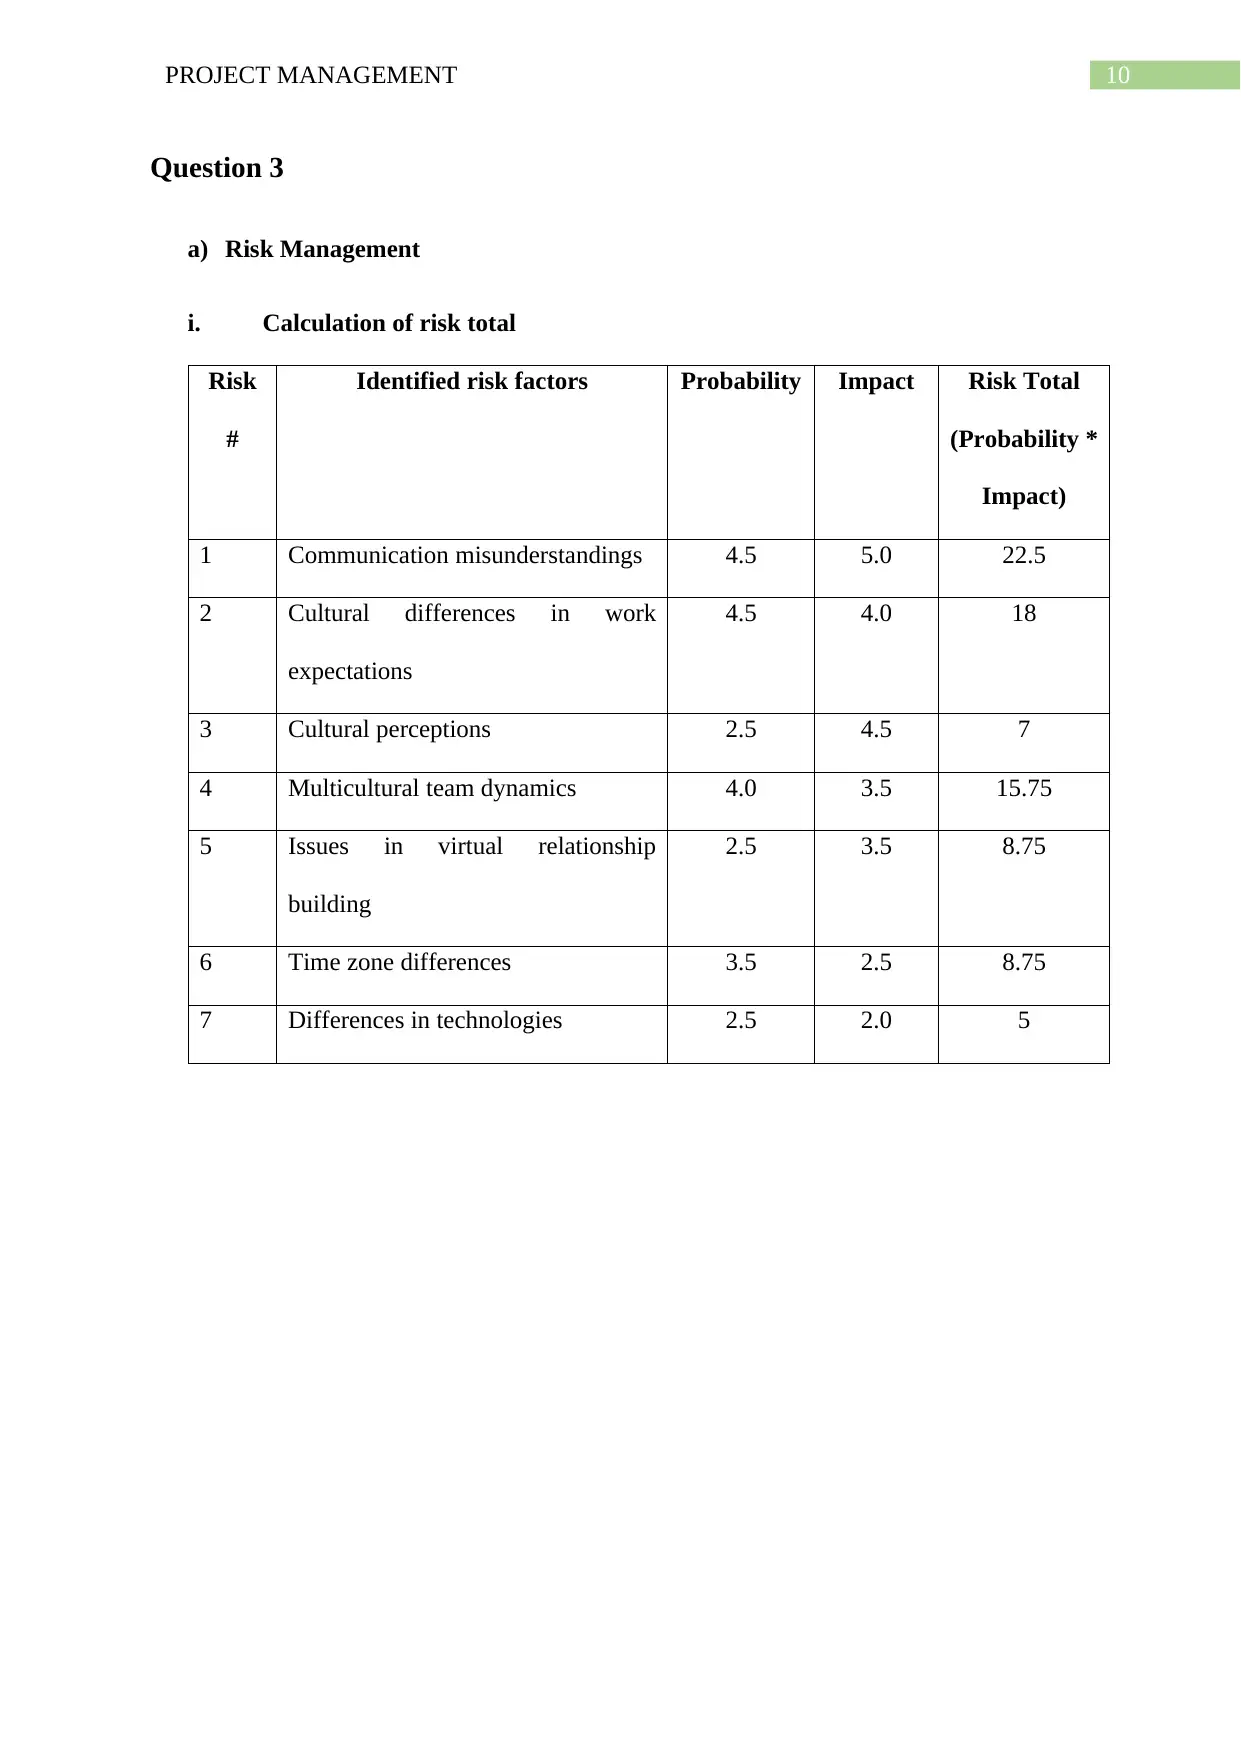
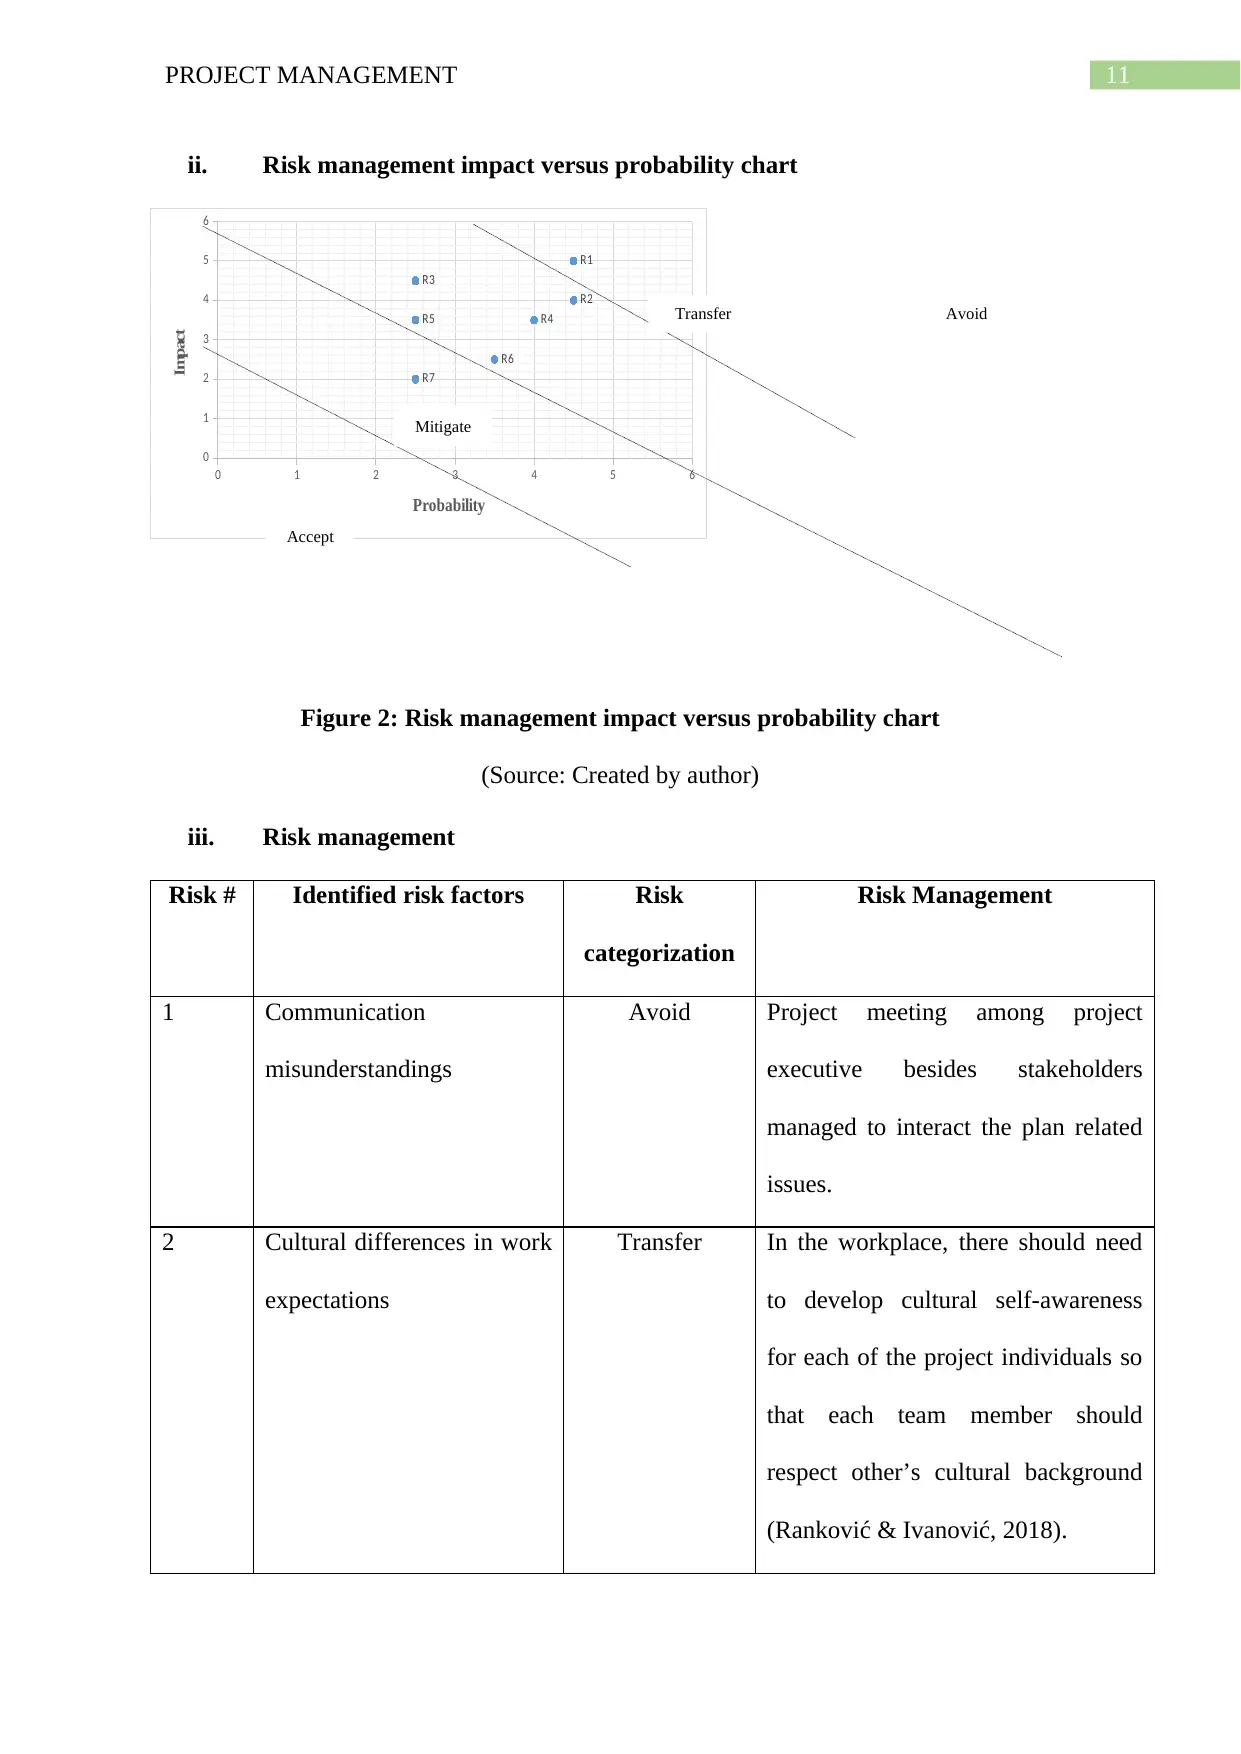
This project management assignment, completed for a Graduate Diploma in Applied Management (DAM798), comprehensively addresses key project management concepts. The assignment begins with the creation of a network diagram and the calculation of critical path elements such as EST, LST, EFT, and LFT. It then delves into cost estimation techniques, comparing bottom-up and top-down approaches and analyzing their advantages and disadvantages. The assignment also includes a detailed examination of the project budgeting process, encompassing contingency and management reserves, alongside an application of Earned Value Management (EVM) techniques, calculating PV, EV, CV, SV, CPI, SPI, EAC, VAC, and ETC. Furthermore, the document provides a vendor selection analysis and a thorough risk management plan, including risk identification, categorization, and mitigation strategies. Finally, the assignment evaluates project management software tools, discussing their capabilities and limitations. The assignment demonstrates a strong understanding of project management principles and their practical application.
1 out of 18
Related Documents


Your All-in-One AI-Powered Toolkit for Academic Success.
+13062052269
info@desklib.com
Available 24*7 on WhatsApp / Email
![[object Object]](/_next/static/media/star-bottom.7253800d.svg)
Copyright © 2020–2026 A2Z Services. All Rights Reserved. Developed and managed by ZUCOL.