Comprehensive Analysis of Indonesia's Economic Performance (2004-2013)
VerifiedAdded on 2020/03/04
|13
|2867
|79
Report
AI Summary
This economics report critically analyzes Indonesia's economic performance from 2004 to 2013, focusing on production output, labor market dynamics, and price level analysis. The report examines key indicators such as GDP growth, GDP per capita, unemployment rates, and inflation trends, providing insights into the country's economic stability and growth. It also explores the types of unemployment prevalent in Indonesia and the government's initiatives to achieve full employment, including infrastructure development, SME support, and vocational training programs. Furthermore, the report delves into the causes of inflation, including fuel subsidies and demand-pull factors, and discusses government measures to contain inflation. The analysis highlights Indonesia's resilience during the global financial crisis and the factors contributing to its sustained economic growth, making it a valuable resource for understanding Indonesia's economic trajectory.
ECONOMICS ASSIGNMENT
[Type the document subtitle]
STUDENT ID
[Pick the date]
[Type the document subtitle]
STUDENT ID
[Pick the date]
Paraphrase This Document
Need a fresh take? Get an instant paraphrase of this document with our AI Paraphraser
Introduction
Indonesia is a rising Asian giant which has been largely ignored by the international
community but holds huge promise for the future based on the recent economic
performance and rising political stability. The GDP of the nation is 9th largest in the world
on PPP basis and has witnessed rapid strides in the last decade or so. This is apparent
from the fact that even at the height of the financial crisis in 2008-2009, Indonesia was
the second fastest growing economy in the world placed only after China (Elias and
Noone, 2011). The objective of the current paper is to critically analyse the country’s
economic performance based on three key aspects namely production output, labour
and price. A period of 10 years starting from 2004 onwards has been taken for
consideration. Further, the report also aims to provide an outline of the key indicators
along with the government initiatives in order to ensure robust performance across
these three key aspects which are pivotal for sustainable growth.
Production Output Performance Analysis
In order to analyse the production output performance of the country, it is essential to
discuss the major performance indicators which are highlighted below (Mankiw, 2012):
GDP
The real gross domestic product (GDP) is the total of the market values of all the goods
and services which are produced in the country at constant prices in a specified price
time period. This specified time frame is generally the income year.
GDP Growth Rate
For a specified time period (mostly yearly or quarterly) the % change in the GDP at
constant prices is termed as real GDP growth rate. It is considered to be a main
performance indicator which is used in order to determine the economic growth rate of
the country.
GDP Per Capita
1
The living standards of the residents of the respective country are generally measured
based on the GDP per capita. The value of GDP per capita is determined as furnished
below:
GDP per capita= Real GDP
Total National Population of the Country
The high value of GDP per capita is the indicator of the improvement of the living
standards of the citizens of the country which then indicates the economic growth of the
country (Hoover, 2012).
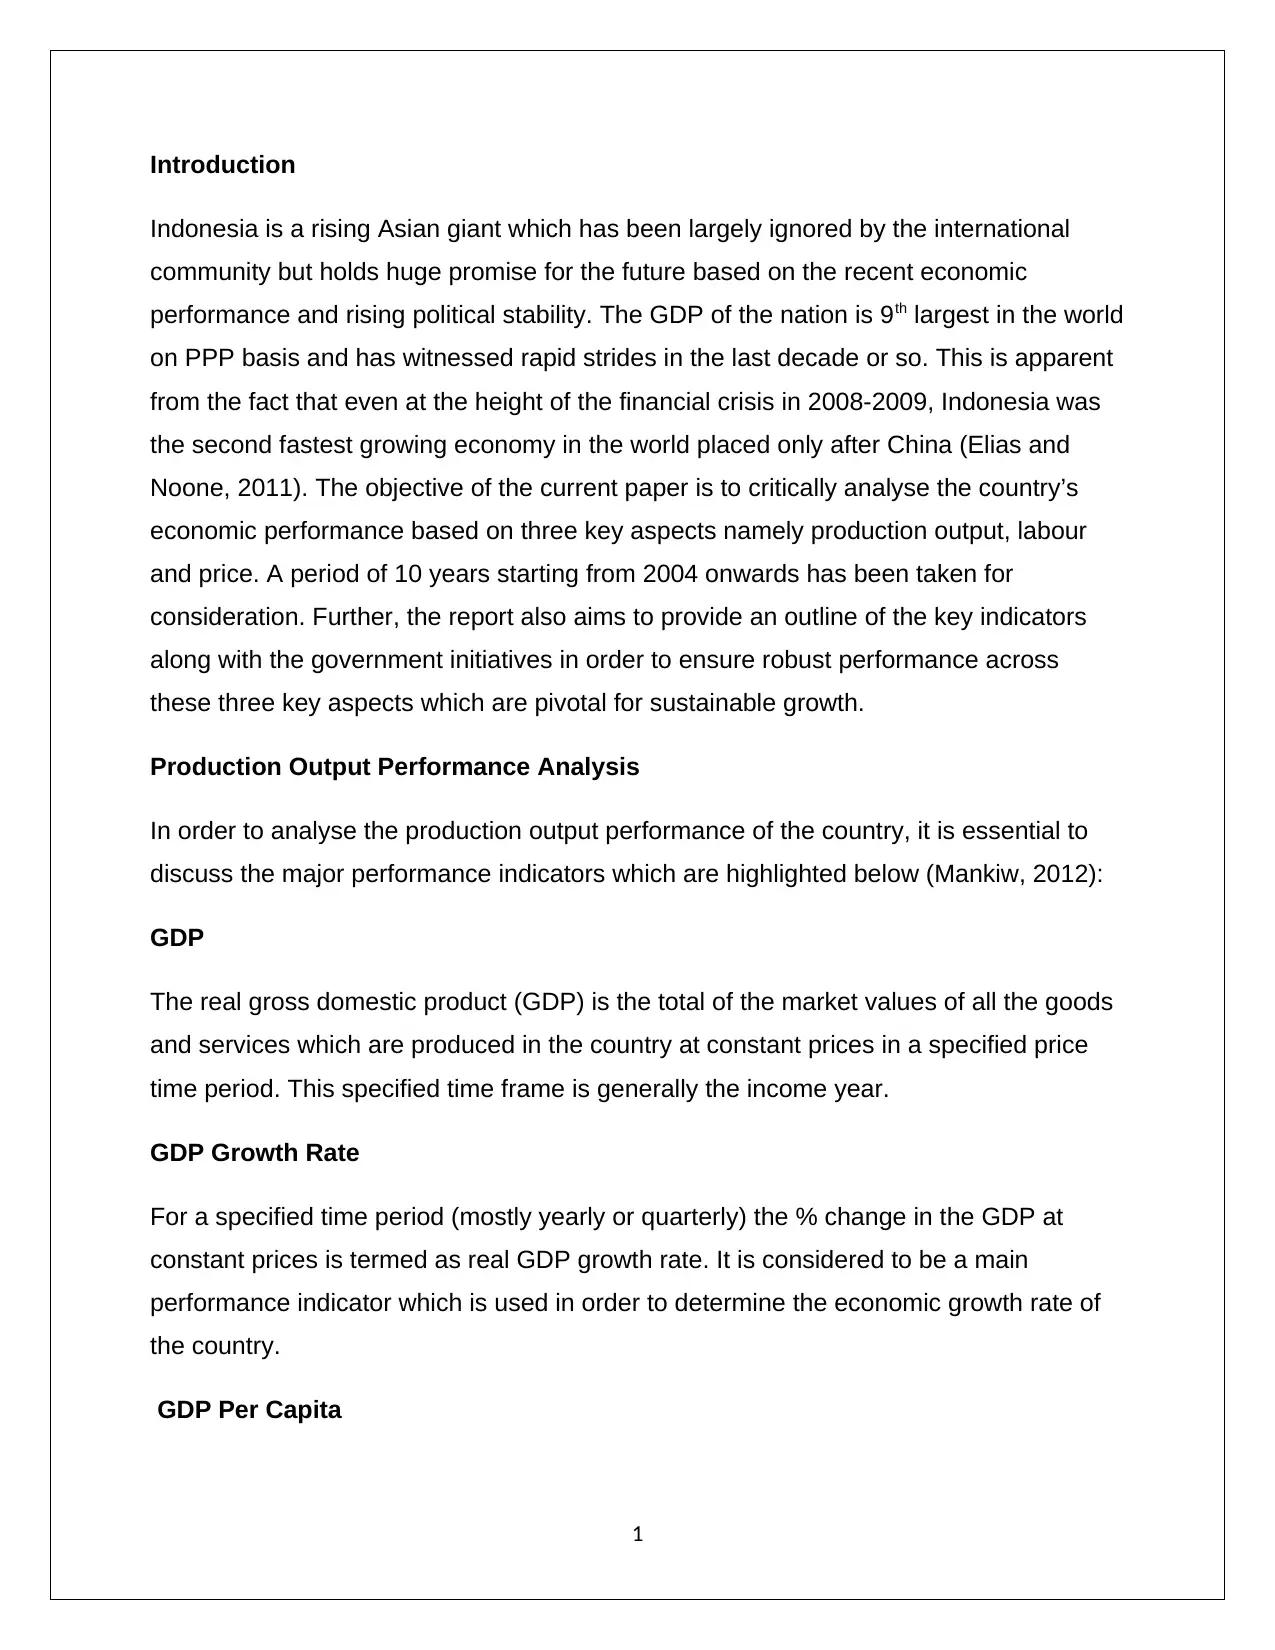
GDP Growth Rate
Figure 1: INDONESIA GDP GROWTH RATE (2004-2013)
Based on the above chart, it can be seen that for the ten years starting from year 2004
to 2013, the real GDP growth rate was in the excess of 4%. Further, the minimal value
of 4.1% had been recorded at the end of year 2009. However, it can be noticed that
there was not much effect of global financial crisis on the economy of Indonesia
2
based on the GDP per capita. The value of GDP per capita is determined as furnished
below:
GDP per capita= Real GDP
Total National Population of the Country
The high value of GDP per capita is the indicator of the improvement of the living
standards of the citizens of the country which then indicates the economic growth of the
country (Hoover, 2012).
GDP Growth Rate
Figure 1: INDONESIA GDP GROWTH RATE (2004-2013)
Based on the above chart, it can be seen that for the ten years starting from year 2004
to 2013, the real GDP growth rate was in the excess of 4%. Further, the minimal value
of 4.1% had been recorded at the end of year 2009. However, it can be noticed that
there was not much effect of global financial crisis on the economy of Indonesia
2
⊘ This is a preview!⊘
Do you want full access?
Subscribe today to unlock all pages.
Trusted by 1+ million students worldwide
because the economic growth of the country is more dependent on the domestic
demand. Therefore, GDP growth rate attracted high capital after the financial crisis. In
ten periods, the maximum real GDP growth rate i.e. 7.2% had been recorded at the end
of the financial year 2004 (Trading Economics, 2017).
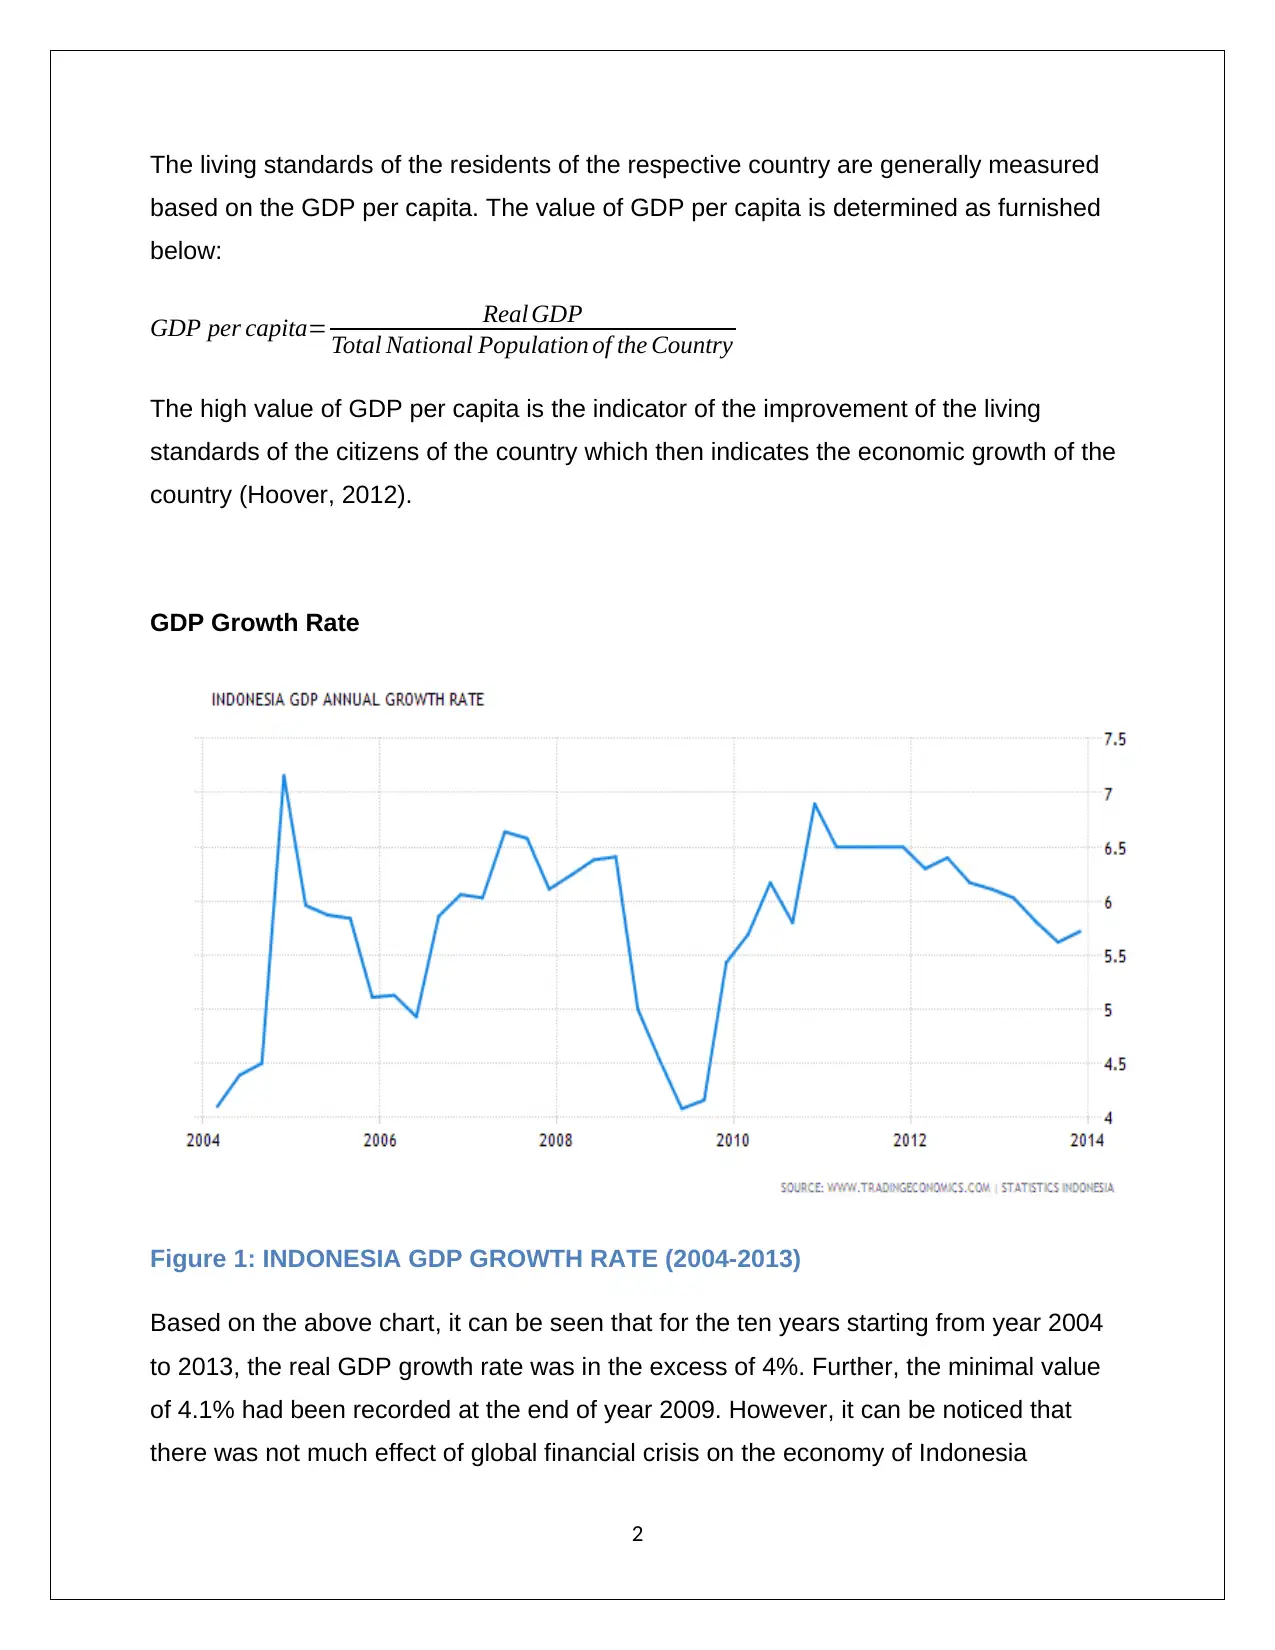
GDP Per Capita
Figure 2: INDONESIA GDP PER CAPITAL (2004-2013)
It is apparent from the above highlighted GDP per capita trend that the living standards
of the residents of Indonesia have kept on increasing. This fact is also supported from
the growth of the real GDP of Indonesia which illustrates the growth of the population of
Indonesia. Further, the lowest value of GDP per capita has been recorded in the year
2004 with a value of $ 2,420.58. This value had been reached a maximum value of
$3,570.93 at the end of financial year 2013 (Trading Economics, 2017).
Performance Trends of Indonesia
3
demand. Therefore, GDP growth rate attracted high capital after the financial crisis. In
ten periods, the maximum real GDP growth rate i.e. 7.2% had been recorded at the end
of the financial year 2004 (Trading Economics, 2017).
GDP Per Capita
Figure 2: INDONESIA GDP PER CAPITAL (2004-2013)
It is apparent from the above highlighted GDP per capita trend that the living standards
of the residents of Indonesia have kept on increasing. This fact is also supported from
the growth of the real GDP of Indonesia which illustrates the growth of the population of
Indonesia. Further, the lowest value of GDP per capita has been recorded in the year
2004 with a value of $ 2,420.58. This value had been reached a maximum value of
$3,570.93 at the end of financial year 2013 (Trading Economics, 2017).
Performance Trends of Indonesia
3
Paraphrase This Document
Need a fresh take? Get an instant paraphrase of this document with our AI Paraphraser
Based on the above performance analysis, it is evident that the economy of Indonesia is
not much dependent on the exports as compared with the other Asian economies.
Therefore, it is the main reason that the economy of Indonesia has stood and maintain
the constant growth even when the global financial crisis struck. Also, the strong base
condition of the domestic growth of the country resulted in significant economic growth
of Indonesia during these 10 years. High value of GDP per capita is also highlighted in
the incremental spending of the consumers, which enhanced the confidence level of the
citizens of country. The effective, stable policies of country and political support
enhanced the total capital usually after 2010 which also lead to the increase in the
purchasing power of the residents of Indonesia (Goodwin et al., 2013).
Government Measurement GDP to Achieve the Economic Performance
It has been observed that Indonesian government has taken several effective steps in
order to enhance the economic performance of the country. The main features of
government measurements are as furnished below (Elias & Noone, 2011):
Simplification of law and regulation - Indonesian government has provided the
opportunity to investors to bring in capital by providing a stable legal and political
regime.
Significant investment in the infrastructure - In the process of improving the exports
and supporting the economy of Indonesia, the government has taken cost
competitive steps by investing in hard and soft infrastructure investment.
Low interest credit has been offered to the respective SME’s in order to attract and
support entrepreneurs which has created a positive impact on the economy of the
country.
Government is focusing on enhancement and development of the service sector
During the peak phase of global financial crisis, the government has implemented
“monetary policy and prudent fiscal measure” in order to spur healthy domestic
demand in the country (Mankiw, 2012).
Labor Market Analysis
4
Unemployment
Unemployment would take place when the educated and skilled individuals who want to
work but unfortunately they are not able to get job opportunity. It is known that
Indonesia is a labor intensive economy which means that unemployment rate is a core
measure to determine the economic growth of the country. Also, unemployment comes
in the category of one of the major macroeconomic indicator to know about the
economic scenario and position of the country (McTaggart, Findlay & Parkin, 2012).
Types of Unemployment
There are three type of unemployment that are generally seen which are illustrated
below (Trading Economics, 2016):
1. Frictional Unemployment
When an individual has left the current job in order to find more suitable or high payoff
job then the incurred unemployment is termed as frictional unemployment (Mankiw,
2012).
2. Cyclical Unemployment
This type of unemployment arises when the business cycle changes and due to this
significant reduction in the demand of employee incurred (Suryadarma et., al. 2007).
3. Structural Unemployment
This type of unemployment arises when there is automation of the existing process or
sudden change in operation or in technology and the current employees are not enough
competent to work in the new environment and become unemployed (Goodwin et al.,
2013).
Unemployment Trend in Indonesia
5
⊘ This is a preview!⊘
Do you want full access?
Subscribe today to unlock all pages.
Trusted by 1+ million students worldwide
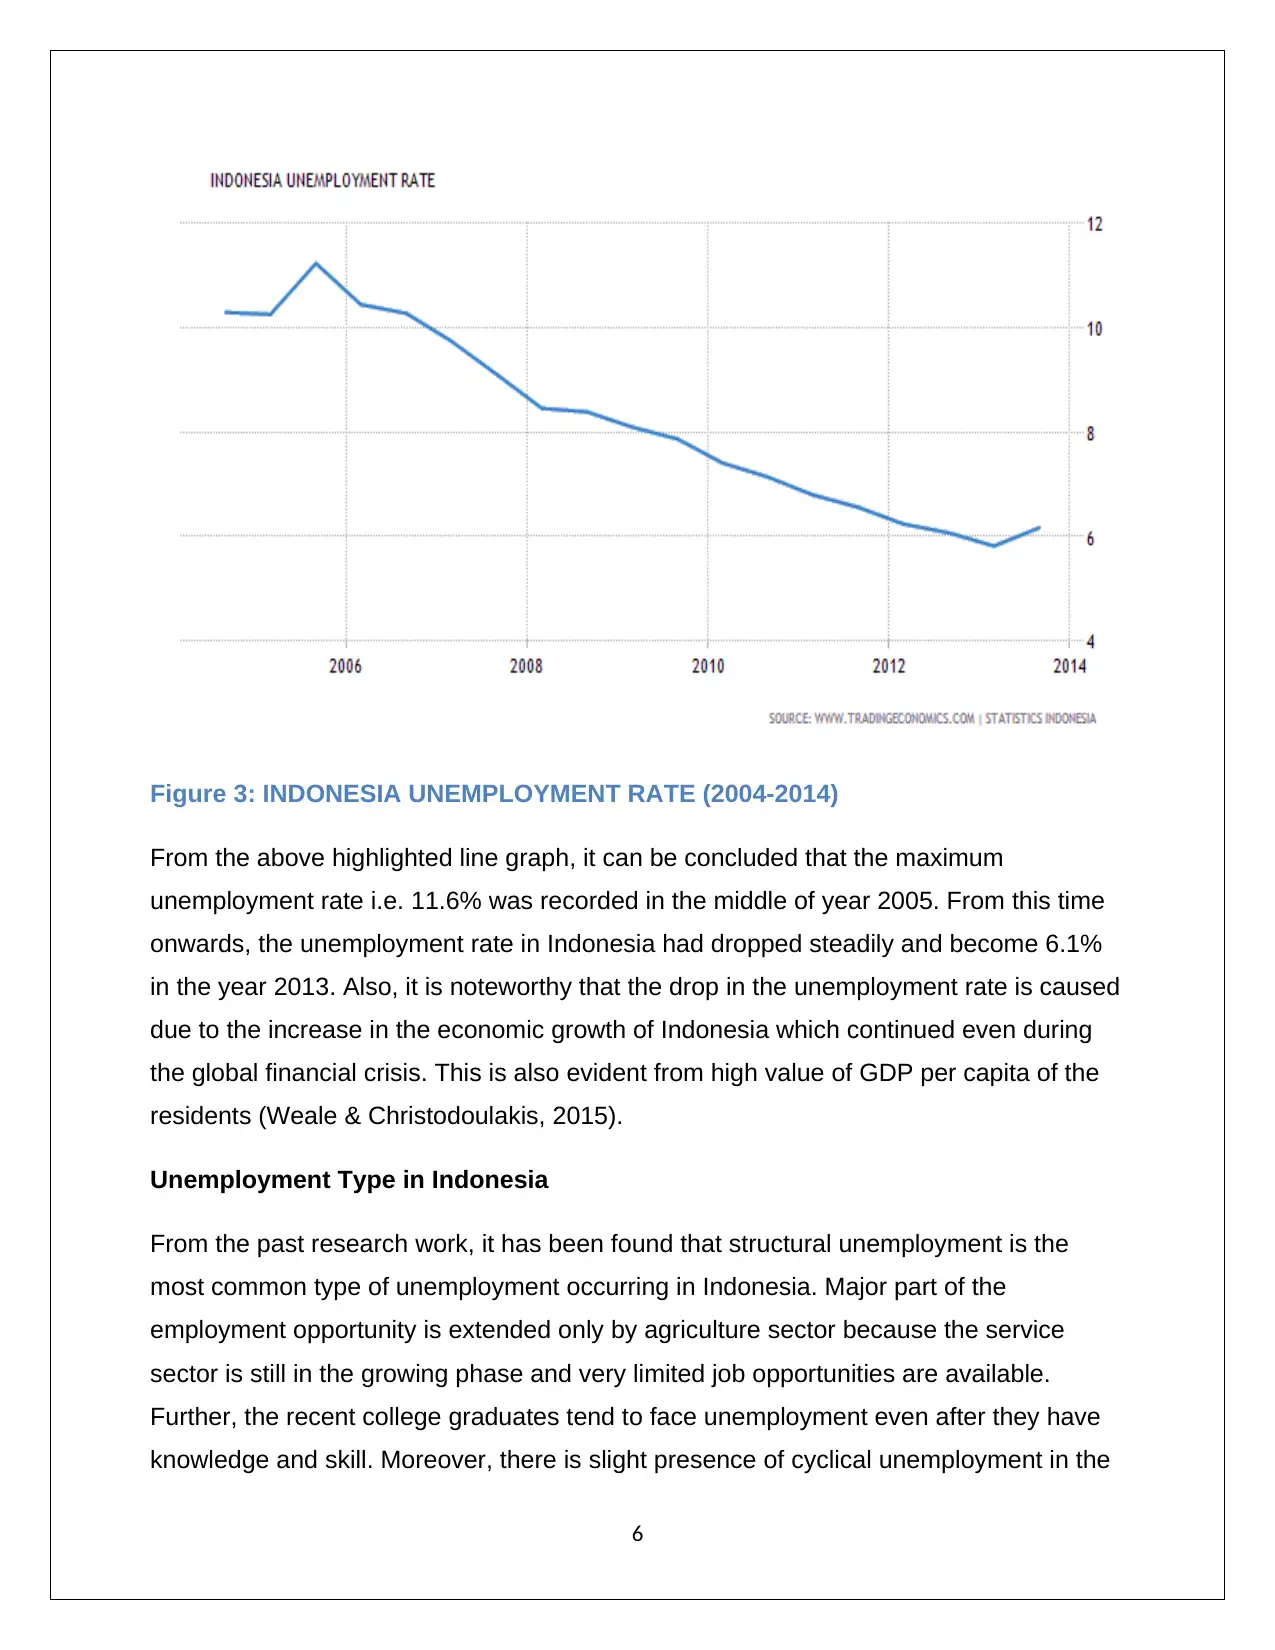
Figure 3: INDONESIA UNEMPLOYMENT RATE (2004-2014)
From the above highlighted line graph, it can be concluded that the maximum
unemployment rate i.e. 11.6% was recorded in the middle of year 2005. From this time
onwards, the unemployment rate in Indonesia had dropped steadily and become 6.1%
in the year 2013. Also, it is noteworthy that the drop in the unemployment rate is caused
due to the increase in the economic growth of Indonesia which continued even during
the global financial crisis. This is also evident from high value of GDP per capita of the
residents (Weale & Christodoulakis, 2015).
Unemployment Type in Indonesia
From the past research work, it has been found that structural unemployment is the
most common type of unemployment occurring in Indonesia. Major part of the
employment opportunity is extended only by agriculture sector because the service
sector is still in the growing phase and very limited job opportunities are available.
Further, the recent college graduates tend to face unemployment even after they have
knowledge and skill. Moreover, there is slight presence of cyclical unemployment in the
6
Paraphrase This Document
Need a fresh take? Get an instant paraphrase of this document with our AI Paraphraser
country (Indonesia-Investments. 2015). The economy of Indonesia is kept on improving
which has resulted in development of the new business cyclic and hence, cyclic
unemployment is kept on decreasing especially in the last decade. It is noteworthy that
presence of frictional unemployment is very limited because due to lack of employment,
the current employees are not much interested to leave the current job with the
objective to get suitable job (Pigou, 2013).
Government Measure to Achieve Full Employment
The main positive steps taken by the Indonesian government in order to achieve full
employment in the country are as highlighted below (G20, 2014):
Development of rural infrastructure in regards to create job opportunity in service
sector rather than agriculture sector in the rural area
Simplicity of law and regulation and extending suitable and stable policies which
would provide platform to SMS’s especially in the manufacturing industry
Development of National Entrepreneurship Program in country so that entrepreneur
would be able to start small and medium scale business in all part of the country
Offering public vocational training program to the population so that structural
unemployment can be reduced and current employees are able to work in the new
advance work environment (McTaggart, Findlay & Parkin, 2012).
Price Level Analysis
Inflation
It is a market condition when the purchasing power of currency of the respective country
has been reduced because the price of the goods and services has significantly
increased from their base rate.
Rate of inflation
On an annual basis, the percentage change in the “Consumer Price Index (CPI)” is
termed as rate of inflation. This rate interprets the determination of percent change in
7
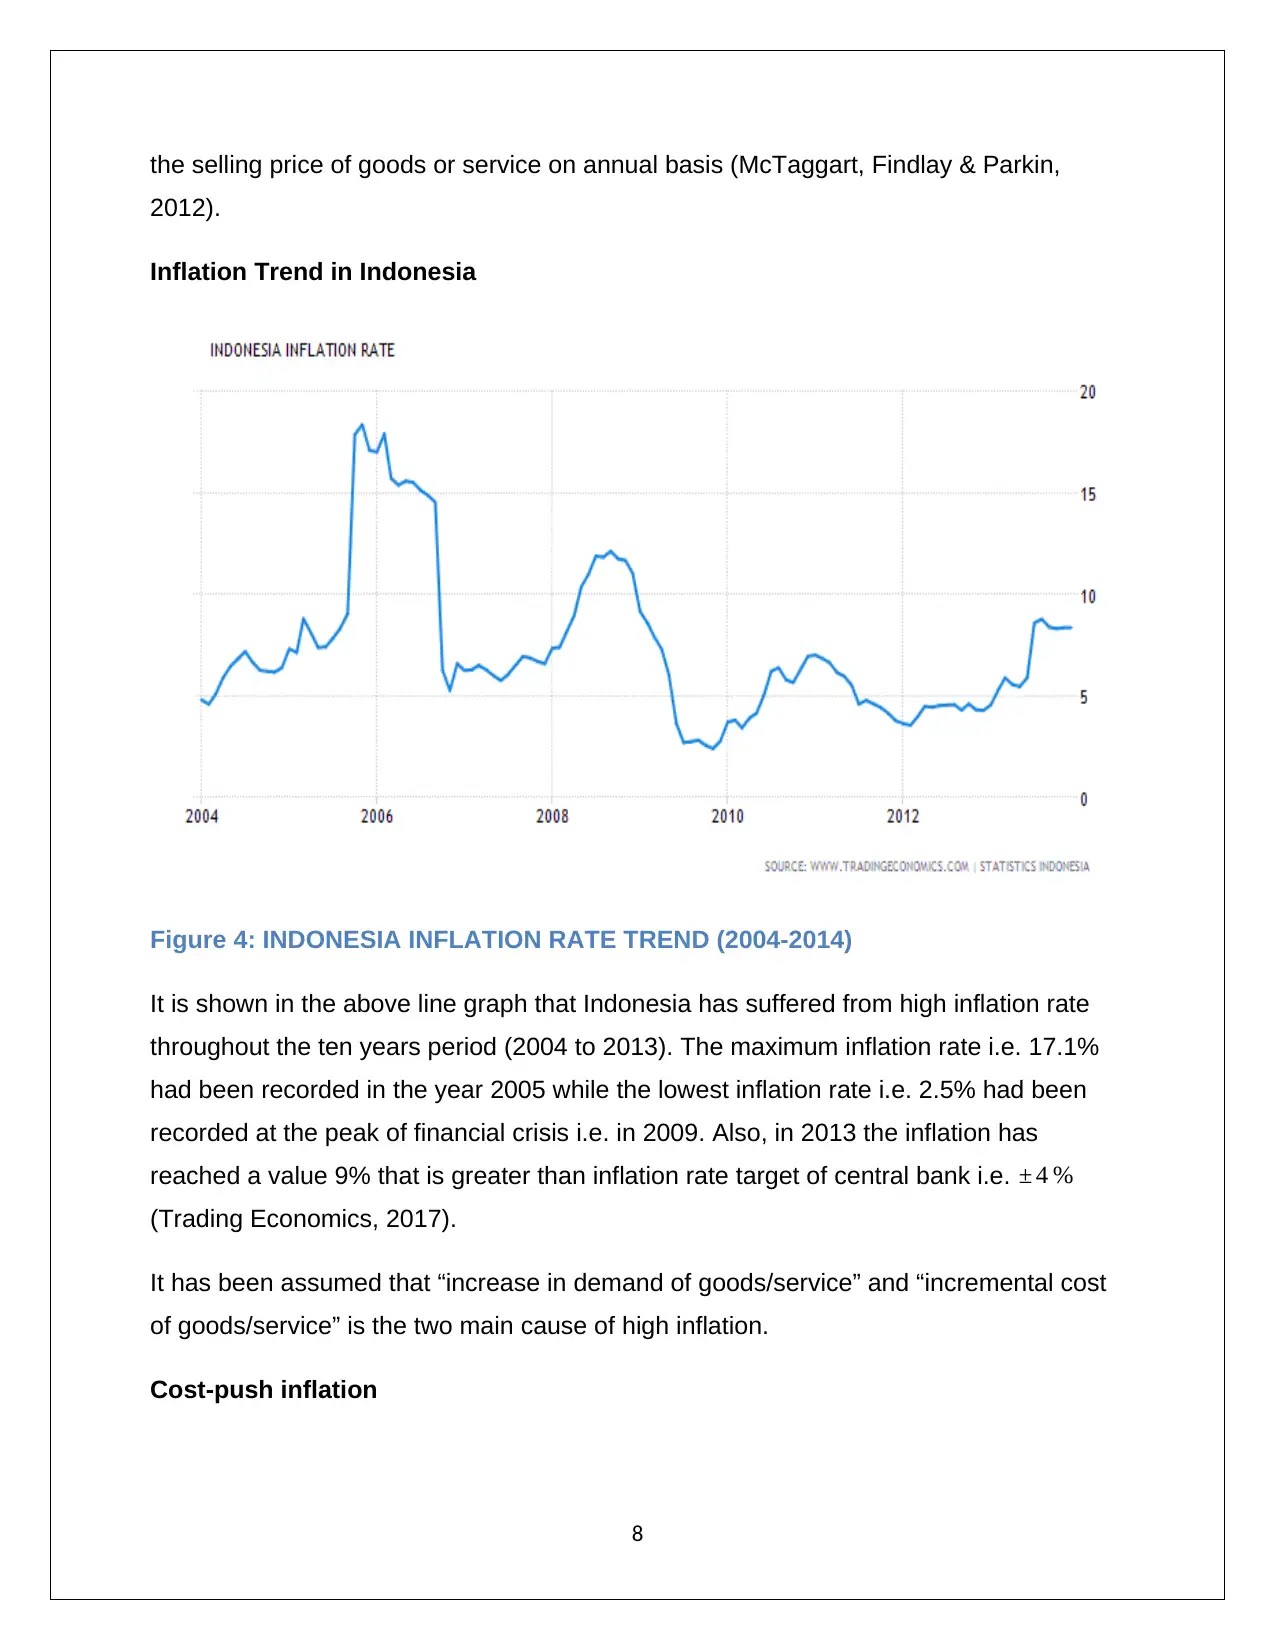
the selling price of goods or service on annual basis (McTaggart, Findlay & Parkin,
2012).
Inflation Trend in Indonesia
Figure 4: INDONESIA INFLATION RATE TREND (2004-2014)
It is shown in the above line graph that Indonesia has suffered from high inflation rate
throughout the ten years period (2004 to 2013). The maximum inflation rate i.e. 17.1%
had been recorded in the year 2005 while the lowest inflation rate i.e. 2.5% had been
recorded at the peak of financial crisis i.e. in 2009. Also, in 2013 the inflation has
reached a value 9% that is greater than inflation rate target of central bank i.e. ± 4 %
(Trading Economics, 2017).
It has been assumed that “increase in demand of goods/service” and “incremental cost
of goods/service” is the two main cause of high inflation.
Cost-push inflation
8
⊘ This is a preview!⊘
Do you want full access?
Subscribe today to unlock all pages.
Trusted by 1+ million students worldwide
The manufacturing cost essentially depends on a myriad of input factors which includes
labour, land, capital along with entrepreneurship. The market price tends to increase
when the manufacturing cost of the given underlying product tends to increase and this
leads to cost push inflation. Due to higher manufacturing cost, temporary shortage of
good may be observed till the price is revised to a higher value (Mankiw, 2012).
Demand-pull inflation
The demand pull inflation is caused when there is higher demand which the supply is
not able to cater to. This may result from full level of employment or increase in income
levels of the individuals. This essentially leads to availability of higher disposable
income which lead to higher demand for various products thus leading to higher price
for goods and services as in the short term, the supply cannot make adjustments
(McTaggart, Findlay & Parkin, 2012).
Cause of inflation - Indonesia
On account of the reasons outlined below, high inflation has been witnessed in
Indonesia (UNAND, 2013).
The fuel subsidies are significant and prevalent even in the present and higher
revision of subsidies when oil price increases leads to higher inflation. An
example of this was witnessed in 2005 when inflation in excess of 15% was
observed.
Demand led inflation is also prevalent on back of the economic growth that the
country has witnessed leading to higher per capita income for people.
Ever since 2010, there have been quite frequent fluctuations in currency value
caused on account of foreign money inflow and outflow which has also led to
inflation.
Considering the staple food rice and rising international prices, food inflation has
been a factor responsible for overall inflationary trend in certain periods.
Techniques taken by Government to contain inflation
9
Paraphrase This Document
Need a fresh take? Get an instant paraphrase of this document with our AI Paraphraser
The government has taken a slew of measures in order to ensure that inflation is within
limits and these are outlined below (Manurung, 2013).
In order to control the increasing demand, a tight or restrictive monetary policy is
put into place to avoid demand led inflation as and when required.
In order to streamline the supply, initiatives have been undertaken by the
government in order to resolve the supply related constraints particularly in the
context of rice (Sambijantoro, 2014). A critical role in this regard is played by the
State Logistics Agency.
The government is taking active measures so as to bring down the duel related
subsidies by rationalization of the same and thereby containing inflation.
Conclusion
On the basis of the above discussion, it may be concludes that in the period under
consideration, Indonesia has witnessed rapid economic growth. Even though the global
financial crisis did have some impact of economic growth but it was not sufficient to
reverse the growth story. There has been a decline in the unemployment as economic
progress has been witnessed primarily on account of higher labour demand which may
be attributed to the initiatives taken by the government. But structural issues still need to
be sorted out for future growth and government intervention is required for the same.
The level of inflation witnessed has been on the higher side driven by food related
inflation along with ill-targeted fuel subsidies. However, measures have been taken by
the government in association with the central bank to keep the rising prices under
control which have achieved only moderate success till now.
10
References
Borio, C. (2014). The financial cycle and macroeconomics: What have we learnt?,
Journal of Banking & Finance, 45, 182-198.
Elias, S. & Noone, C. (2011), The Growth and Development of the Indonesian Economy,
Retrieved on August 16, 2017 from
http://www.rba.gov.au/publications/bulletin/2011/dec/pdf/bu-1211-4.pdf
G20 (2014), Employment Plan 2014 – Indonesia, Retrieved on August 16, 2017 from
www.g20ewg.org/index.php/.../5-
employmentplans?...47...employment...indonesia
Goodwin, N., Nelson, J., Harris, J., Torras, M. & Roach, B., (2013). Macroeconomics in
context, New York : ME Sharpe.
Hoover, K. (2012). Applied intermediate macroeconomics, Cambridge: Cambridge
University Press.
Indonesia-Investments (2015), Unemployment In Indonesia, Retrieved on August 16,
2017 from http://www.indonesia-investments.com/finance/macroeconomic-
indicators/unemployment/item255
Mankiw, N. (2012). Macroeconomics, New York: Worth Publishers
Manurung, N. (2013), Indonesia Inflation Rate at 4-Year High as Economy Set to Slow,
Retrieved on August 16, 2017 from
http://www.bloomberg.com/news/articles/2013-08-01/indonesia-inflation-rate-at-
4-year-high-as-economy-set-to-slow
McTaggart, D., Findlay, C., & Parkin, M. (2012). Macroeconomics, French Forest,
N.S.W.: Pearson
Pigou, A. C. (2013). Theory of unemployment, New York: Routledge
11
⊘ This is a preview!⊘
Do you want full access?
Subscribe today to unlock all pages.
Trusted by 1+ million students worldwide
1 out of 13
Related Documents


Your All-in-One AI-Powered Toolkit for Academic Success.
+13062052269
info@desklib.com
Available 24*7 on WhatsApp / Email
![[object Object]](/_next/static/media/star-bottom.7253800d.svg)
Unlock your academic potential
Copyright © 2020–2026 A2Z Services. All Rights Reserved. Developed and managed by ZUCOL.