NHE2486 Electrical Power & Drive Systems: Induction Machine Report

Verified

Added on  2021/04/17

|25
|2031
|44
Report
AI Summary
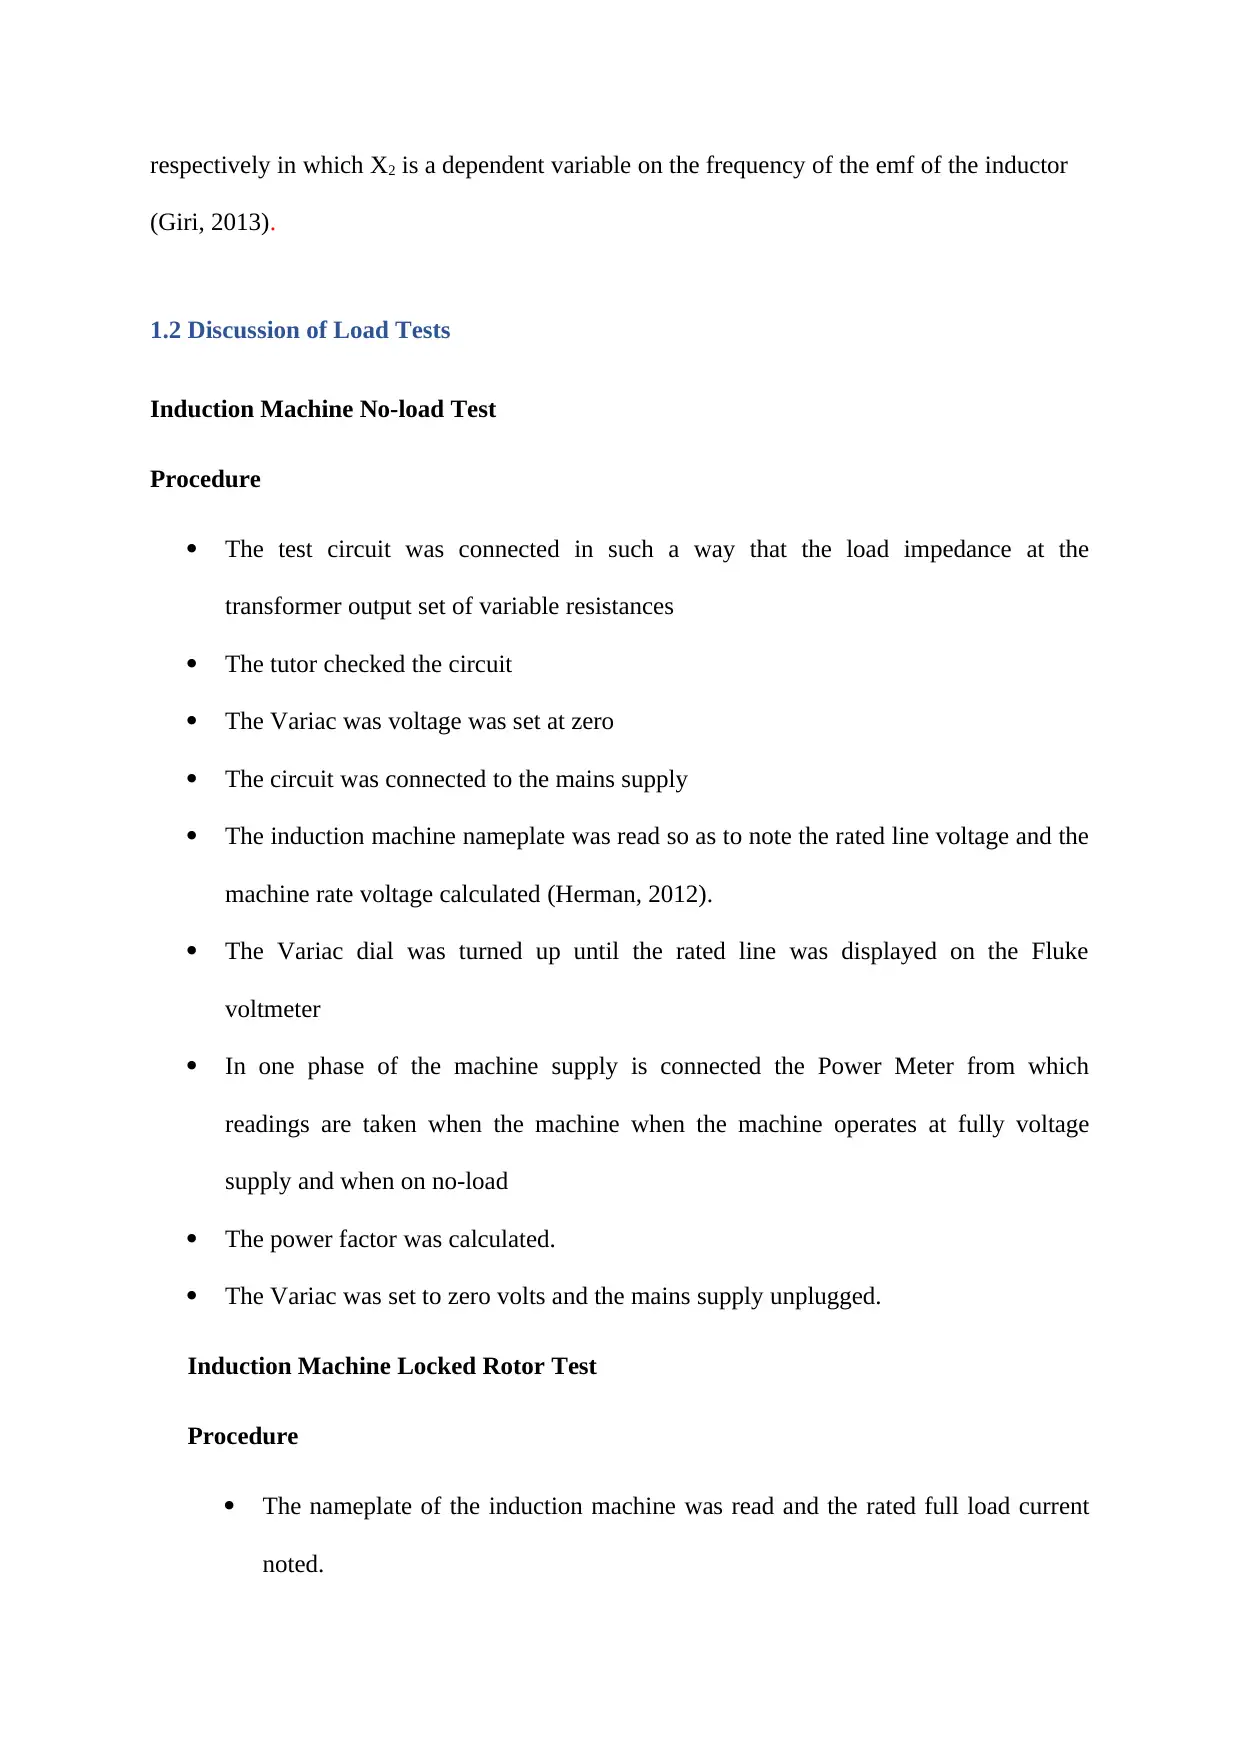
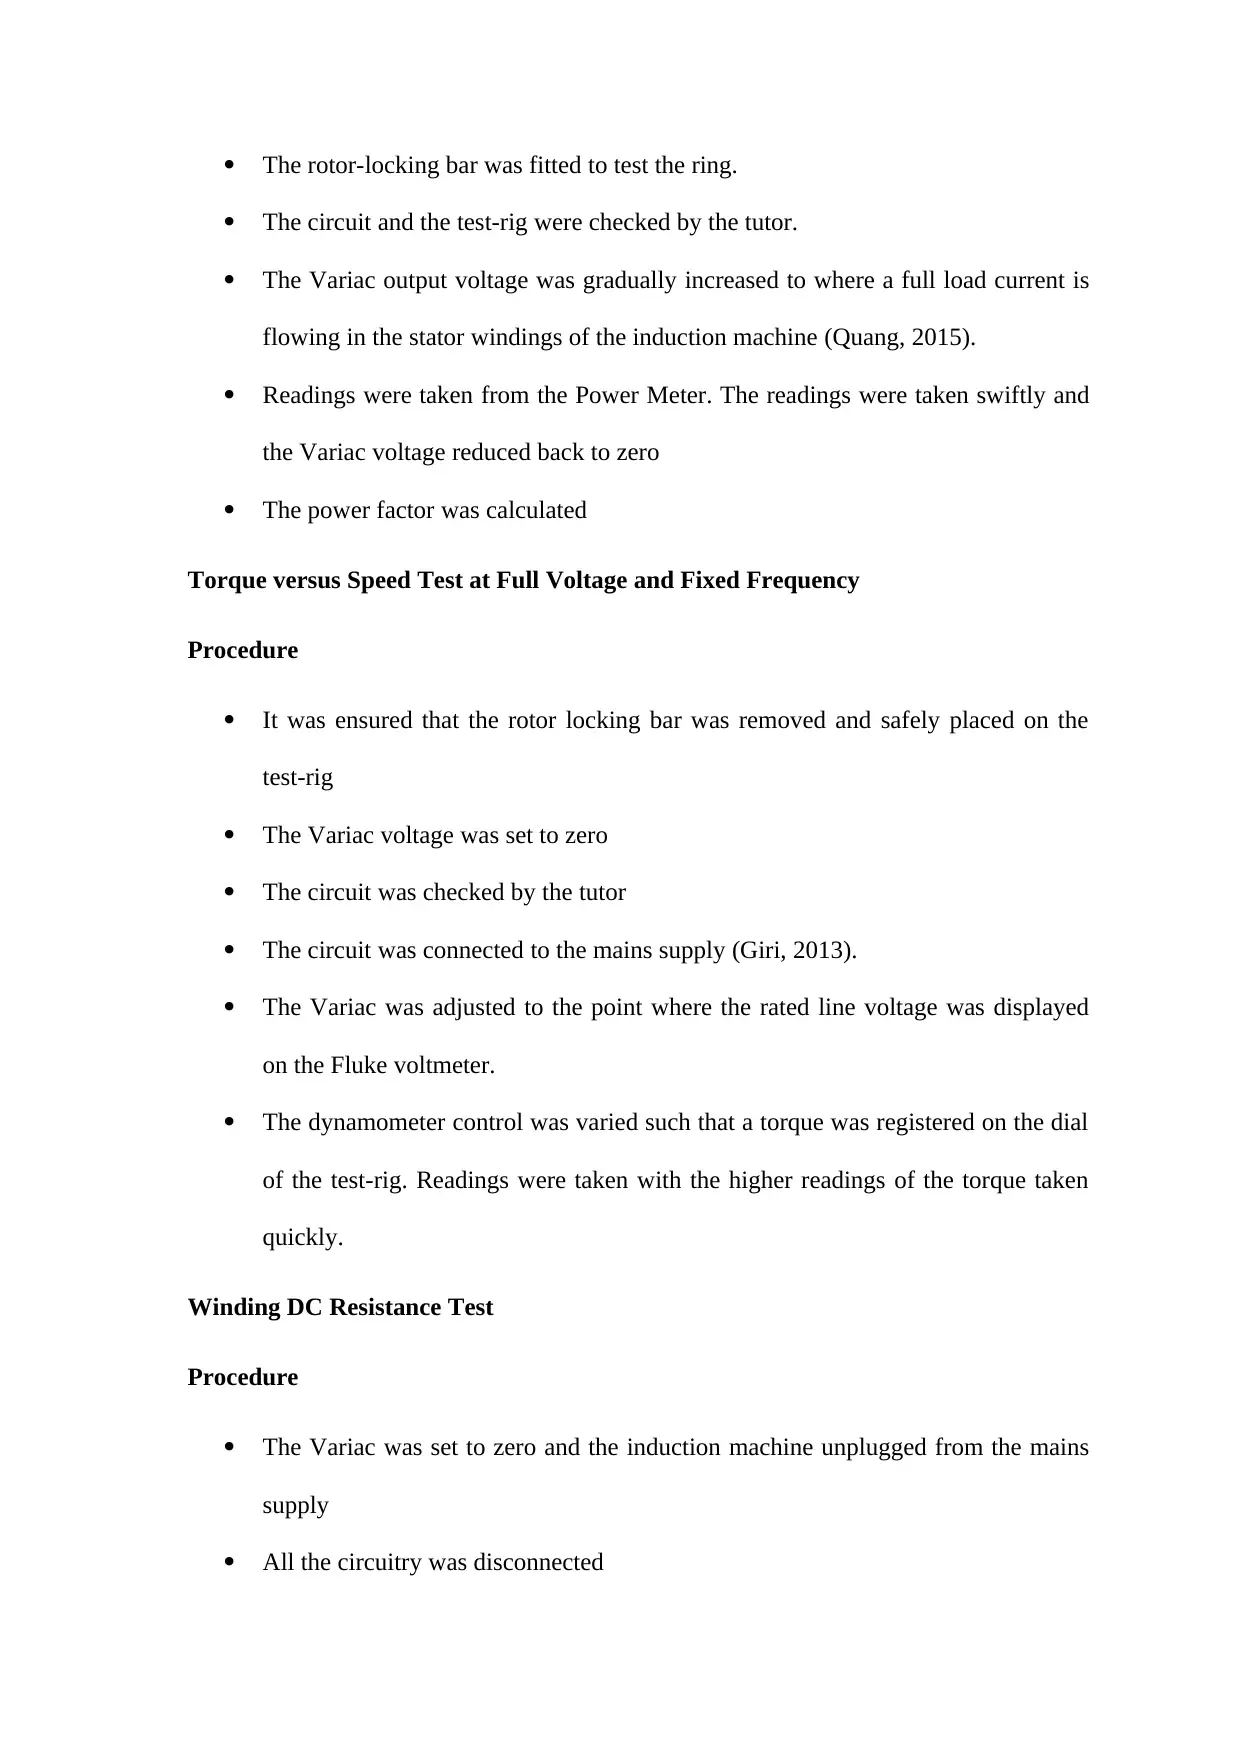
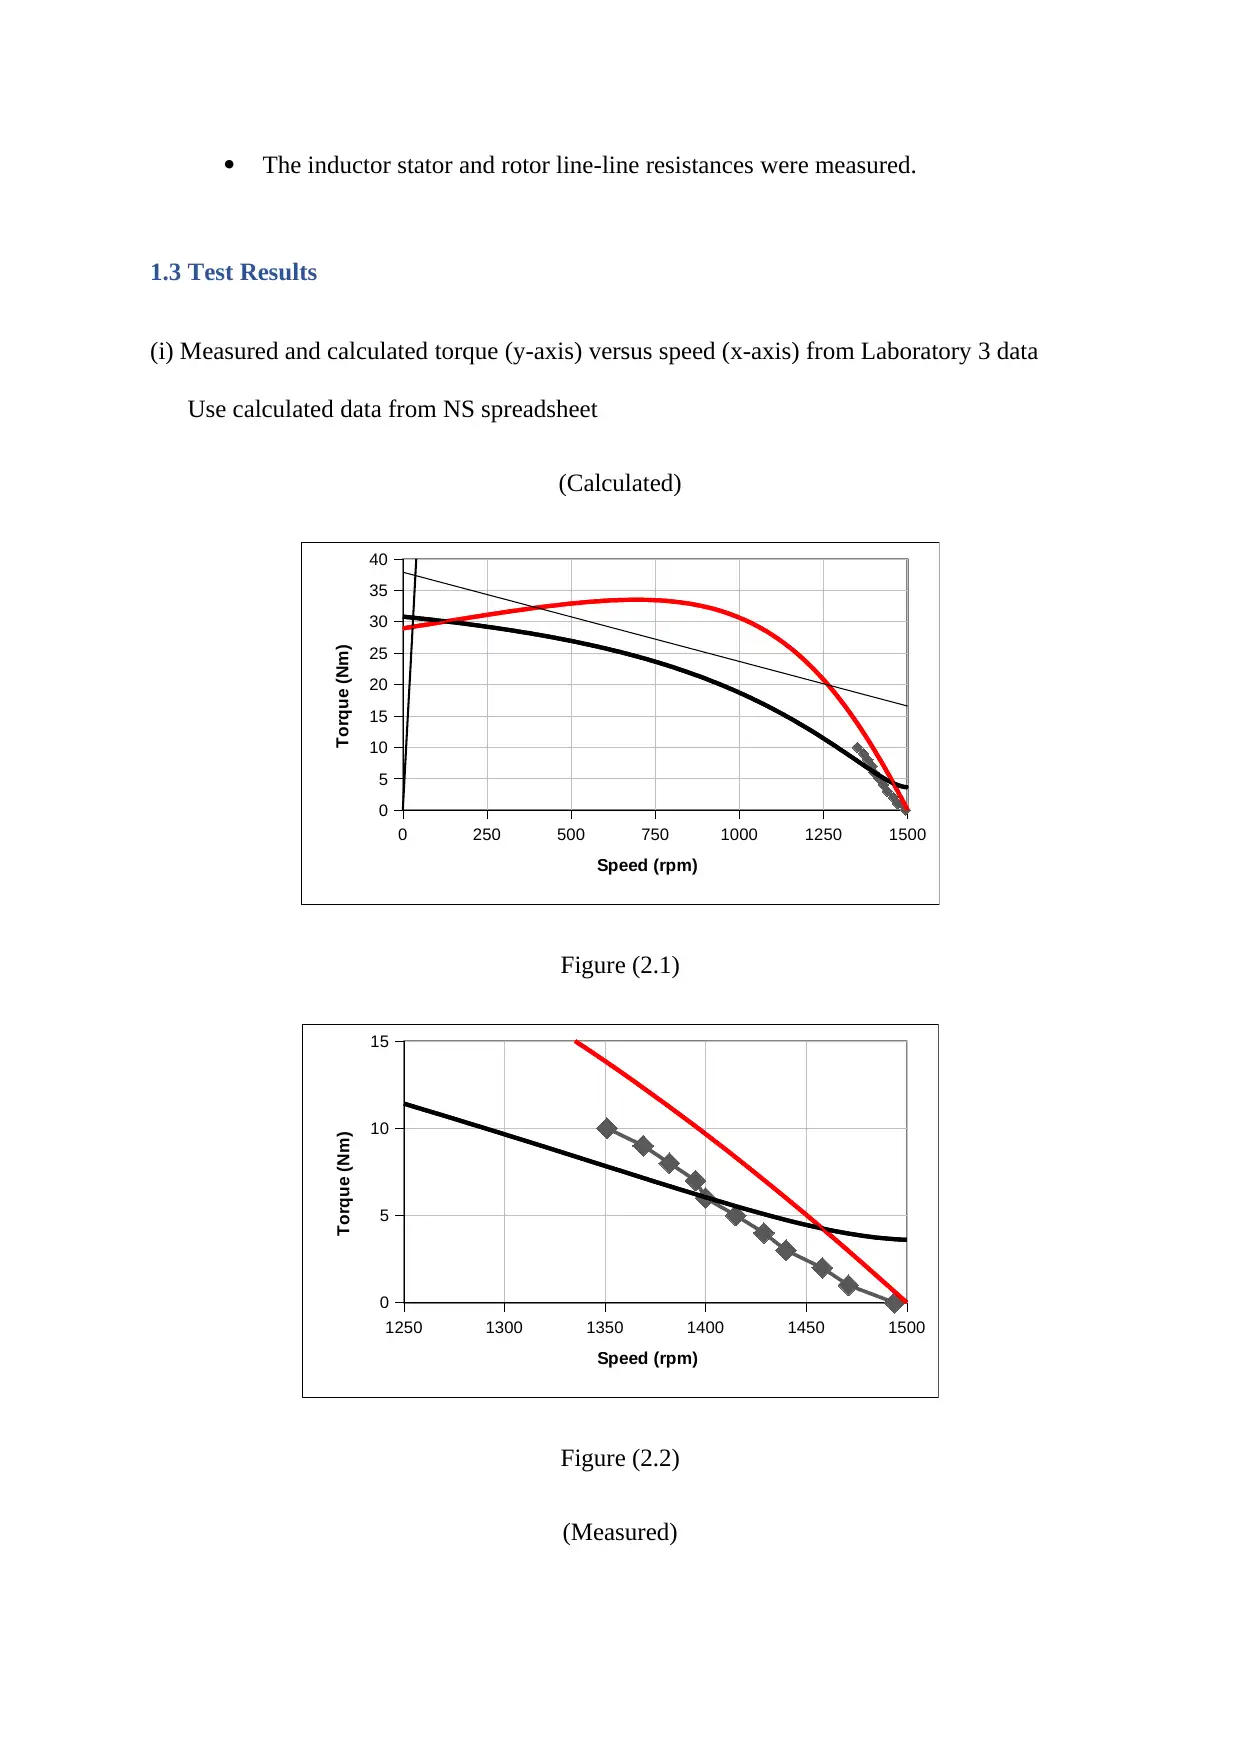
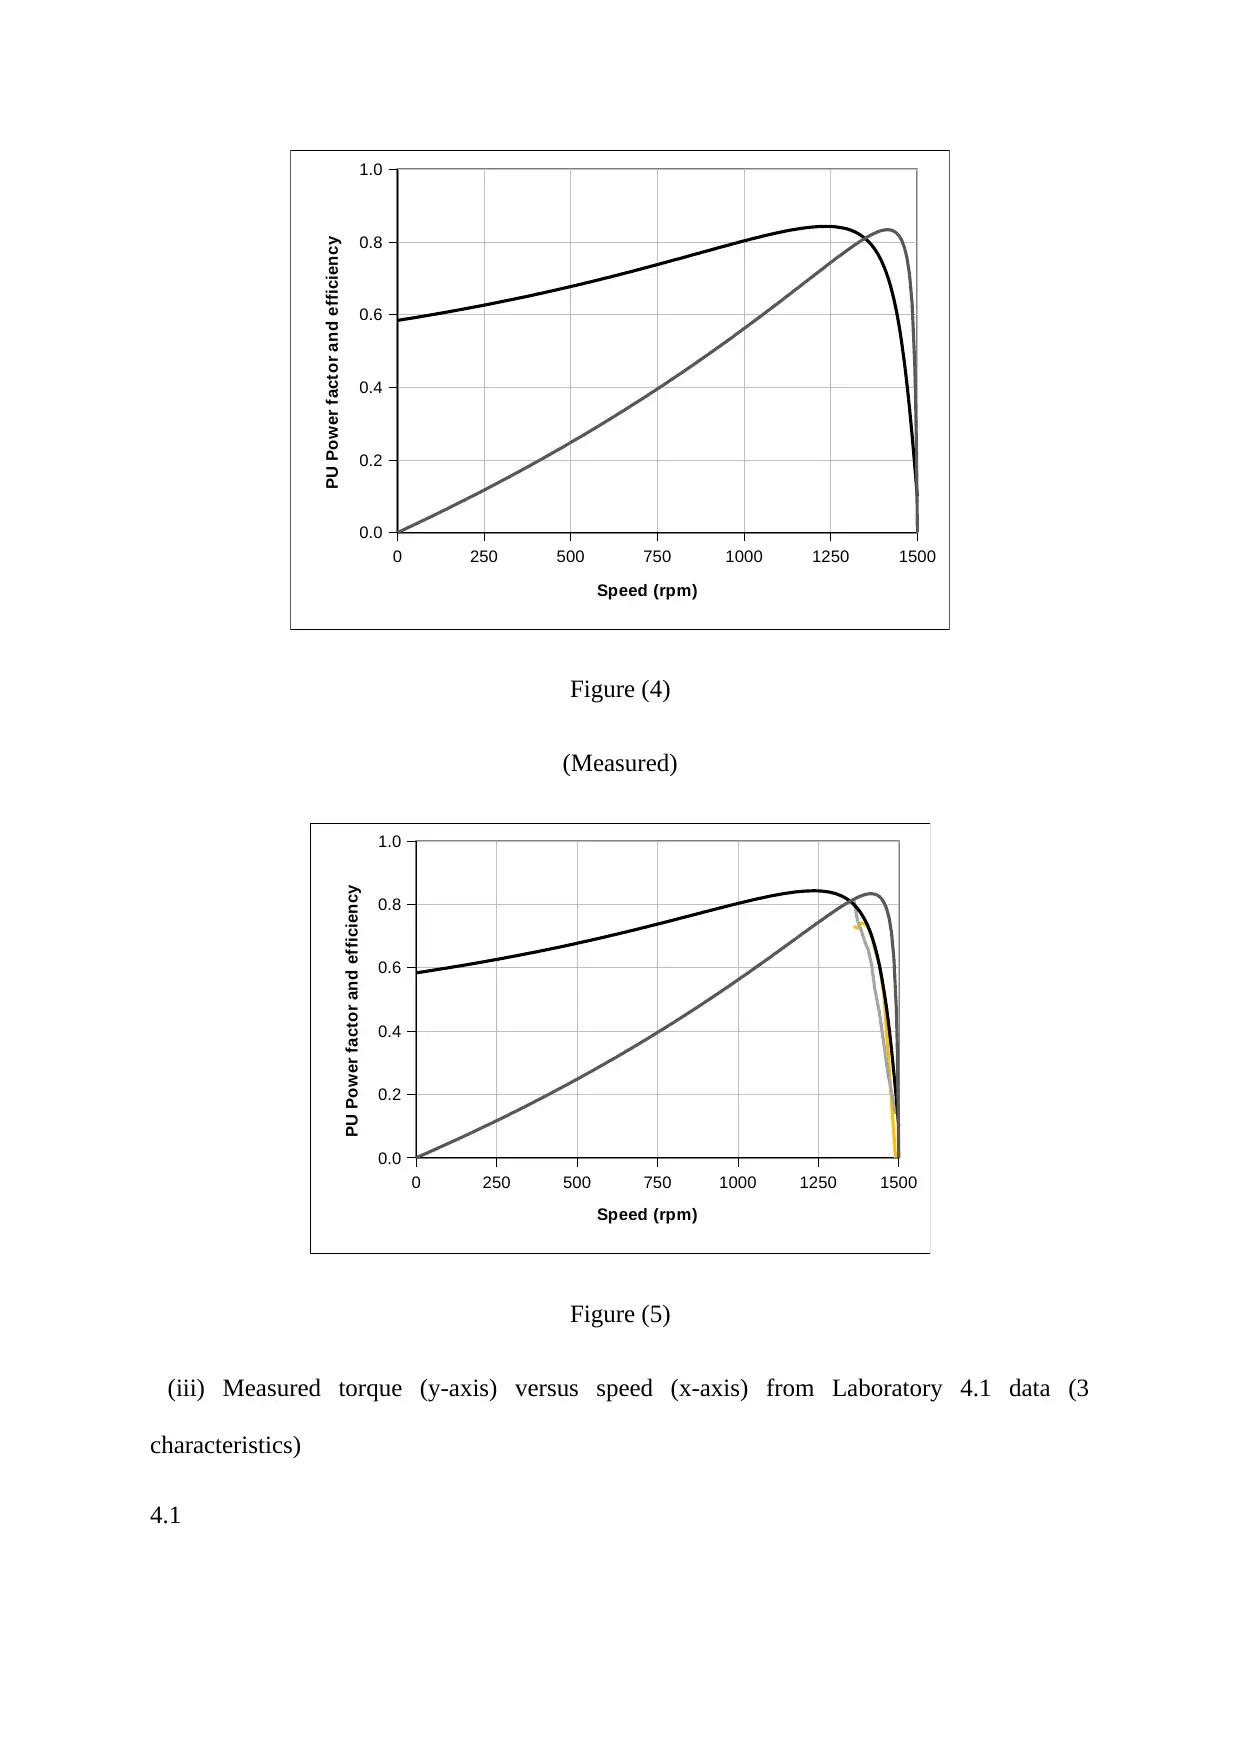
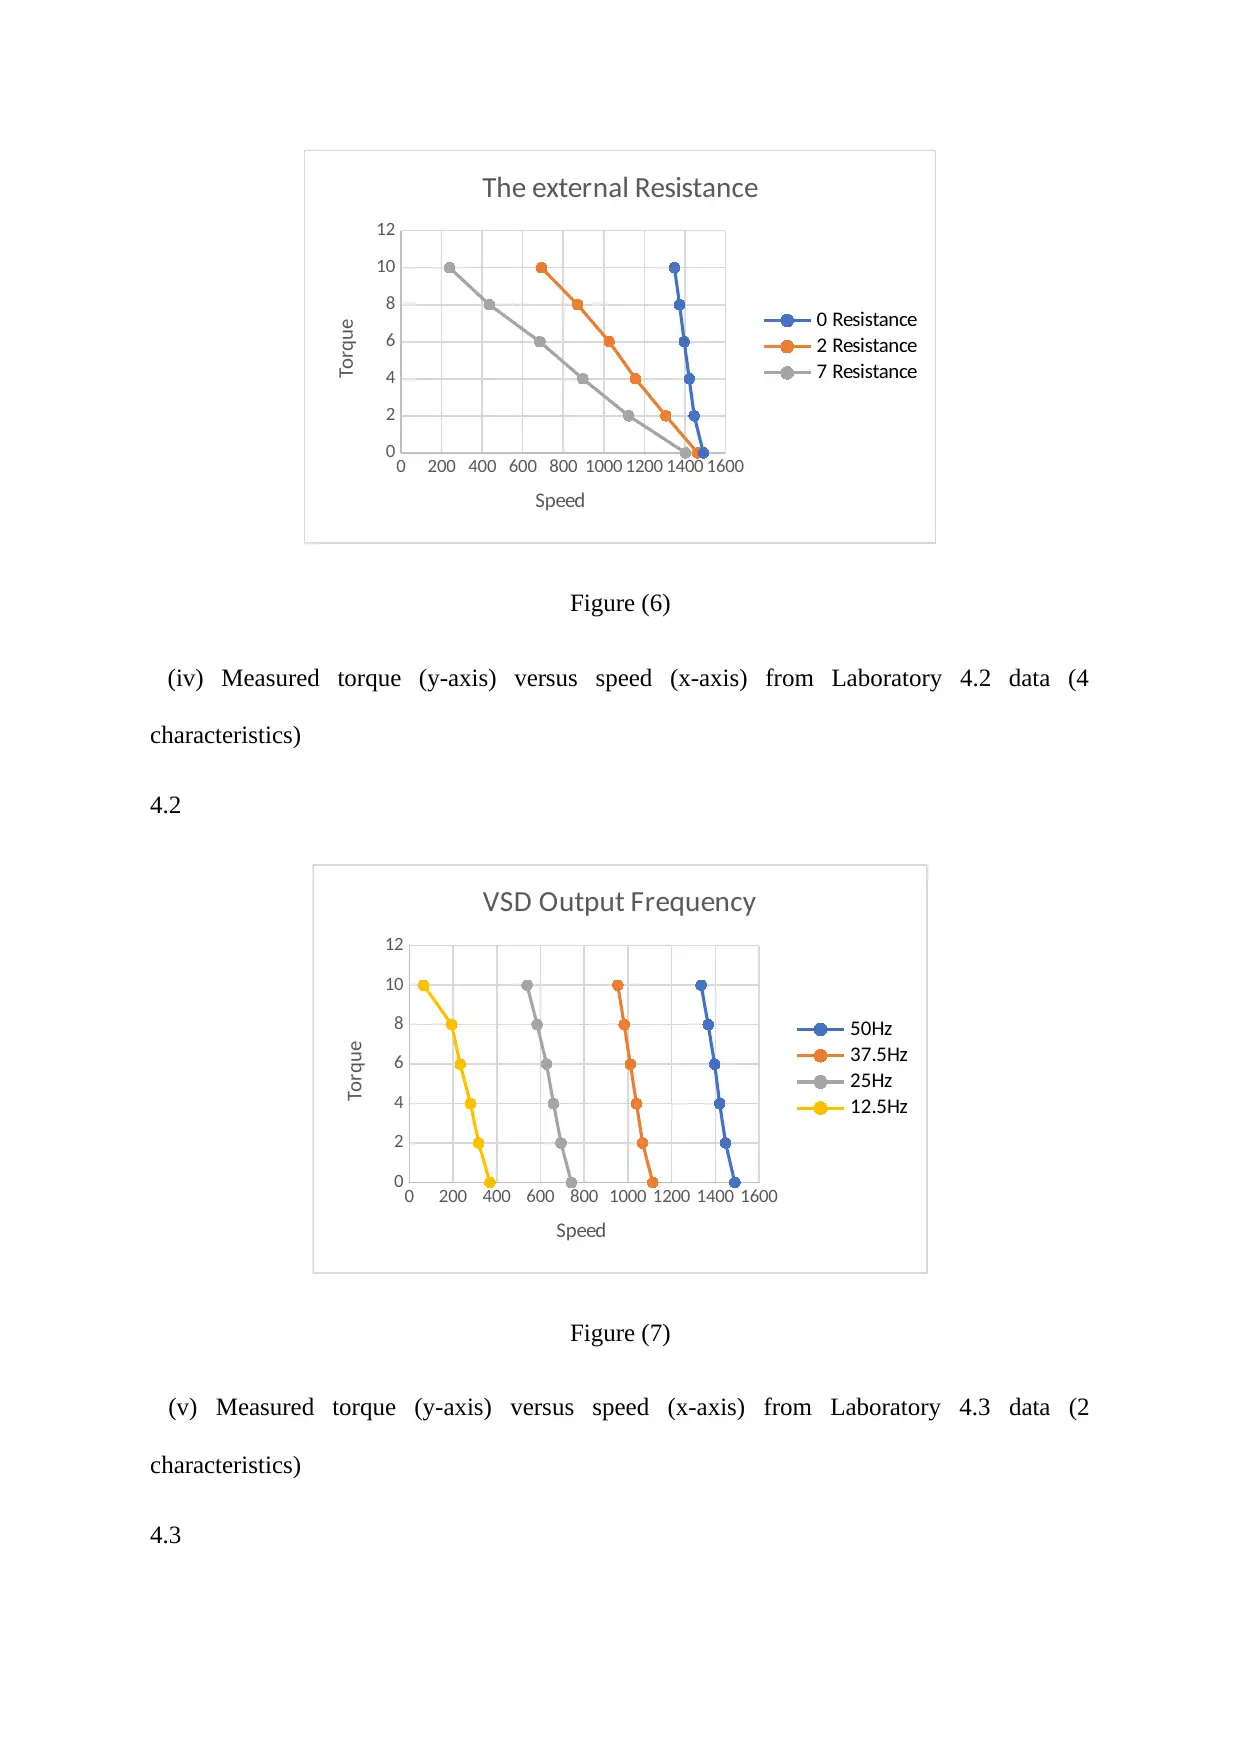
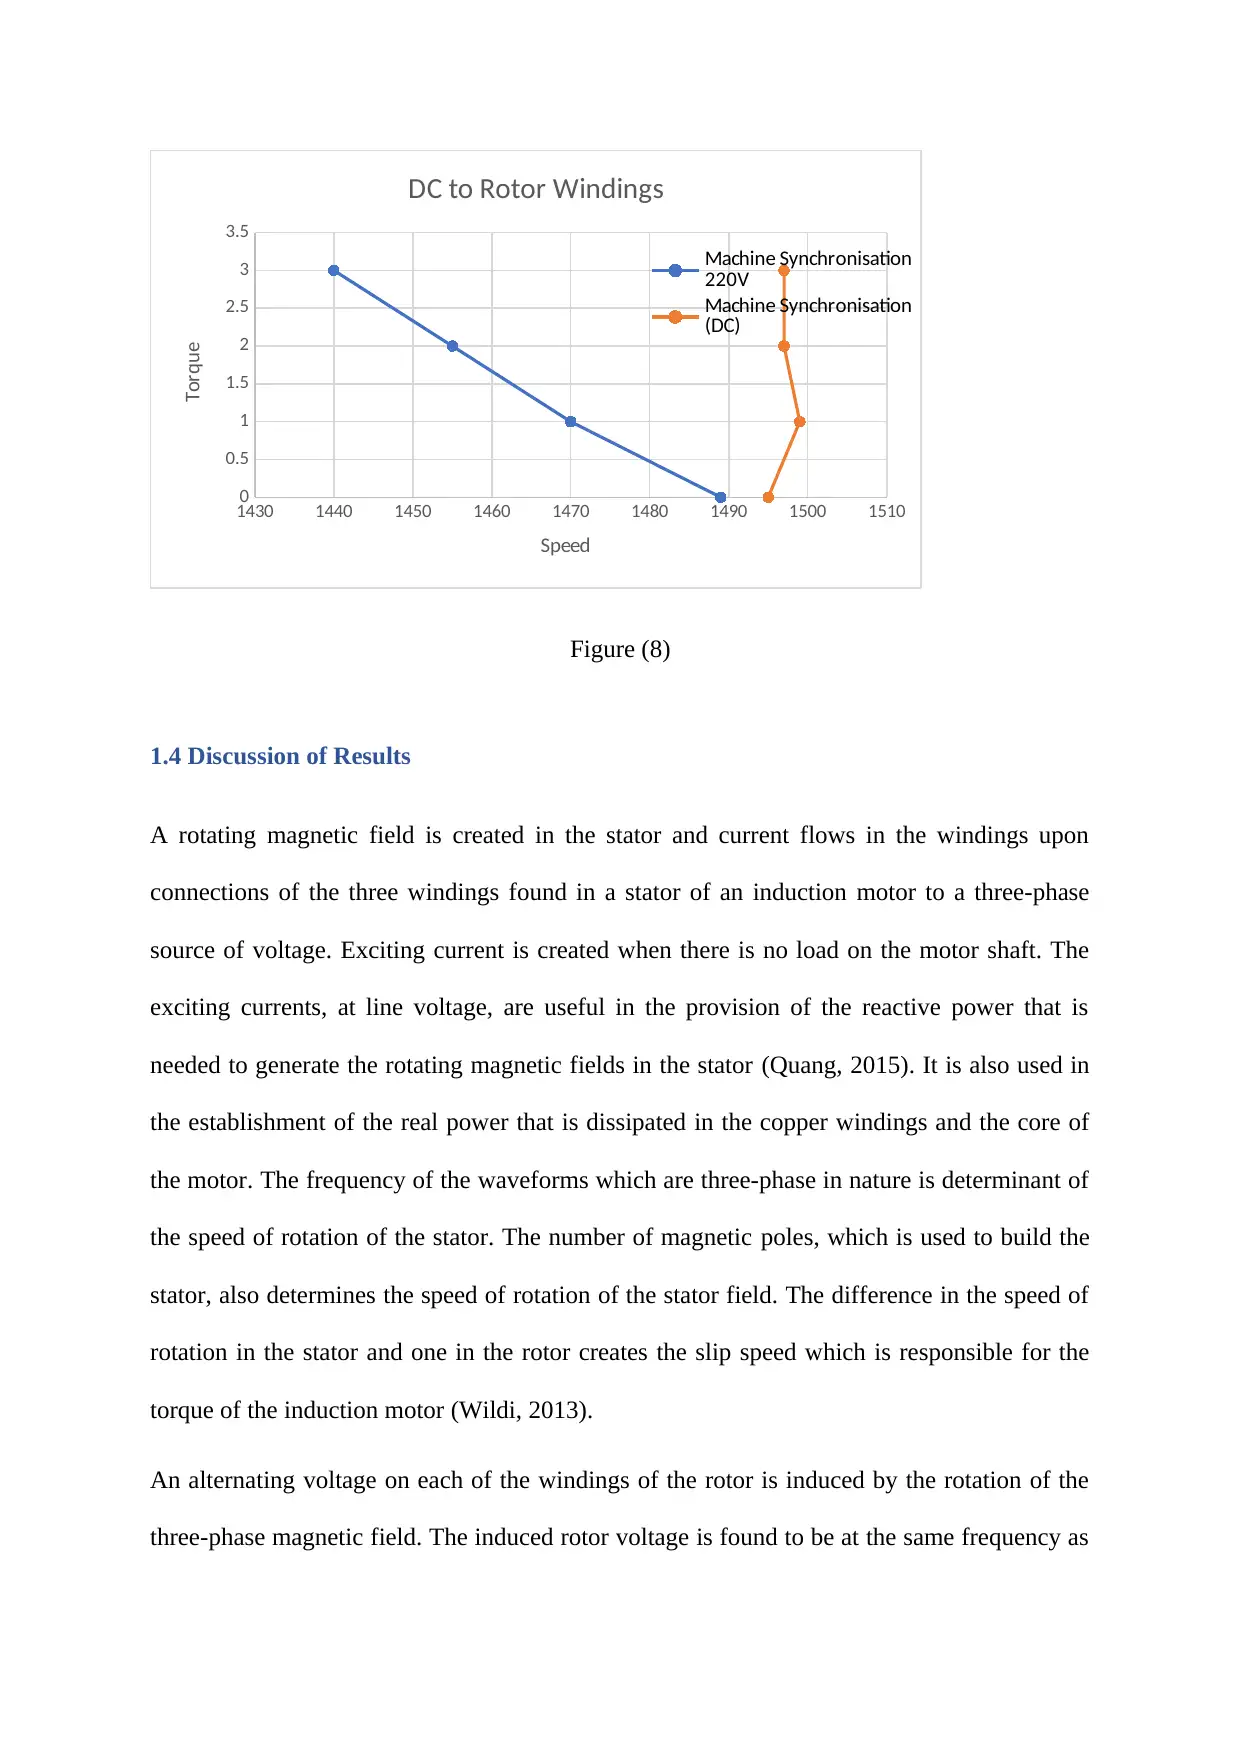
This report details the findings of laboratory experiments 3 and 4, conducted as part of the NHE2486 Electrical Power & Drive Systems course. The report investigates the characteristics of three-phase induction machines, focusing on parameter identification for the equivalent circuit and operational performance analysis. Laboratory 3 experiments included three-phase induction machine characterization, load tests, and torque-speed characteristics at full voltage and fixed frequency. Laboratory 4 experiments explored controlling torque-speed characteristics through external resistance and stator voltage supply, as well as synchronous machine behavior through DC current to the rotor. The report includes discussions of the tests, results, and conclusions, supported by figures illustrating torque-speed curves, power factor, and efficiency. The report also covers the equivalent circuit of an induction machine, the procedures for no-load and locked rotor tests, and the impact of slip on motor performance, providing insights into the practical application and behavior of induction motors.
Document Page
Report on Induction Machine Equivalent Circuit Parameter Identification and
Operational Performance
Laboratories 3 and 4
A report submitted as part completion of course NHE2486
Academic Year 2017-18
NHE2486: Electrical Power & Drive Systems
Student Name:
Student registration number:
tabler-icon-diamond-filled.svg

Paraphrase This Document

Need a fresh take? Get an instant paraphrase of this document with our AI Paraphraser
Document Page
Table of Contents
Table of Contents.......................................................................................................................2
1.1 Introduction..........................................................................................................................3
1.2 Discussion of Load Tests.....................................................................................................5
1.3 Test Results..........................................................................................................................7
1.4 Discussion of Results.........................................................................................................12
1.5 Conclusions........................................................................................................................14
1.6 References..........................................................................................................................15
1.7 Appendices.........................................................................................................................16
A1. Scan of Laboratory 3 Notes and Risk Assessment...........................................................16
A2. Scan of Laboratory 4 Notes and Risk Assessment...........................................................20
Document Page
1.1 Introduction
This lab session was carried out in two phases: laboratory 3 and 4. In laboratory 3, 2
experiments were conducted these are: three-phase induction machine characterization and
load test, while in laboratory 4 a three-phase induction machine operation experiment was
conducted. Laboratory experiment 3 aimed at determining two things; the electrical
parameters of a 3-phase wound rotor induction machine per equivalent circuit phase and to
test the torque of the induction machine versus the characteristics of the speed at full rated
voltage and fixed frequency. Three experiments are conducted in laboratory 4 and among
them two experiments that are to investigate further the performance capabilities of the
induction machine and one experiment that illustrates the similarity between synchronous and
induction machines. The three experiments in laboratory 4 are:
ï‚· Controlling the torque-speed characteristics of an induction machine through
externally connected resistance.
ï‚· Controlling the torque-speed characteristics of an induction machine through supply
of voltage to the stator of the induction machine.
ï‚· Supply of DC current to the rotor windings in order to synchronize the machine.
2. Induction Machine Per-phase, Approximate Equivalent Circuit
Induction machine per-phase, approximate equivalent diagram (Hughes, 2013)
Document Page
Figure (1)
Induction motors are usually asynchronous and the magnetic field of the stator rotate at the
asynchronous speed of the motor. It is never possible for the motor to rotate at a synchronous
speed otherwise; current will not be induced in the motor. The full speed of the rotor is
usually between 2 and 6% of the synchronous speed and the deviation between the real
asynchronous and synchronous speed is called the slip speed. The slip speed is the difference
between the actual speed of the rotor and the synchronous speed of the motors and can be
expressed either as a fraction or as a percentage (Pyrhonen, 2013).
Using the magnetic winding theory, the relationship between the number of poles, p,
frequency in the stator, f and the synchronous speed can be established using the expression;
f=nsp
The equation fr= (ns-nr) p is used in finding the frequency within the rotor which is the
difference between the frequency of the rotor and that of the stator. Combining the two
equations above;
fr =snsp=sf and the synchronous speed per second is given by ns=f/p
In the equivalent circuit diagram above, R1 - resistance of the stator winding while X1
represents the reactance of the leakage of the stator i.e. the flux that is that has no linkage
with the rotor and the air gap. Rc represents the core losses while Xm represents the
magnetising reactance that is required to cross the air gap in the circuit (Wildi, 2013).
In an ideal transformer having N1 and N2 turns respectively represents the air gap. The slip
affects the induced emf for the rotor side such that the slip reduces and less emf is induced as
the speed of the rotor increases. R2 and X2 represent the resistance and reactance of the rotor
tabler-icon-diamond-filled.svg

Paraphrase This Document

Need a fresh take? Get an instant paraphrase of this document with our AI Paraphraser
Document Page
respectively in which X2 is a dependent variable on the frequency of the emf of the inductor
(Giri, 2013).
1.2 Discussion of Load Tests
Induction Machine No-load Test
Procedure
ï‚· The test circuit was connected in such a way that the load impedance at the
transformer output set of variable resistances
ï‚· The tutor checked the circuit
ï‚· The Variac was voltage was set at zero
ï‚· The circuit was connected to the mains supply
ï‚· The induction machine nameplate was read so as to note the rated line voltage and the
machine rate voltage calculated (Herman, 2012).
ï‚· The Variac dial was turned up until the rated line was displayed on the Fluke
voltmeter
ï‚· In one phase of the machine supply is connected the Power Meter from which
readings are taken when the machine when the machine operates at fully voltage
supply and when on no-load
ï‚· The power factor was calculated.
ï‚· The Variac was set to zero volts and the mains supply unplugged.
Induction Machine Locked Rotor Test
Procedure
ï‚· The nameplate of the induction machine was read and the rated full load current
noted.
Document Page
ï‚· The rotor-locking bar was fitted to test the ring.
ï‚· The circuit and the test-rig were checked by the tutor.
ï‚· The Variac output voltage was gradually increased to where a full load current is
flowing in the stator windings of the induction machine (Quang, 2015).
ï‚· Readings were taken from the Power Meter. The readings were taken swiftly and
the Variac voltage reduced back to zero
ï‚· The power factor was calculated
Torque versus Speed Test at Full Voltage and Fixed Frequency
Procedure
ï‚· It was ensured that the rotor locking bar was removed and safely placed on the
test-rig
ï‚· The Variac voltage was set to zero
ï‚· The circuit was checked by the tutor
ï‚· The circuit was connected to the mains supply (Giri, 2013).
ï‚· The Variac was adjusted to the point where the rated line voltage was displayed
on the Fluke voltmeter.
ï‚· The dynamometer control was varied such that a torque was registered on the dial
of the test-rig. Readings were taken with the higher readings of the torque taken
quickly.
Winding DC Resistance Test
Procedure
ï‚· The Variac was set to zero and the induction machine unplugged from the mains
supply
ï‚· All the circuitry was disconnected
Document Page
ï‚· The inductor stator and rotor line-line resistances were measured.
1.3 Test Results
(i) Measured and calculated torque (y-axis) versus speed (x-axis) from Laboratory 3 data
Use calculated data from NS spreadsheet
(Calculated)
0 250 500 750 1000 1250 1500
0
5
10
15
20
25
30
35
40
Speed (rpm)
Torque (Nm)
Figure (2.1)
1250 1300 1350 1400 1450 1500
0
5
10
15
Speed (rpm)
Torque (Nm)
Figure (2.2)
(Measured)
tabler-icon-diamond-filled.svg

Paraphrase This Document

Need a fresh take? Get an instant paraphrase of this document with our AI Paraphraser
Document Page
0 250 500 750 1000 1250 1500
0
5
10
15
20
25
30
35
40
Speed (rpm)
Torque (Nm)
Figure (3.1)
1250 1300 1350 1400 1450 1500
0
5
10
15
Speed (rpm)
Torque (Nm)
Figure (3.2)
(ii) Measured and calculated per unit power factor and efficiency (y-axis) versus speed (x-
axis)
from Laboratory 3 data. Use calculated data from NS spreadsheet.
(Calculated)
Document Page
0 250 500 750 1000 1250 1500
0.0
0.2
0.4
0.6
0.8
1.0
Speed (rpm)
PU Power factor and efficiency
Figure (4)
(Measured)
0 250 500 750 1000 1250 1500
0.0
0.2
0.4
0.6
0.8
1.0
Speed (rpm)
PU Power factor and efficiency
Figure (5)
(iii) Measured torque (y-axis) versus speed (x-axis) from Laboratory 4.1 data (3
characteristics)
4.1
Document Page
0 200 400 600 800 1000 1200 1400 1600
0
2
4
6
8
10
12
The external Resistance
0 Resistance
2 Resistance
7 Resistance
Speed
Torque
Figure (6)
(iv) Measured torque (y-axis) versus speed (x-axis) from Laboratory 4.2 data (4
characteristics)
4.2
0 200 400 600 800 1000 1200 1400 1600
0
2
4
6
8
10
12
VSD Output Frequency
50Hz
37.5Hz
25Hz
12.5Hz
Speed
Torque
Figure (7)
(v) Measured torque (y-axis) versus speed (x-axis) from Laboratory 4.3 data (2
characteristics)
4.3
tabler-icon-diamond-filled.svg

Paraphrase This Document

Need a fresh take? Get an instant paraphrase of this document with our AI Paraphraser
Document Page
1430 1440 1450 1460 1470 1480 1490 1500 1510
0
0.5
1
1.5
2
2.5
3
3.5
DC to Rotor Windings
Machine Synchronisation
220V
Machine Synchronisation
(DC)
Speed
Torque
Figure (8)
1.4 Discussion of Results
A rotating magnetic field is created in the stator and current flows in the windings upon
connections of the three windings found in a stator of an induction motor to a three-phase
source of voltage. Exciting current is created when there is no load on the motor shaft. The
exciting currents, at line voltage, are useful in the provision of the reactive power that is
needed to generate the rotating magnetic fields in the stator (Quang, 2015). It is also used in
the establishment of the real power that is dissipated in the copper windings and the core of
the motor. The frequency of the waveforms which are three-phase in nature is determinant of
the speed of rotation of the stator. The number of magnetic poles, which is used to build the
stator, also determines the speed of rotation of the stator field. The difference in the speed of
rotation in the stator and one in the rotor creates the slip speed which is responsible for the
torque of the induction motor (Wildi, 2013).
An alternating voltage on each of the windings of the rotor is induced by the rotation of the
three-phase magnetic field. The induced rotor voltage is found to be at the same frequency as
Document Page
the source voltage and the rate of cutting the lines of flux of the magnetic field equal to the
synchronous speed when the rotor is not turning. The rate of cutting the lines of flux decrease
as the rotor turns in the same direction as the rotating magnetic stator field. This leads to
lowered magnitude and frequency of the induced voltages in the rotor windings (Giri, 2013).
This results into 0% slip. At 0% slip, the torque generated by the motor as well drops to zero
and thus it is not practically possible to for an induction motor to attain a synchronous speed.
On the other hand, when the motor is rotating in the opposite direction as the rotating
magnetic stator filed, at a synchronous frequency, double the magnitude and frequency of the
induced voltages is produced in comparison to 100% slip condition at no load (Herman,
2012). When the shaft is motor is mechanically loaded the speed will slow down as the
revolving fields will cut at a higher rate resulting in an increase in induced voltage thus a
higher current and therefore a greater torque this will continue to a state of equilibrium as
seen the results where the mechanical torque is equal to the load toque (Pyrhonen, 2013).
When this state is archived the machine ceases to drop in speed and runs at a constant state at
almost a synchronous speed. This only happens at a full load state.
1.5 Conclusions
In conclusion, a three-phase induction motor can establish very high levels of efficiency and
thus providing a good balance among its various properties. The balance is ideal in using the
induction motor in various applications. This is mostly true when comparison is made
between three-phase induction motor and a single-phase induction motor. The results
obtained from the two experiments indicate the close proximity between the theoretical
characteristics and the actual properties exhibited by an actual three-phase motor. The
laboratories gave an insight into getting into practical touch with the various characteristics of
three-phase induction motors among the load tests. The achieved level of accuracy in the
chevron_up_icon
1 out of 25
circle_padding
hide_on_mobile
zoom_out_icon
[object Object]