Equipment Downtime Analysis Report - Industrial Facility
VerifiedAdded on  2022/10/17
|4
|1007
|407
Report
AI Summary
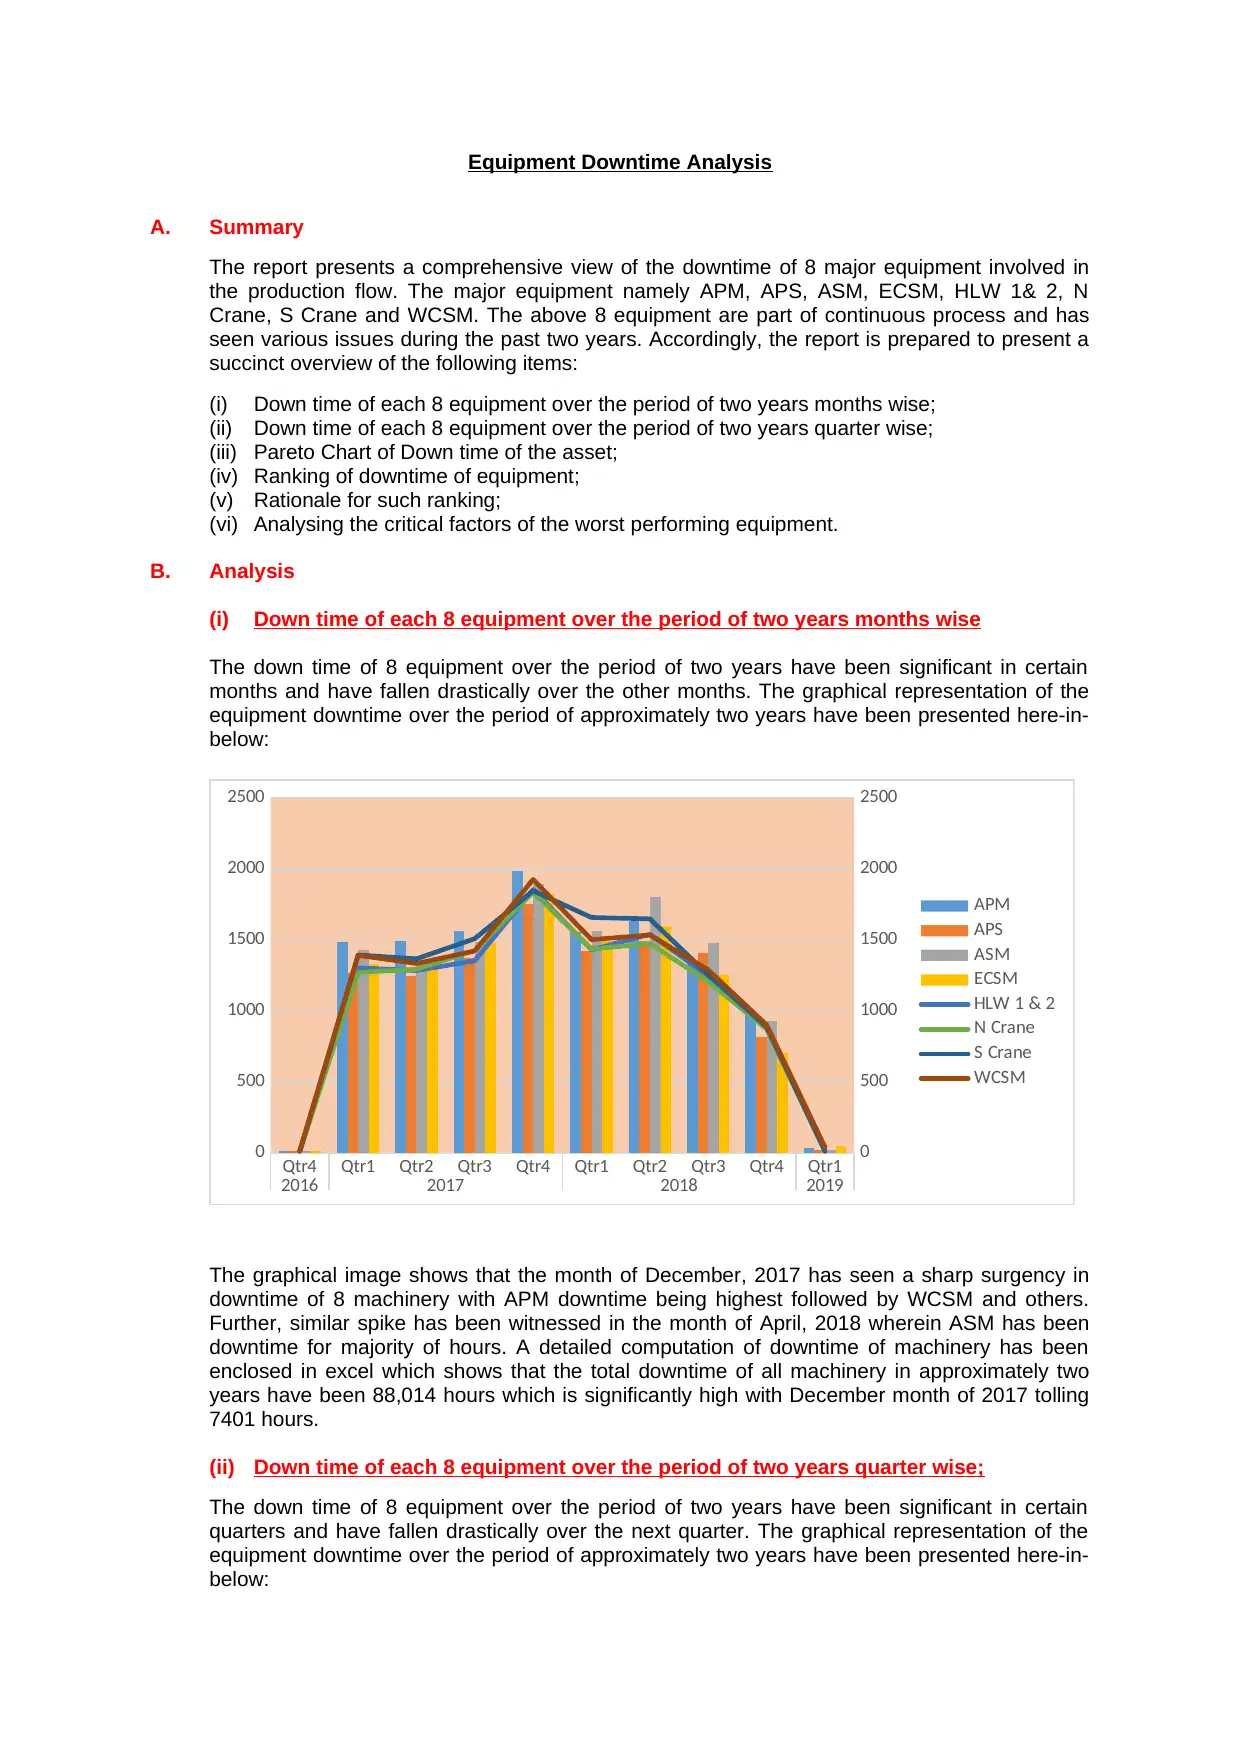
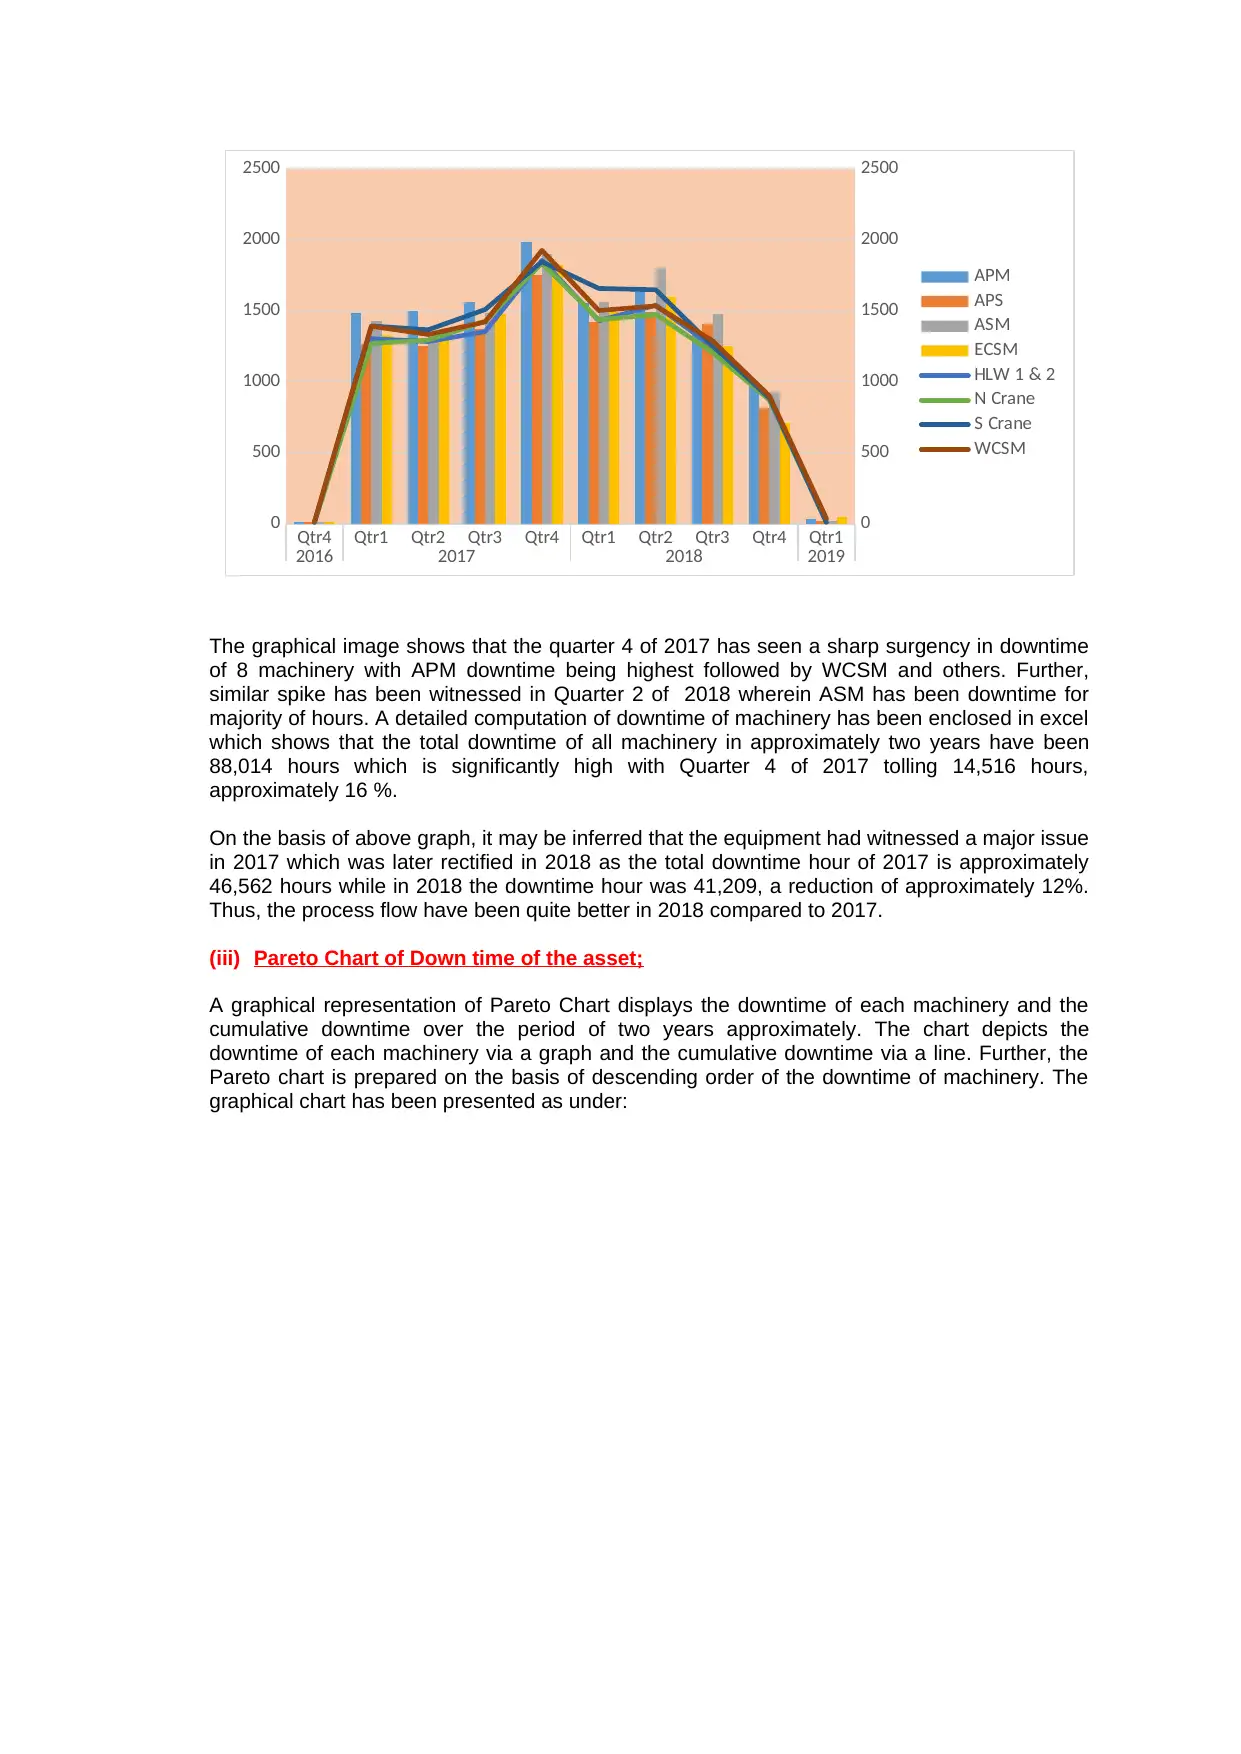
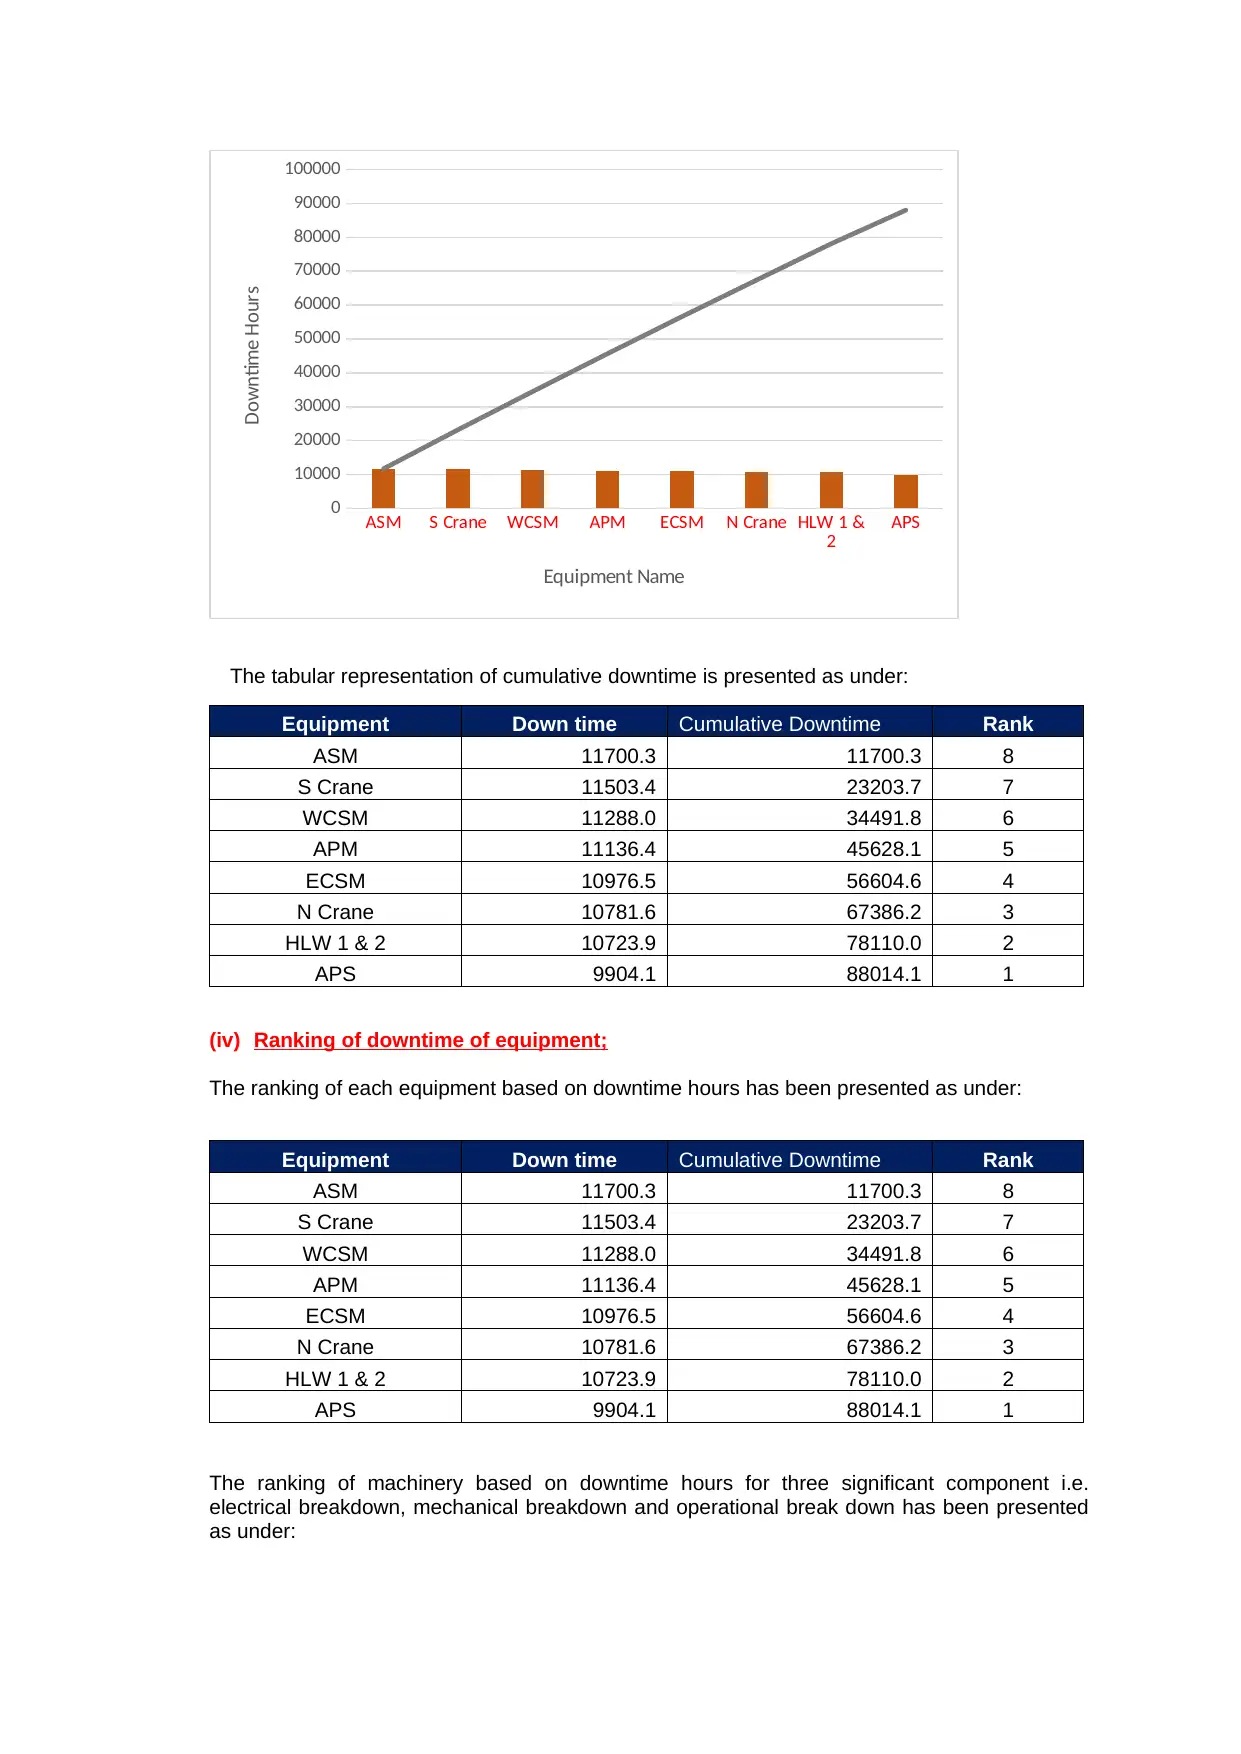
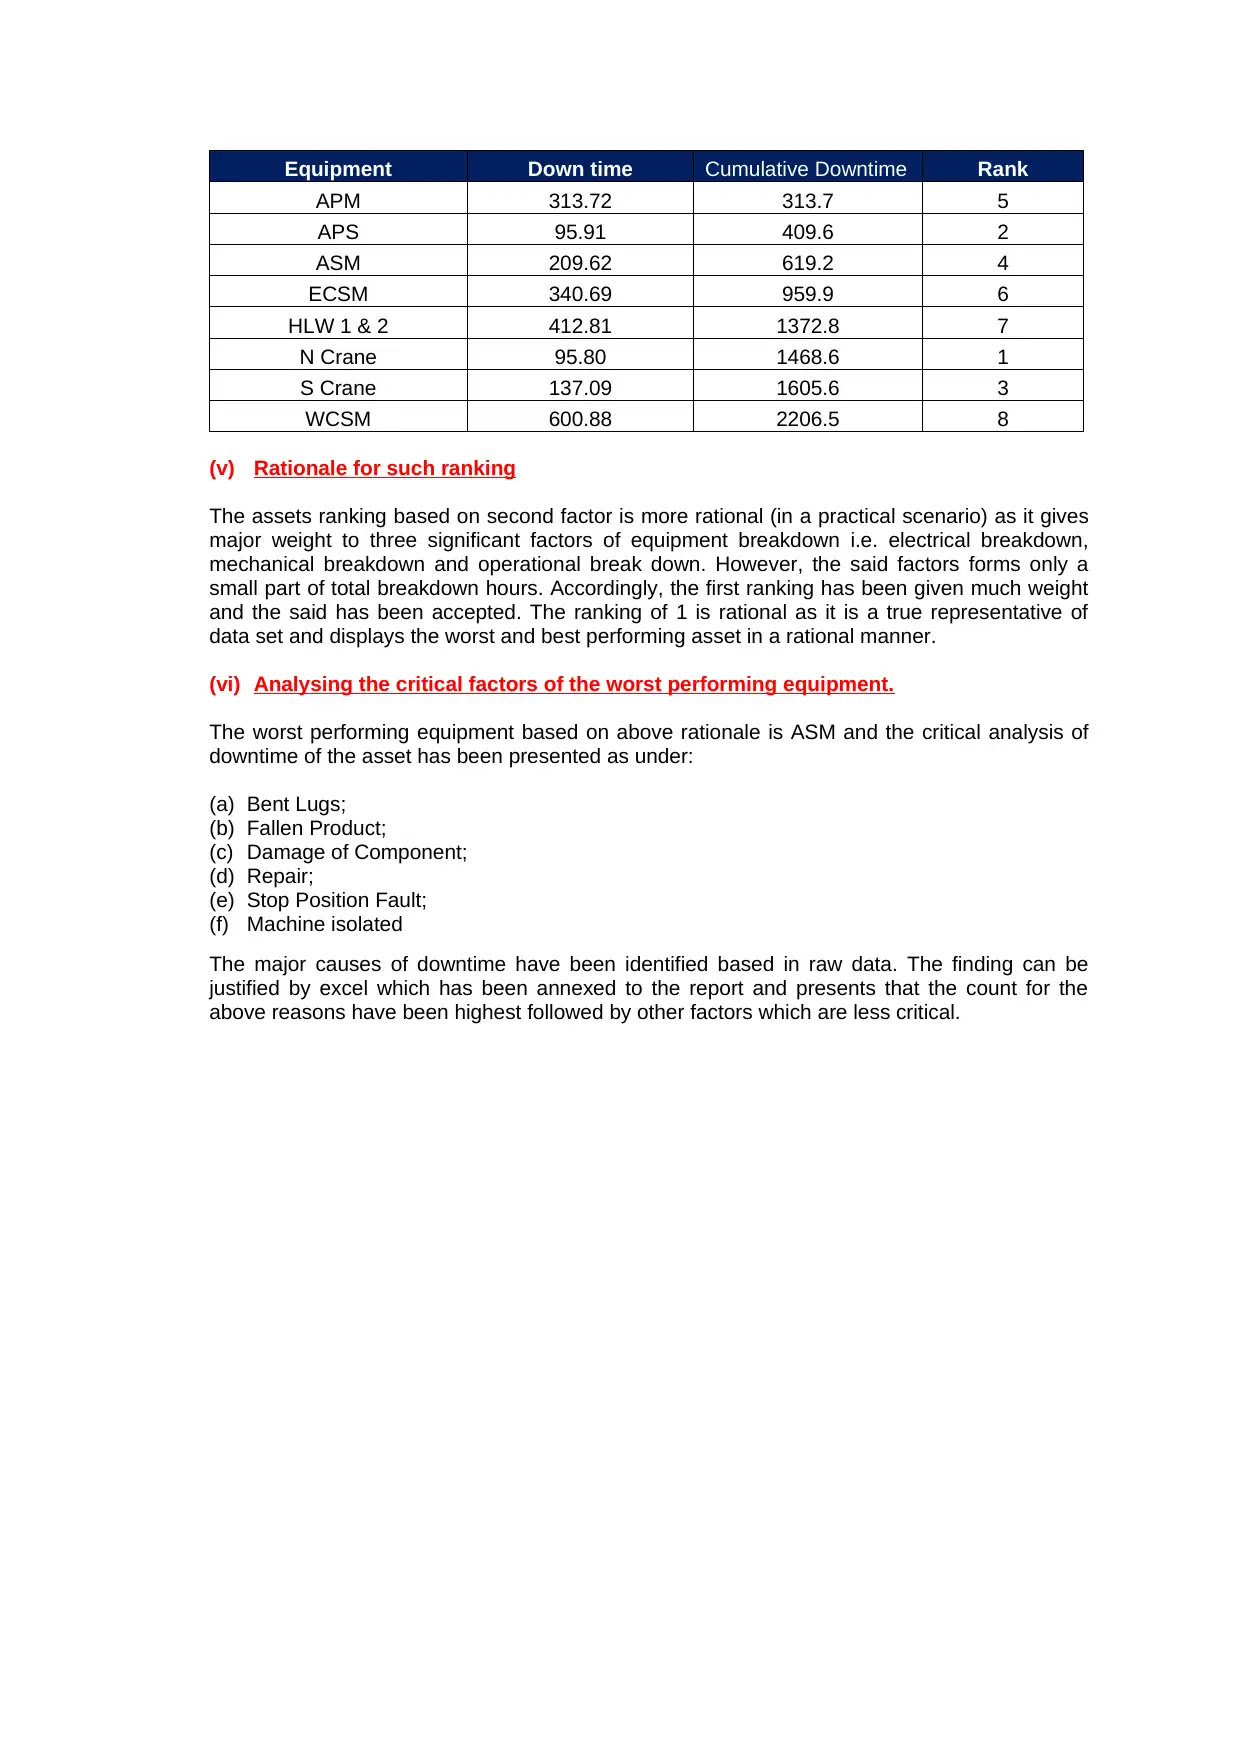
This report presents a comprehensive analysis of equipment downtime across eight major pieces of machinery in an industrial facility over a two-year period. The analysis includes monthly and quarterly downtime trends, visualized through graphs. A Pareto chart is generated to identify the most significant downtime contributors. Equipment is ranked based on downtime hours, with justifications provided for the ranking methodology. The report then focuses on the worst-performing equipment, ASM, and analyzes the critical factors contributing to its downtime, such as bent lugs, product damage, and component failures. The findings are supported by data and presented in a professional report format, including tables and charts, with the goal of identifying areas for improvement and optimizing equipment performance. The report also includes excel data for detailed computations.

Equipment Downtime Analysis
A. Summary
The report presents a comprehensive view of the downtime of 8 major equipment involved in
the production flow. The major equipment namely APM, APS, ASM, ECSM, HLW 1& 2, N
Crane, S Crane and WCSM. The above 8 equipment are part of continuous process and has
seen various issues during the past two years. Accordingly, the report is prepared to present a
succinct overview of the following items:
(i) Down time of each 8 equipment over the period of two years months wise;
(ii) Down time of each 8 equipment over the period of two years quarter wise;
(iii) Pareto Chart of Down time of the asset;
(iv) Ranking of downtime of equipment;
(v) Rationale for such ranking;
(vi) Analysing the critical factors of the worst performing equipment.
B. Analysis
(i) Down time of each 8 equipment over the period of two years months wise
The down time of 8 equipment over the period of two years have been significant in certain
months and have fallen drastically over the other months. The graphical representation of the
equipment downtime over the period of approximately two years have been presented here-in-
below:
Qtr4 Qtr1 Qtr2 Qtr3 Qtr4 Qtr1 Qtr2 Qtr3 Qtr4 Qtr1
2016 2017 2018 2019
0
500
1000
1500
2000
2500
0
500
1000
1500
2000
2500
APM
APS
ASM
ECSM
HLW 1 & 2
N Crane
S Crane
WCSM
The graphical image shows that the month of December, 2017 has seen a sharp surgency in
downtime of 8 machinery with APM downtime being highest followed by WCSM and others.
Further, similar spike has been witnessed in the month of April, 2018 wherein ASM has been
downtime for majority of hours. A detailed computation of downtime of machinery has been
enclosed in excel which shows that the total downtime of all machinery in approximately two
years have been 88,014 hours which is significantly high with December month of 2017 tolling
7401 hours.
(ii) Down time of each 8 equipment over the period of two years quarter wise;
The down time of 8 equipment over the period of two years have been significant in certain
quarters and have fallen drastically over the next quarter. The graphical representation of the
equipment downtime over the period of approximately two years have been presented here-in-
below:
Paraphrase This Document
Need a fresh take? Get an instant paraphrase of this document with our AI Paraphraser

Qtr4 Qtr1 Qtr2 Qtr3 Qtr4 Qtr1 Qtr2 Qtr3 Qtr4 Qtr1
2016 2017 2018 2019
0
500
1000
1500
2000
2500
0
500
1000
1500
2000
2500
APM
APS
ASM
ECSM
HLW 1 & 2
N Crane
S Crane
WCSM
The graphical image shows that the quarter 4 of 2017 has seen a sharp surgency in downtime
of 8 machinery with APM downtime being highest followed by WCSM and others. Further,
similar spike has been witnessed in Quarter 2 of 2018 wherein ASM has been downtime for
majority of hours. A detailed computation of downtime of machinery has been enclosed in excel
which shows that the total downtime of all machinery in approximately two years have been
88,014 hours which is significantly high with Quarter 4 of 2017 tolling 14,516 hours,
approximately 16 %.
On the basis of above graph, it may be inferred that the equipment had witnessed a major issue
in 2017 which was later rectified in 2018 as the total downtime hour of 2017 is approximately
46,562 hours while in 2018 the downtime hour was 41,209, a reduction of approximately 12%.
Thus, the process flow have been quite better in 2018 compared to 2017.
(iii) Pareto Chart of Down time of the asset;
A graphical representation of Pareto Chart displays the downtime of each machinery and the
cumulative downtime over the period of two years approximately. The chart depicts the
downtime of each machinery via a graph and the cumulative downtime via a line. Further, the
Pareto chart is prepared on the basis of descending order of the downtime of machinery. The
graphical chart has been presented as under:

ASM S Crane WCSM APM ECSM N Crane HLW 1 &
2 APS
0
10000
20000
30000
40000
50000
60000
70000
80000
90000
100000
Equipment Name
Downtime Hours
The tabular representation of cumulative downtime is presented as under:
Equipment Down time Cumulative Downtime Rank
ASM 11700.3 11700.3 8
S Crane 11503.4 23203.7 7
WCSM 11288.0 34491.8 6
APM 11136.4 45628.1 5
ECSM 10976.5 56604.6 4
N Crane 10781.6 67386.2 3
HLW 1 & 2 10723.9 78110.0 2
APS 9904.1 88014.1 1
(iv) Ranking of downtime of equipment;
The ranking of each equipment based on downtime hours has been presented as under:
Equipment Down time Cumulative Downtime Rank
ASM 11700.3 11700.3 8
S Crane 11503.4 23203.7 7
WCSM 11288.0 34491.8 6
APM 11136.4 45628.1 5
ECSM 10976.5 56604.6 4
N Crane 10781.6 67386.2 3
HLW 1 & 2 10723.9 78110.0 2
APS 9904.1 88014.1 1
The ranking of machinery based on downtime hours for three significant component i.e.
electrical breakdown, mechanical breakdown and operational break down has been presented
as under:
⊘ This is a preview!⊘
Do you want full access?
Subscribe today to unlock all pages.

Trusted by 1+ million students worldwide

Equipment Down time Cumulative Downtime Rank
APM 313.72 313.7 5
APS 95.91 409.6 2
ASM 209.62 619.2 4
ECSM 340.69 959.9 6
HLW 1 & 2 412.81 1372.8 7
N Crane 95.80 1468.6 1
S Crane 137.09 1605.6 3
WCSM 600.88 2206.5 8
(v) Rationale for such ranking
The assets ranking based on second factor is more rational (in a practical scenario) as it gives
major weight to three significant factors of equipment breakdown i.e. electrical breakdown,
mechanical breakdown and operational break down. However, the said factors forms only a
small part of total breakdown hours. Accordingly, the first ranking has been given much weight
and the said has been accepted. The ranking of 1 is rational as it is a true representative of
data set and displays the worst and best performing asset in a rational manner.
(vi) Analysing the critical factors of the worst performing equipment.
The worst performing equipment based on above rationale is ASM and the critical analysis of
downtime of the asset has been presented as under:
(a) Bent Lugs;
(b) Fallen Product;
(c) Damage of Component;
(d) Repair;
(e) Stop Position Fault;
(f) Machine isolated
The major causes of downtime have been identified based in raw data. The finding can be
justified by excel which has been annexed to the report and presents that the count for the
above reasons have been highest followed by other factors which are less critical.
1 out of 4
Related Documents
Your All-in-One AI-Powered Toolkit for Academic Success.
 +13062052269
info@desklib.com
Available 24*7 on WhatsApp / Email
Unlock your academic potential
Copyright © 2020–2025 A2Z Services. All Rights Reserved. Developed and managed by ZUCOL.


