ICT321 Report: Analyzing GE's Industrial Internet System Architecture
VerifiedAdded on 2020/05/28
|16
|3247
|76
Report
AI Summary
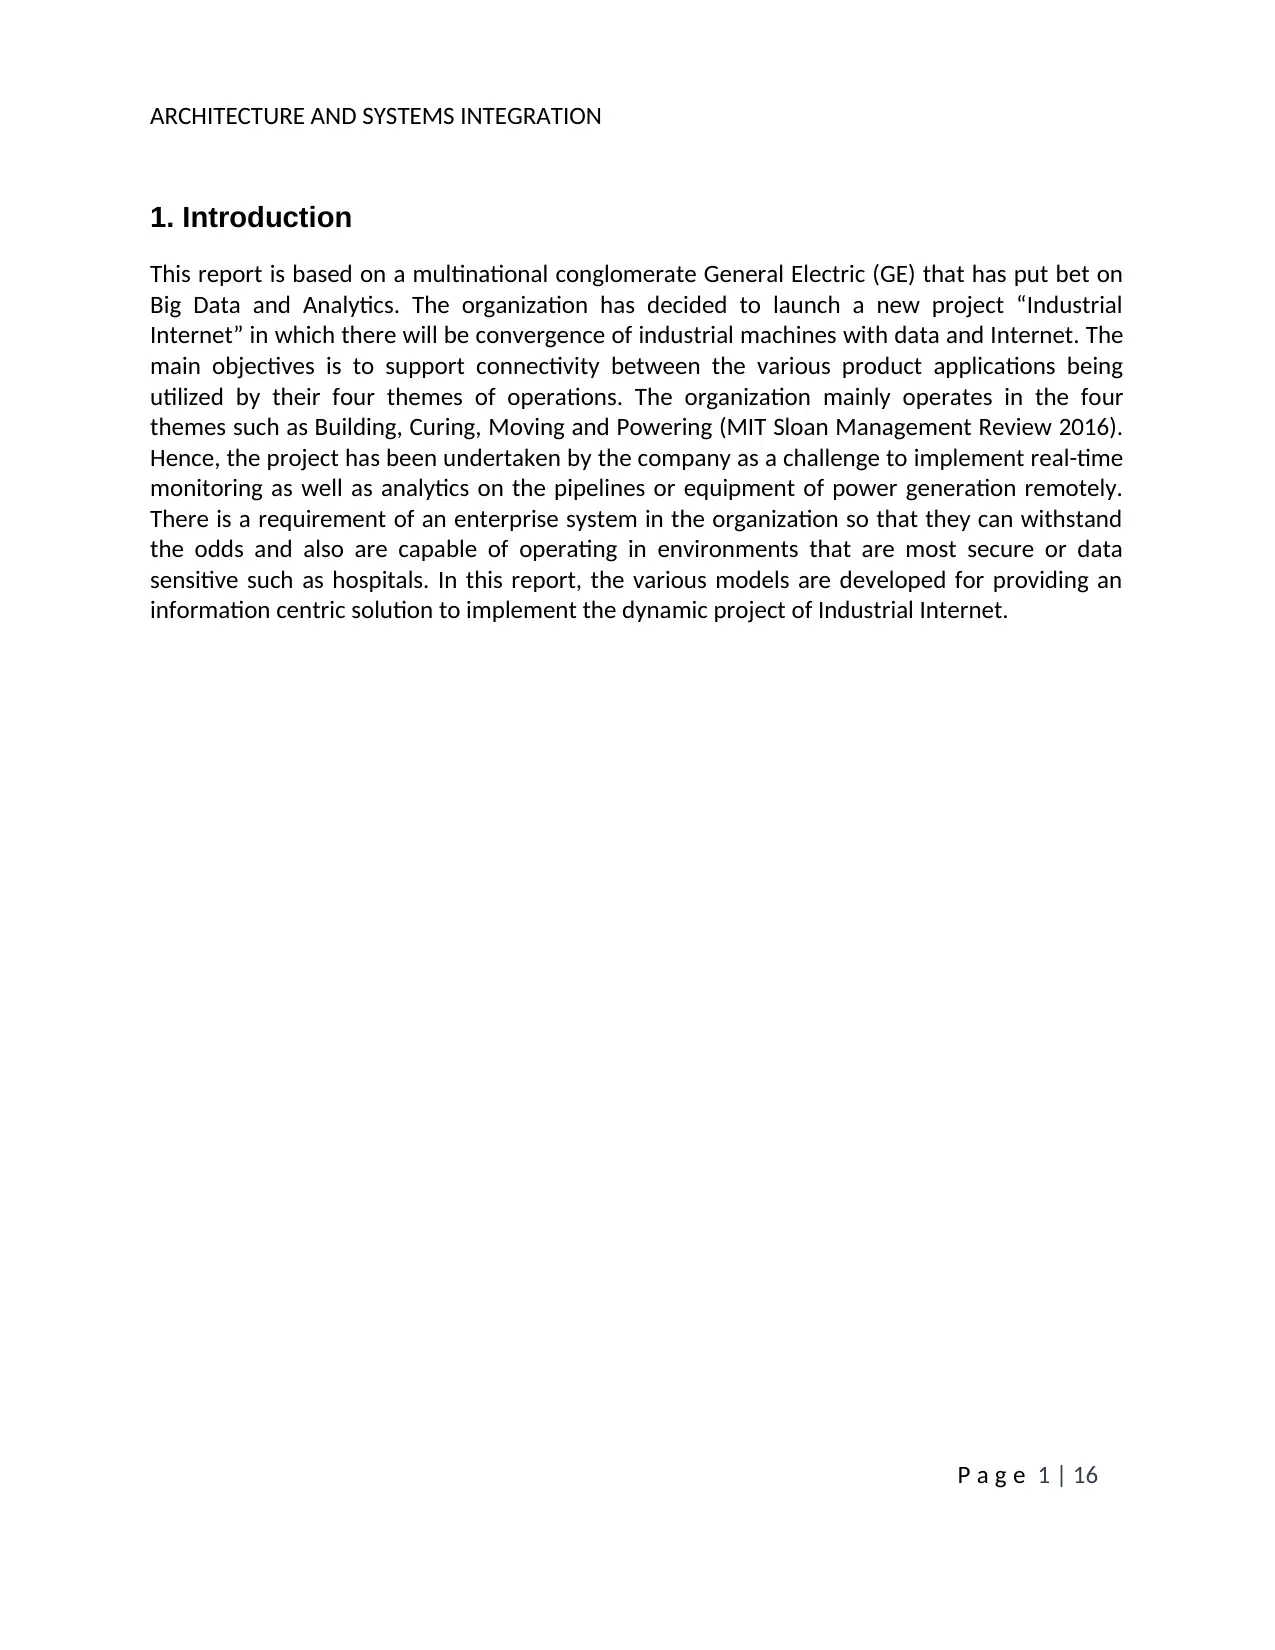
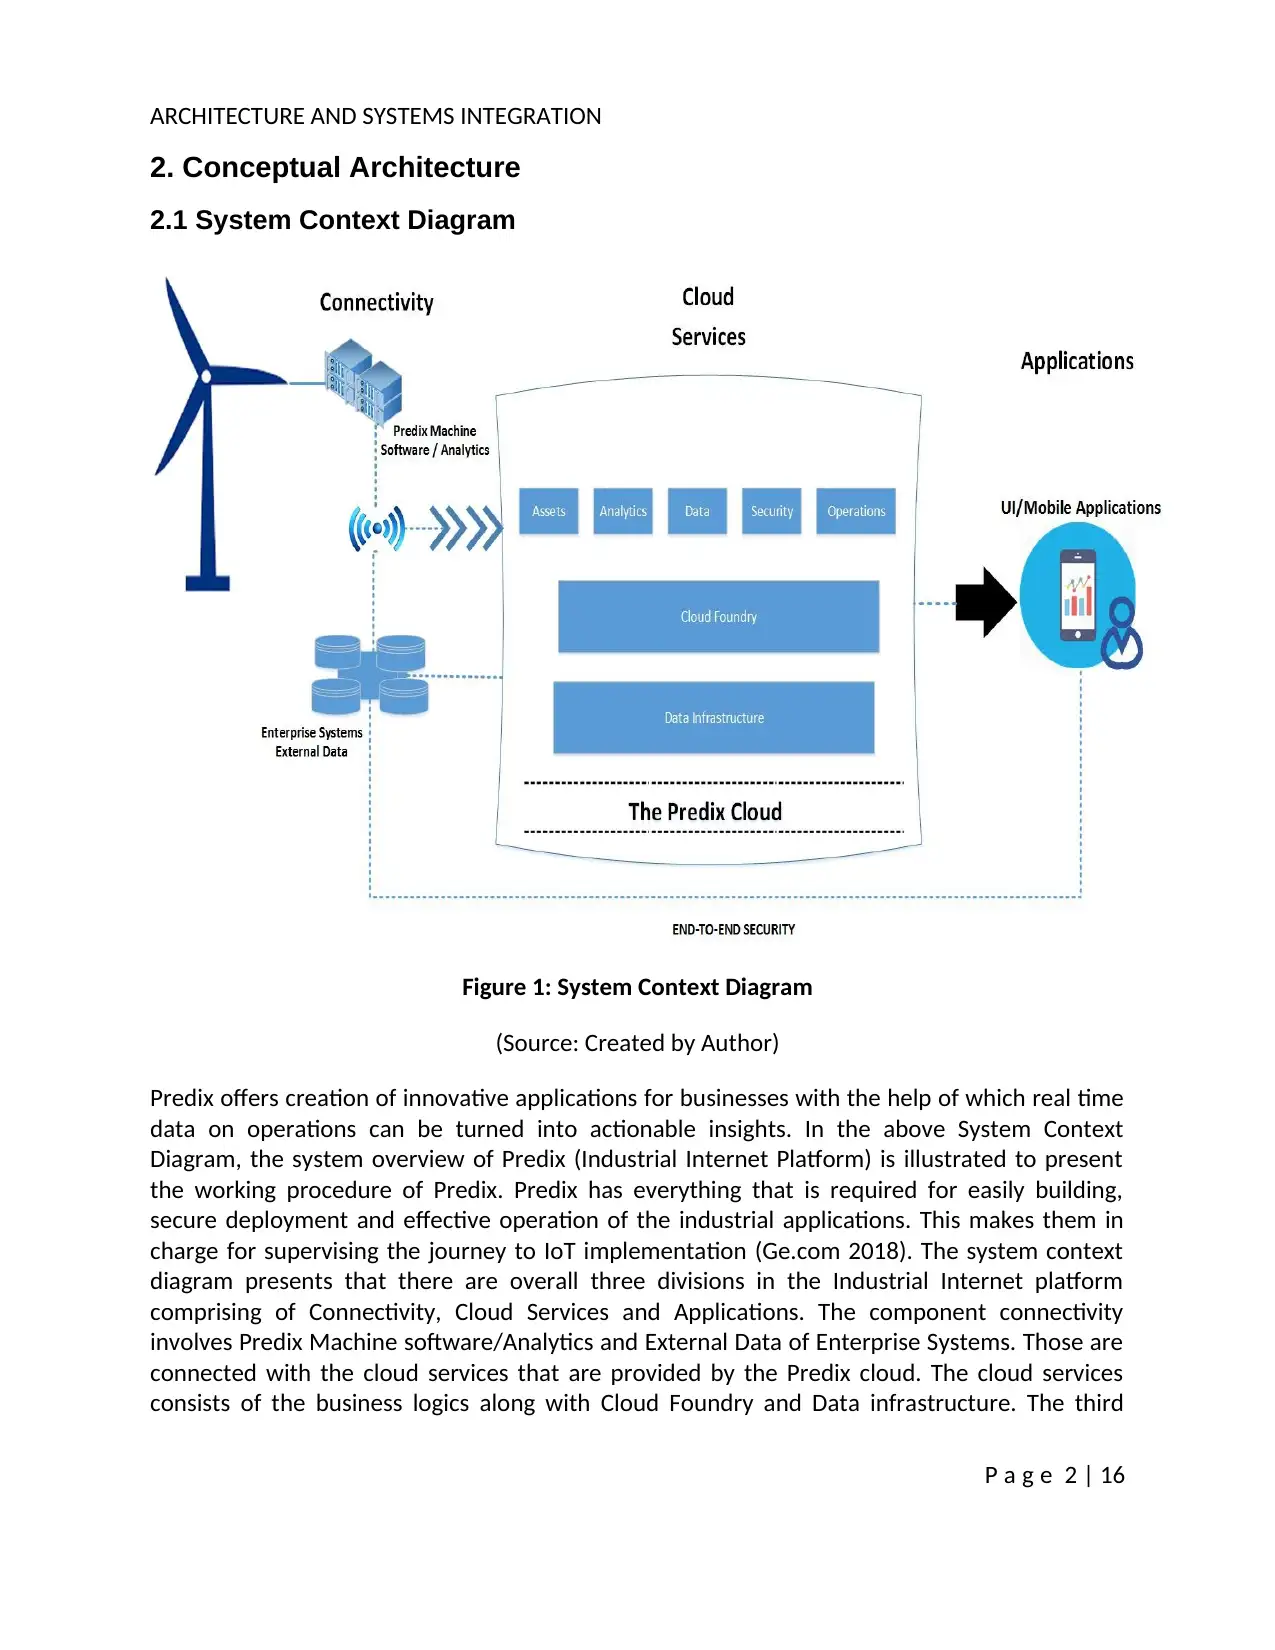
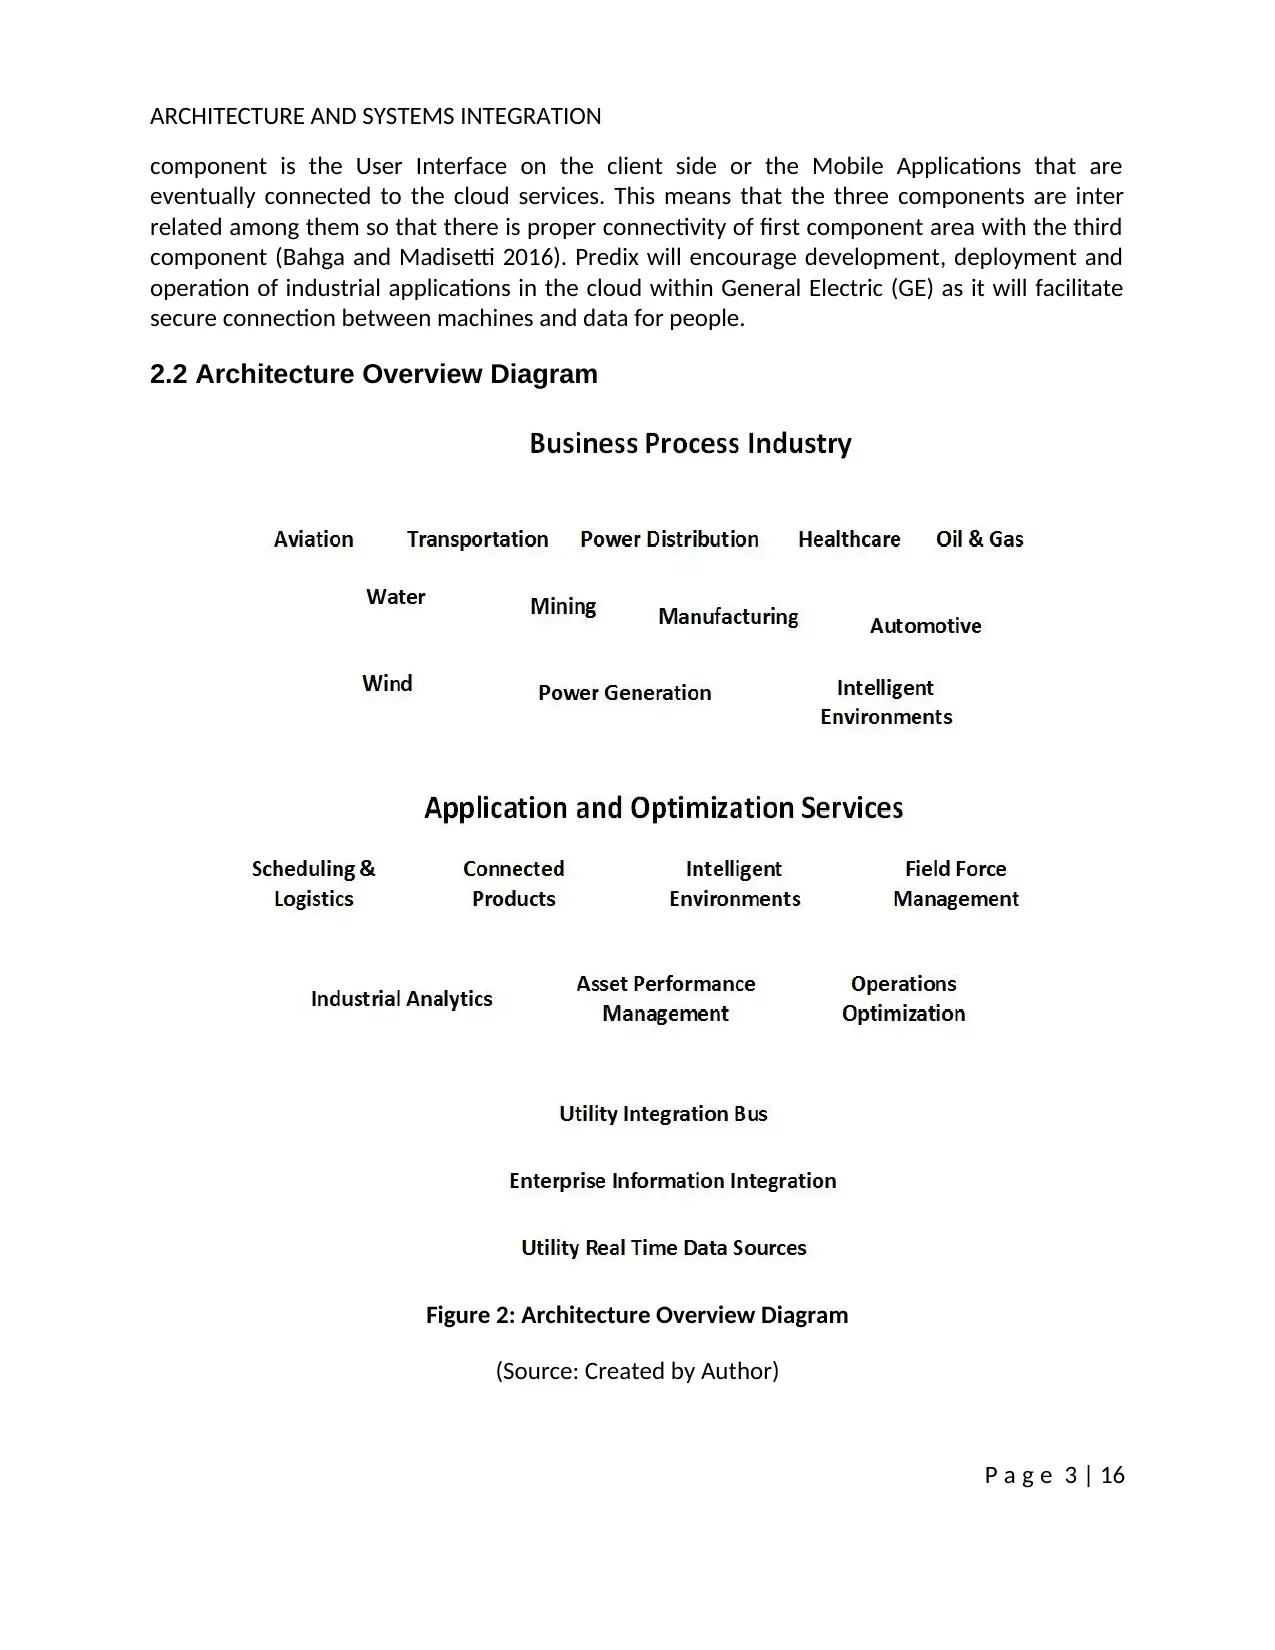
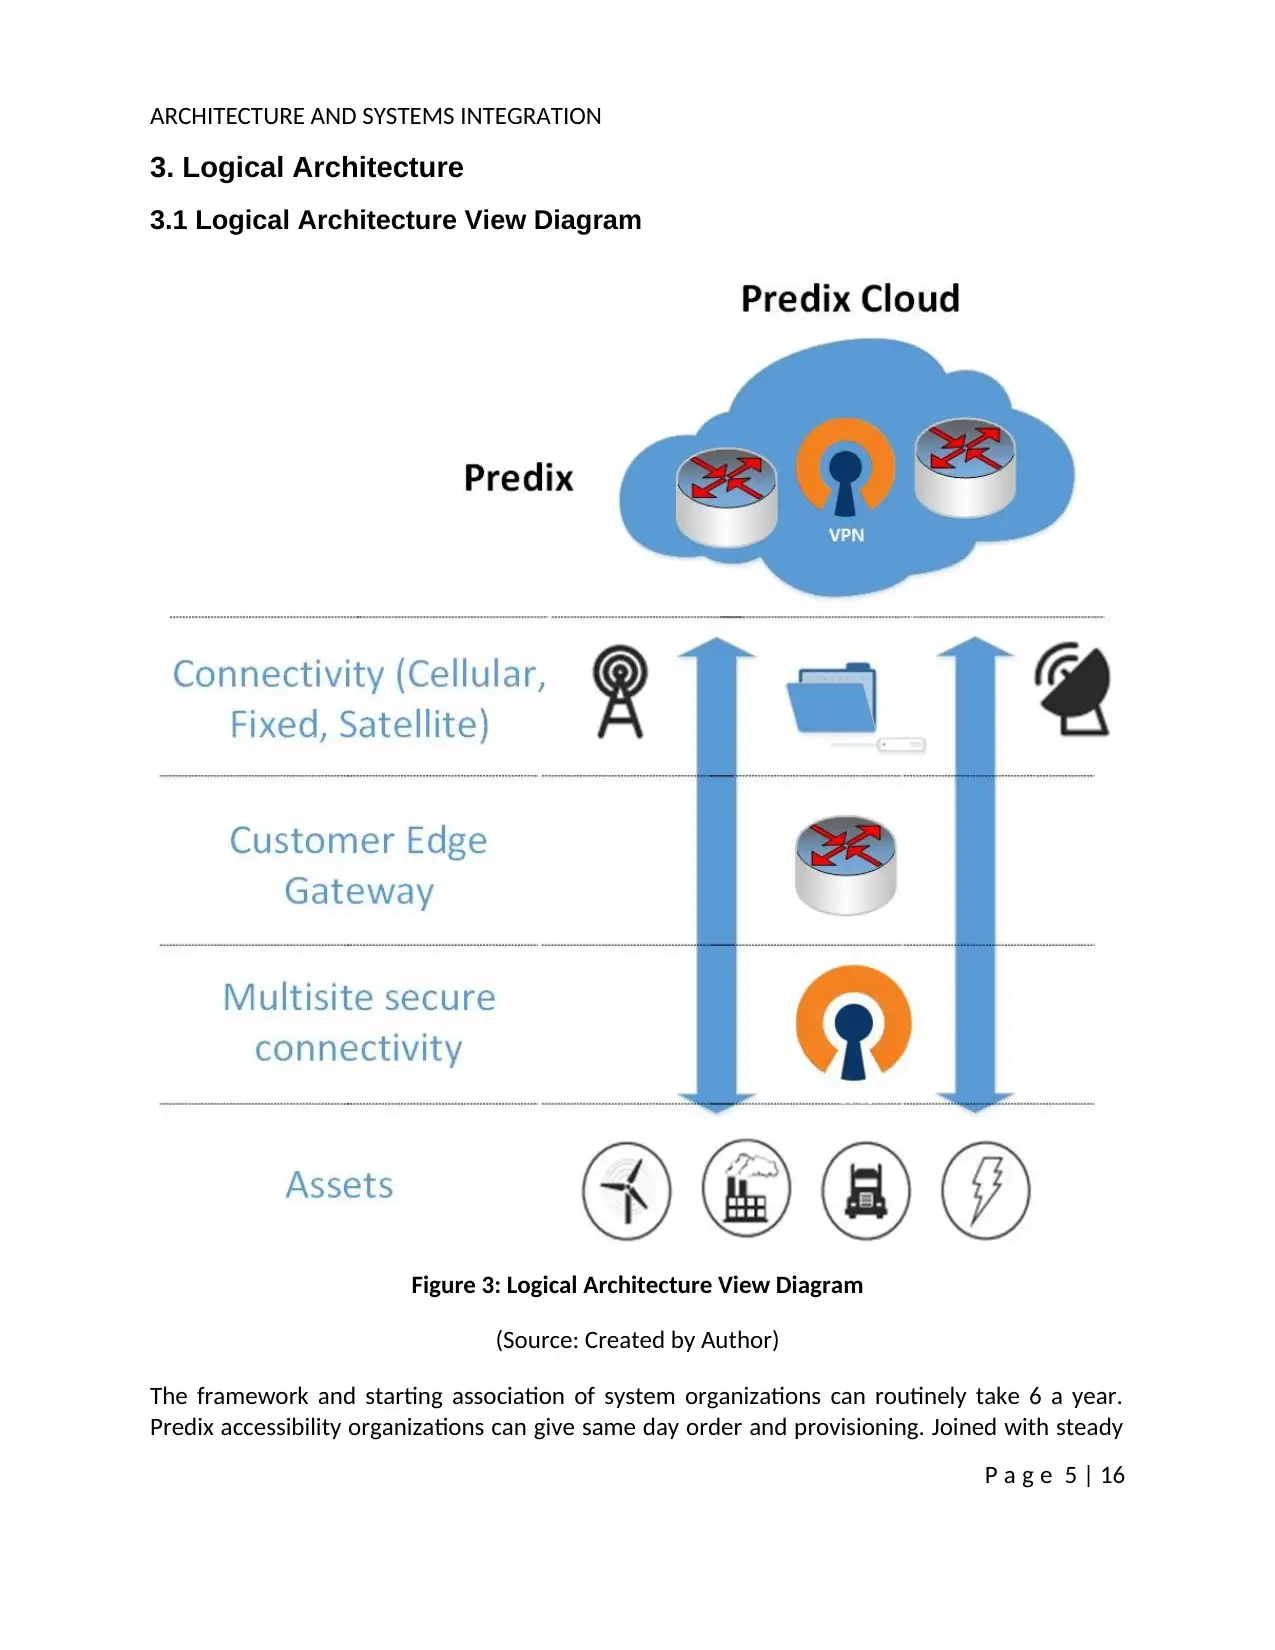
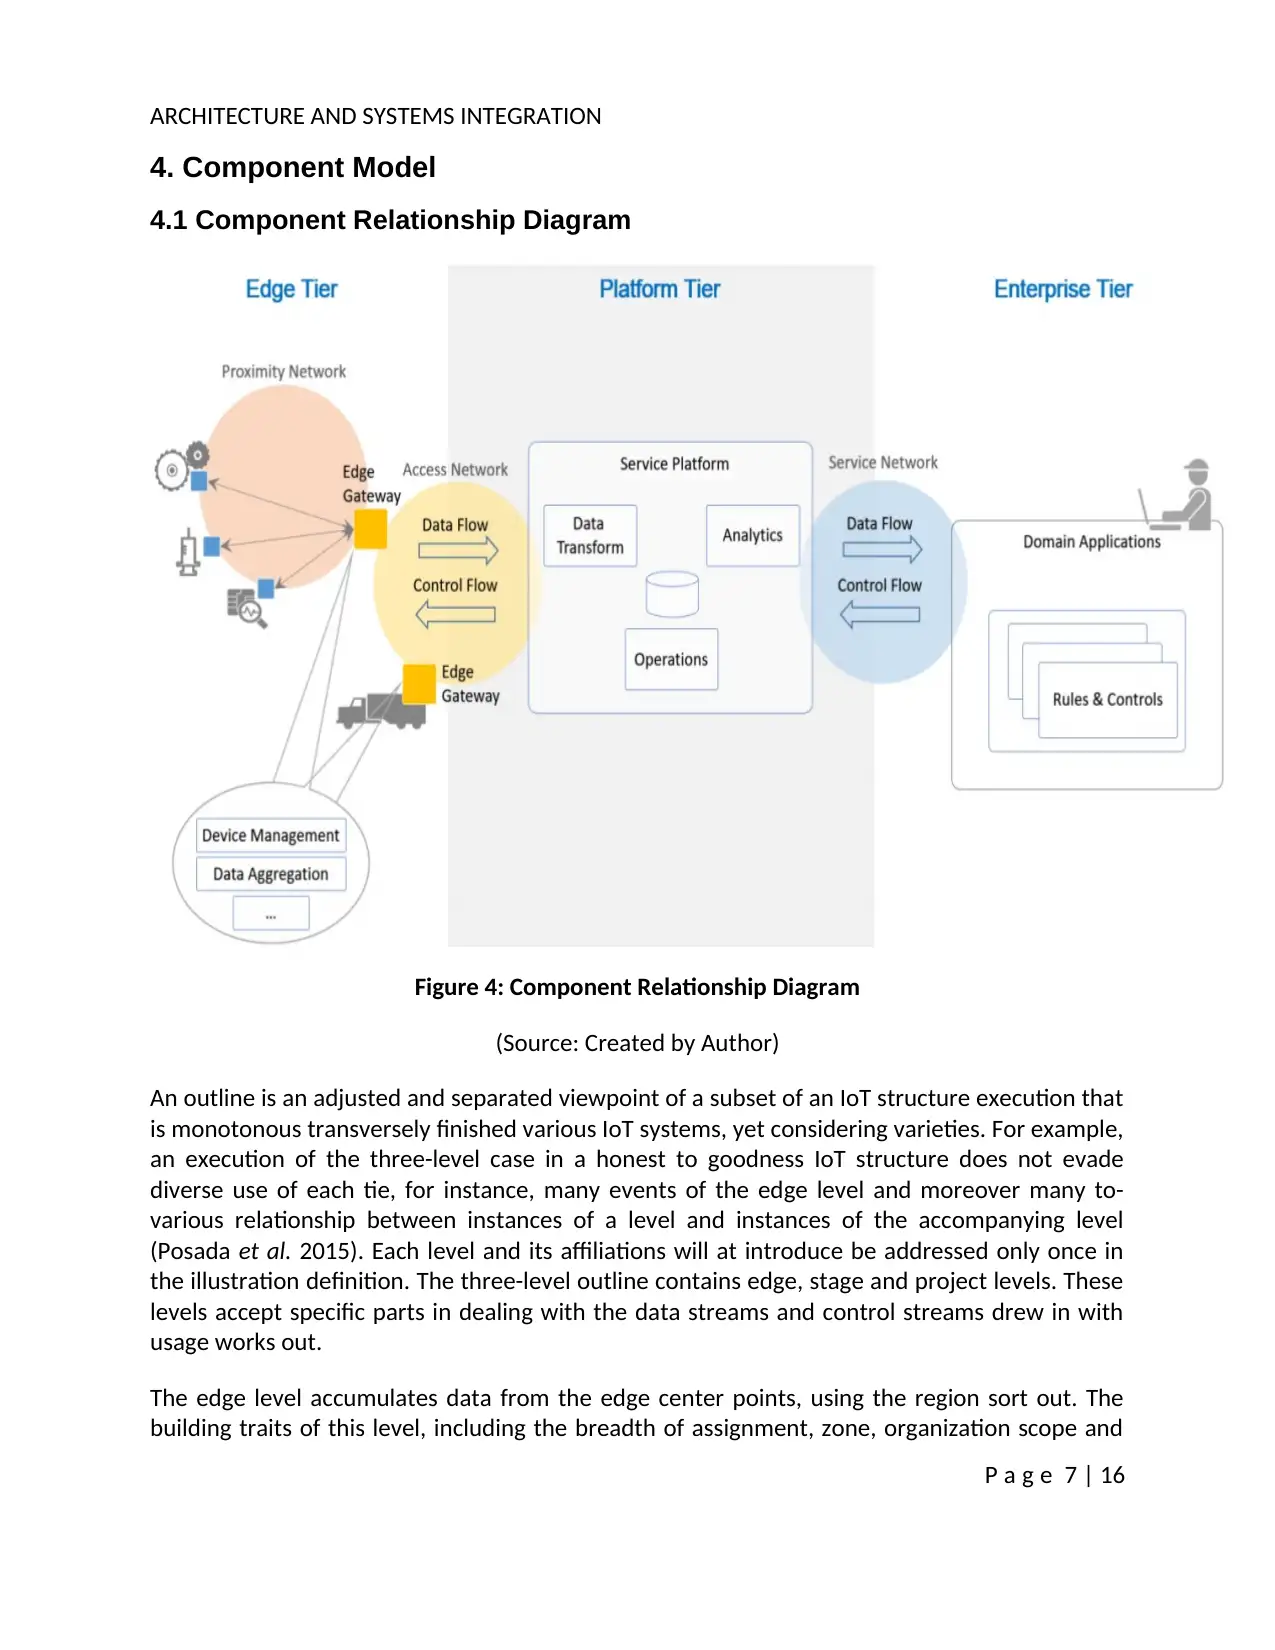
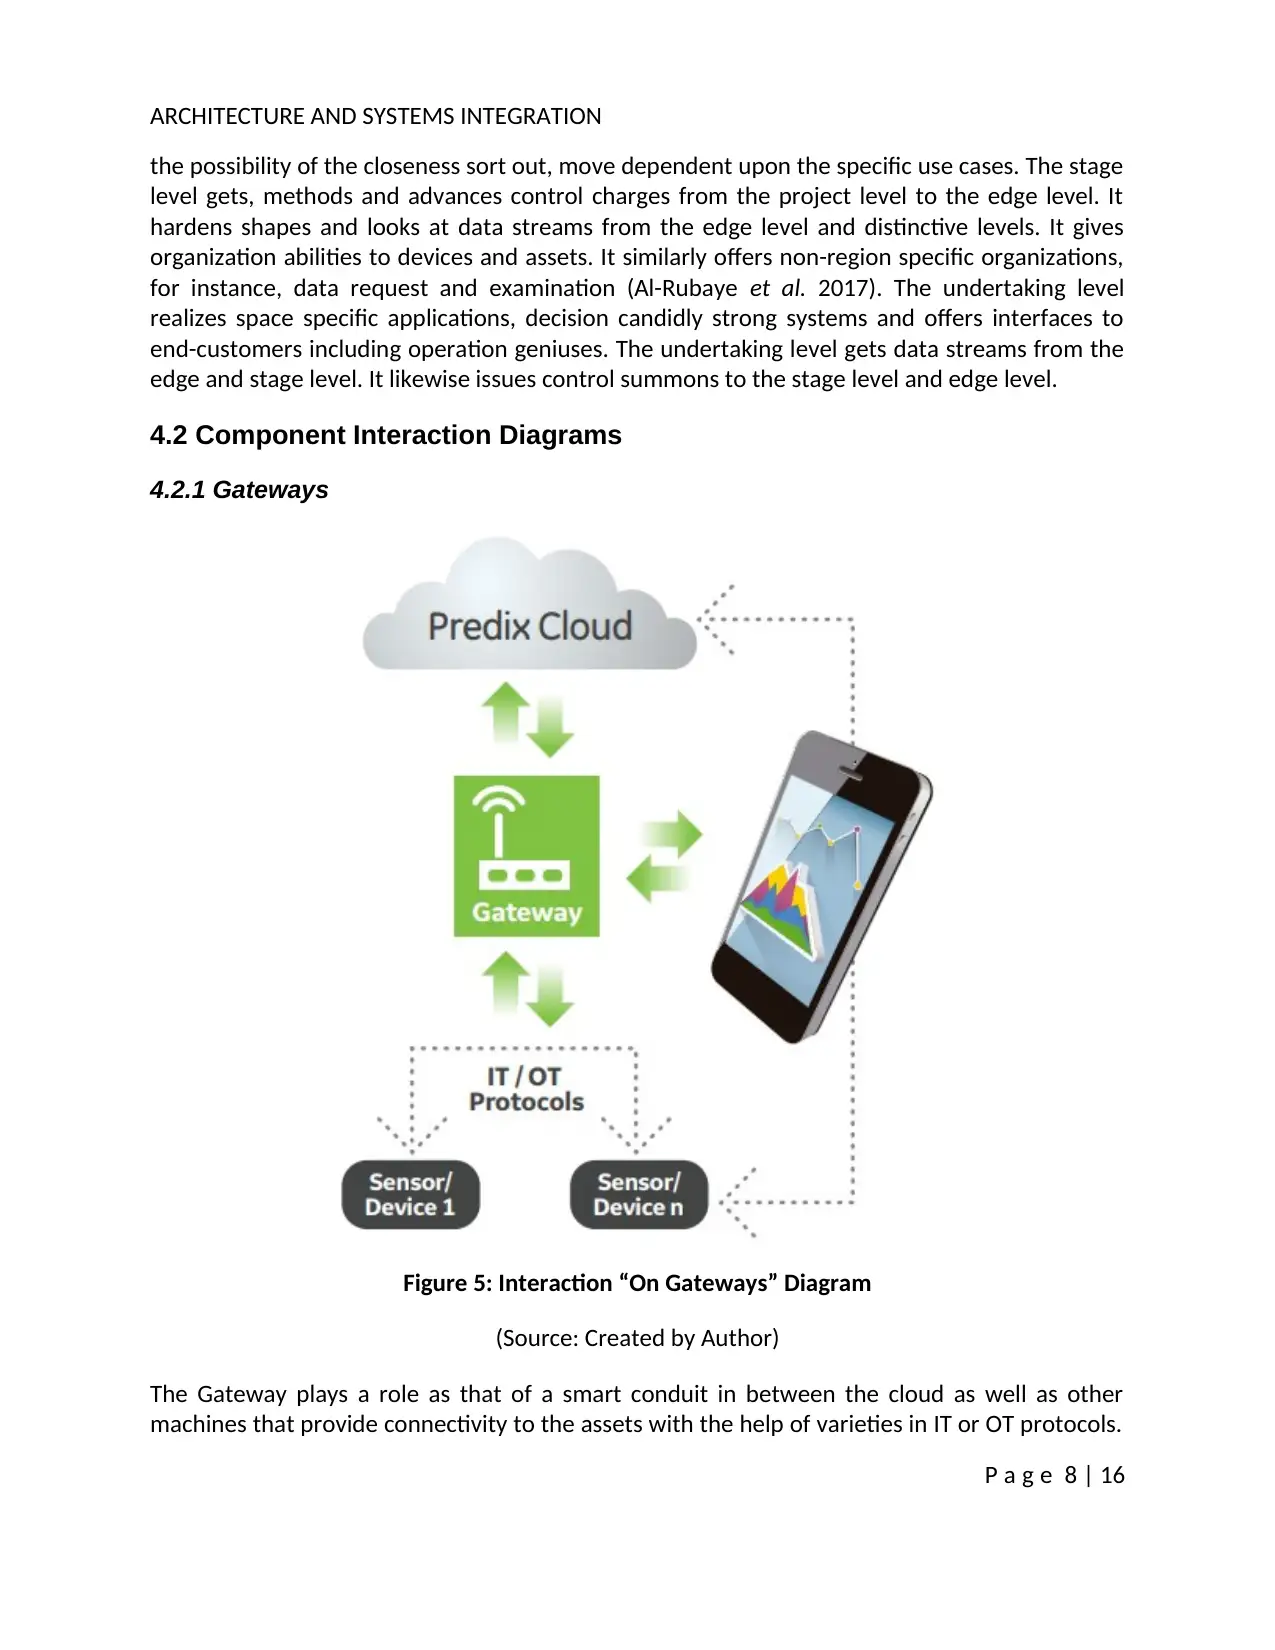
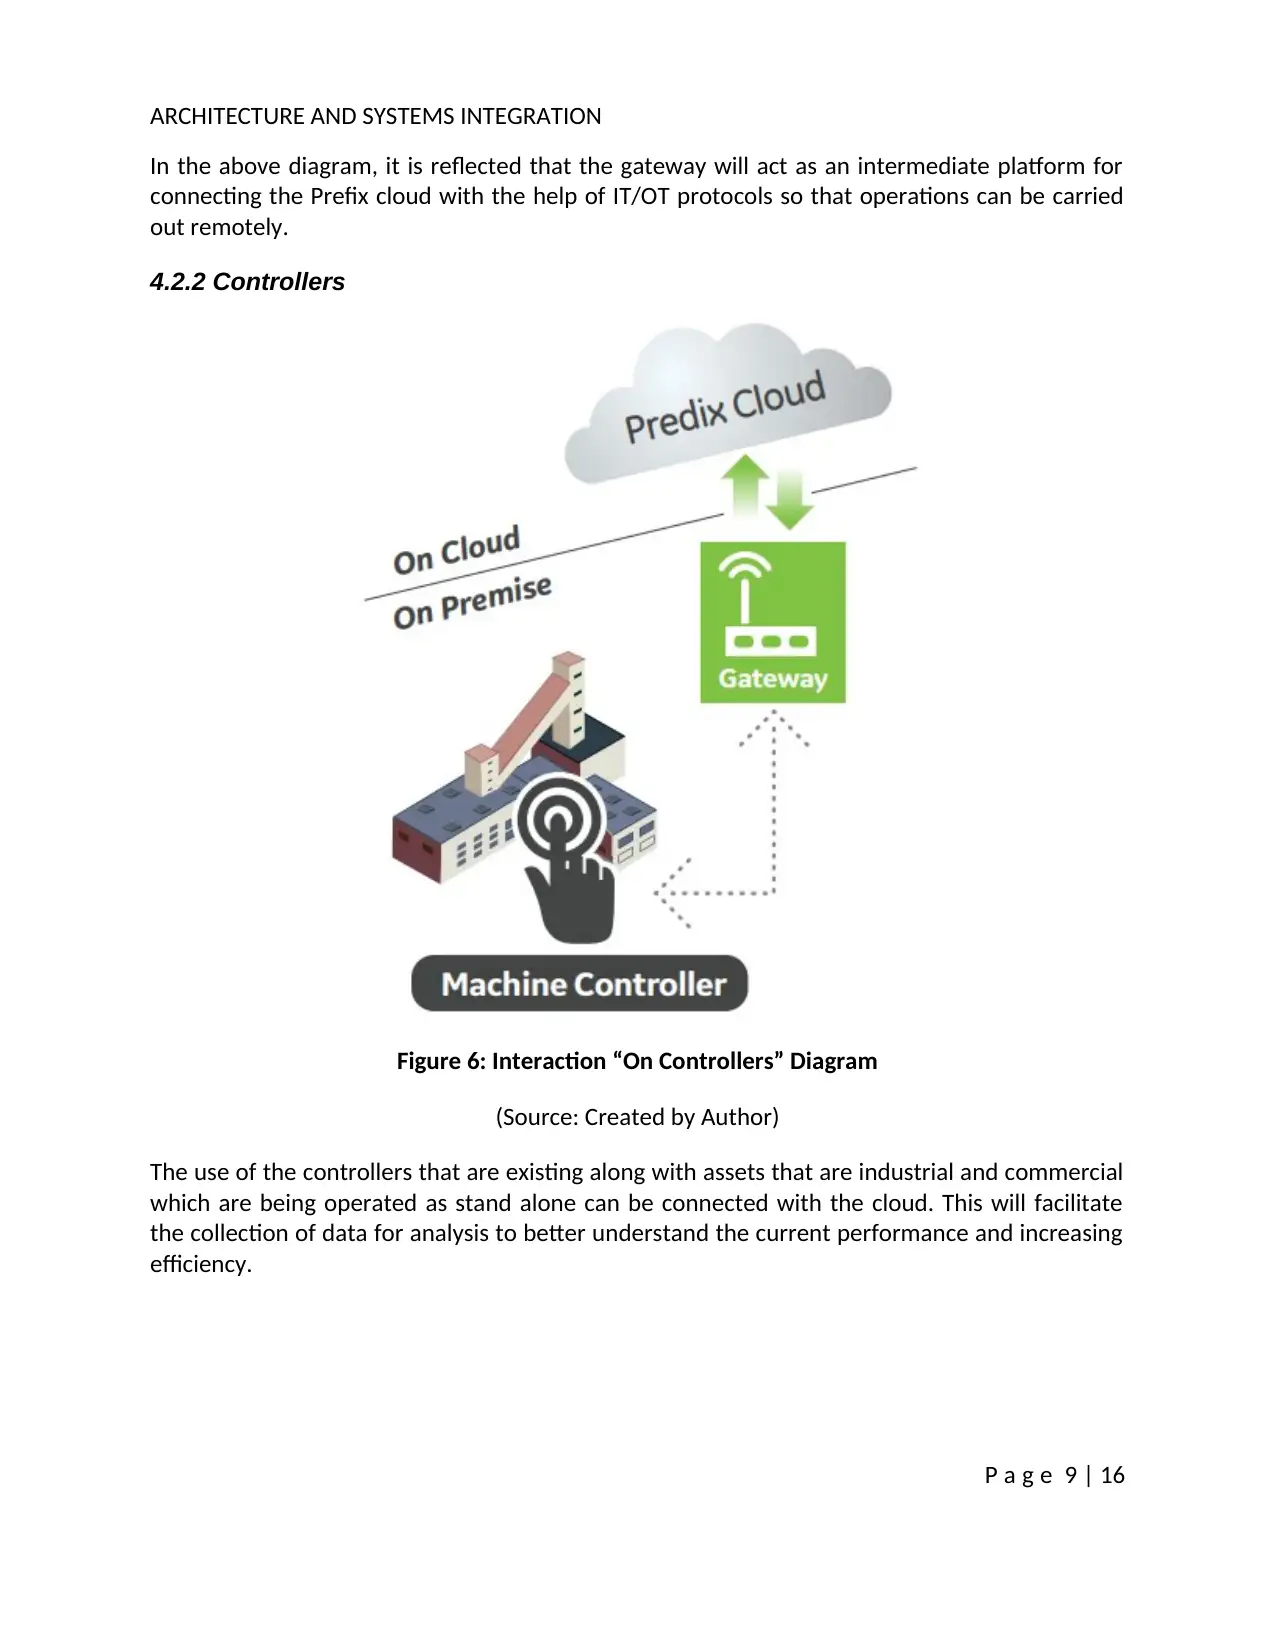
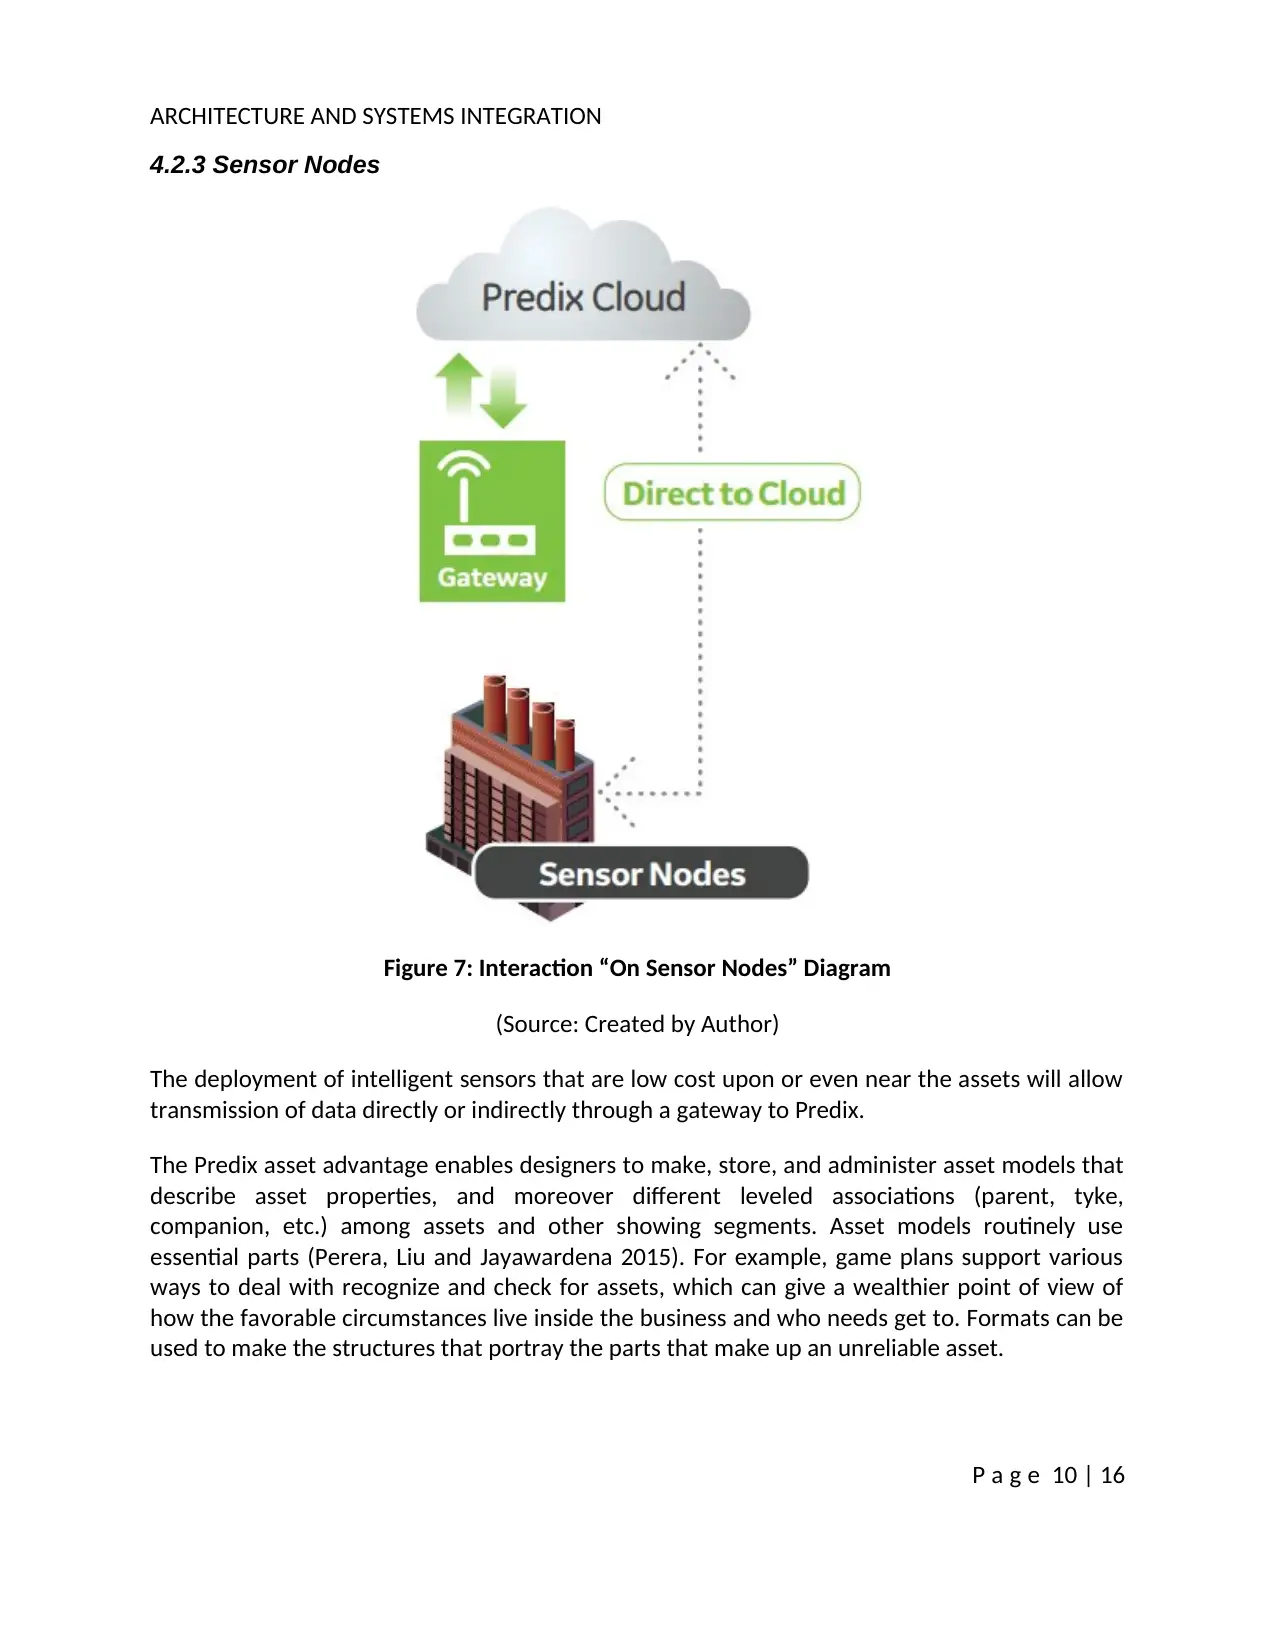
This report provides a detailed analysis of General Electric's (GE) "Industrial Internet" project, focusing on its architecture and system integration. The report begins with an introduction to GE's initiative to connect industrial machines with data and the Internet, aiming to improve real-time monitoring and analytics across its four operational themes. It then presents a conceptual architecture, including a System Context Diagram illustrating the Predix platform's components (Connectivity, Cloud Services, and Applications) and an Architecture Overview Diagram showcasing GE's operational layers. The report continues with a Logical Architecture View Diagram, followed by a Component Model that details component relationships and interactions, including gateways, controllers, and sensor nodes. An Operational Model, represented by a Logical Operational Model Diagram, is also provided, outlining data connections, ingestion, pipeline setup, and data management. The report concludes by summarizing the key findings and the significance of the Industrial Internet for GE's performance and efficiency. Various diagrams are used throughout to visually represent the architecture and system components. This comprehensive report is designed to provide an information-centric solution for implementing the dynamic project of Industrial Internet.

ICT321
Architecture and Systems Integration
Task 1
Author’s Name: [Please Fill]
Architecture and Systems Integration
Task 1
Author’s Name: [Please Fill]
Paraphrase This Document
Need a fresh take? Get an instant paraphrase of this document with our AI Paraphraser

ARCHITECTURE AND SYSTEMS INTEGRATION
Table of Contents
1. Introduction............................................................................................................................... 1
2. Conceptual Architecture............................................................................................................2
2.1 System Context Diagram.......................................................................................................2
2.2 Architecture Overview Diagram............................................................................................3
3. Logical Architecture................................................................................................................... 5
3.1 Logical Architecture View Diagram.......................................................................................5
4. Component Model.....................................................................................................................7
4.1 Component Relationship Diagram........................................................................................7
4.2 Component Interaction Diagrams.........................................................................................8
4.2.1 Gateways....................................................................................................................... 8
4.2.2 Controllers.....................................................................................................................9
4.2.3 Sensor Nodes...............................................................................................................10
5. Operational Model...................................................................................................................11
5.1 Logical Operational Model Diagram....................................................................................11
6. Conclusion............................................................................................................................... 12
7. References............................................................................................................................... 13
P a g e ii | 16

ARCHITECTURE AND SYSTEMS INTEGRATION
1. Introduction
This report is based on a multinational conglomerate General Electric (GE) that has put bet on
Big Data and Analytics. The organization has decided to launch a new project “Industrial
Internet” in which there will be convergence of industrial machines with data and Internet. The
main objectives is to support connectivity between the various product applications being
utilized by their four themes of operations. The organization mainly operates in the four
themes such as Building, Curing, Moving and Powering (MIT Sloan Management Review 2016).
Hence, the project has been undertaken by the company as a challenge to implement real-time
monitoring as well as analytics on the pipelines or equipment of power generation remotely.
There is a requirement of an enterprise system in the organization so that they can withstand
the odds and also are capable of operating in environments that are most secure or data
sensitive such as hospitals. In this report, the various models are developed for providing an
information centric solution to implement the dynamic project of Industrial Internet.
P a g e 1 | 16
⊘ This is a preview!⊘
Do you want full access?
Subscribe today to unlock all pages.

Trusted by 1+ million students worldwide

ARCHITECTURE AND SYSTEMS INTEGRATION
2. Conceptual Architecture
2.1 System Context Diagram
Figure 1: System Context Diagram
(Source: Created by Author)
Predix offers creation of innovative applications for businesses with the help of which real time
data on operations can be turned into actionable insights. In the above System Context
Diagram, the system overview of Predix (Industrial Internet Platform) is illustrated to present
the working procedure of Predix. Predix has everything that is required for easily building,
secure deployment and effective operation of the industrial applications. This makes them in
charge for supervising the journey to IoT implementation (Ge.com 2018). The system context
diagram presents that there are overall three divisions in the Industrial Internet platform
comprising of Connectivity, Cloud Services and Applications. The component connectivity
involves Predix Machine software/Analytics and External Data of Enterprise Systems. Those are
connected with the cloud services that are provided by the Predix cloud. The cloud services
consists of the business logics along with Cloud Foundry and Data infrastructure. The third
P a g e 2 | 16
Paraphrase This Document
Need a fresh take? Get an instant paraphrase of this document with our AI Paraphraser

ARCHITECTURE AND SYSTEMS INTEGRATION
component is the User Interface on the client side or the Mobile Applications that are
eventually connected to the cloud services. This means that the three components are inter
related among them so that there is proper connectivity of first component area with the third
component (Bahga and Madisetti 2016). Predix will encourage development, deployment and
operation of industrial applications in the cloud within General Electric (GE) as it will facilitate
secure connection between machines and data for people.
2.2 Architecture Overview Diagram
Figure 2: Architecture Overview Diagram
(Source: Created by Author)
P a g e 3 | 16

ARCHITECTURE AND SYSTEMS INTEGRATION
The above diagram illustrates the Architecture overview diagram to present the infrastructure
of GE Company. The various layers being depicted in the above diagram represent that they
play different roles in context to the organization. The first layer “Business Process Industry”
reflects the industries that are being presently operated as business by the company. GE is a
multinational conglomerate that operates in the fields such as Aviation, Transportation, Power
Distribution, Healthcare, Oil and Gas, Water, Mining, manufacturing, Automotive, Wind, Power
Generation and Intelligent Environments (Sadeghi, Wachsmann and Waidner 2015). This means
that the company has already an influence over technological innovation as it has grasp in
intelligent environments. The next layer represents the various application and optimization
services that the organization has taken into consideration as below:
Scheduling & Logistics: It relates to the increase in utilization of assets using predictive analytics,
improvement in the performance along with efficiency that will turn into lowering of costs for
repair.
Connected Products: It relates to replacing the existing “break-fix” model using the approach
“predict-and prevent” services with the help of developing machines software defined (Wan et
al. 2016).
Intelligent Environments: It associated with the using of LED solutions as well as sensors in cities
and buildings for collection and analysis of data and enhancing the experience of everyone.
Field Force Management: This relates to giving the workers with machine data as well as
expertise and processes that is required for more effective repairs and upgrades.
Industrial Analytics: This is associated with monitoring the asset health for identifying problems
after that using predictive as well as prescriptive analytics for boosting of productivity (Menon,
Karkkainen and Wuest 2017).
Asset Performance Management: It relates to achieving the new levels of performance,
reliability along with availability throughout the life cycle of all assets.
Operations Optimization: The key insights can be used on an enterprise wide scale for resolving
the operational issues and increasing efficiency.
P a g e 4 | 16
⊘ This is a preview!⊘
Do you want full access?
Subscribe today to unlock all pages.

Trusted by 1+ million students worldwide

ARCHITECTURE AND SYSTEMS INTEGRATION
3. Logical Architecture
3.1 Logical Architecture View Diagram
Figure 3: Logical Architecture View Diagram
(Source: Created by Author)
The framework and starting association of system organizations can routinely take 6 a year.
Predix accessibility organizations can give same day order and provisioning. Joined with steady
P a g e 5 | 16
Paraphrase This Document
Need a fresh take? Get an instant paraphrase of this document with our AI Paraphraser

ARCHITECTURE AND SYSTEMS INTEGRATION
proactive checking backing, exploring, and modified business alerts, these organizations pass on
a managed, secure, end to-end accessibility plan from the edge of a customer's framework to
the Predix cloud.
Physical accessibility globally by methods for cell, settled or satellite frameworks
through relationship with Tier-1 CSPs (IP QoS, Policing, Metering, ACL and NAT).
Secure virtual private framework (VPN) between the edge assets and Predix cloud,
ensuring data security and asset protection (Hossain and Muhammad 2016).
Ability to direct and control the edge assets by giving remote access by methods for
VNC, RDP, SSH, and HTTP.
End-to-end watching and notices about the system between Predix cloud and edge
assets.
One-stop-shop charging and uncovering for all accessibility and IP organizations.
A self-organization entryway.
An extremely overall present day arrange necessities to eat up and separate tremendous
volumes of data by partner with a wide variety of machines, sensors, control systems, data
sources, and contraptions (Dujovne et al. 2014). Predix can securely interface with machines
whether old or new, GE or non-GE on a broad scale. Once related, data is gotten, secured,
analyzed, and made open to the helpful people at the right time to engage the right decisions.
P a g e 6 | 16

ARCHITECTURE AND SYSTEMS INTEGRATION
4. Component Model
4.1 Component Relationship Diagram
Figure 4: Component Relationship Diagram
(Source: Created by Author)
An outline is an adjusted and separated viewpoint of a subset of an IoT structure execution that
is monotonous transversely finished various IoT systems, yet considering varieties. For example,
an execution of the three-level case in a honest to goodness IoT structure does not evade
diverse use of each tie, for instance, many events of the edge level and moreover many to-
various relationship between instances of a level and instances of the accompanying level
(Posada et al. 2015). Each level and its affiliations will at introduce be addressed only once in
the illustration definition. The three-level outline contains edge, stage and project levels. These
levels accept specific parts in dealing with the data streams and control streams drew in with
usage works out.
The edge level accumulates data from the edge center points, using the region sort out. The
building traits of this level, including the breadth of assignment, zone, organization scope and
P a g e 7 | 16
⊘ This is a preview!⊘
Do you want full access?
Subscribe today to unlock all pages.

Trusted by 1+ million students worldwide

ARCHITECTURE AND SYSTEMS INTEGRATION
the possibility of the closeness sort out, move dependent upon the specific use cases. The stage
level gets, methods and advances control charges from the project level to the edge level. It
hardens shapes and looks at data streams from the edge level and distinctive levels. It gives
organization abilities to devices and assets. It similarly offers non-region specific organizations,
for instance, data request and examination (Al-Rubaye et al. 2017). The undertaking level
realizes space specific applications, decision candidly strong systems and offers interfaces to
end-customers including operation geniuses. The undertaking level gets data streams from the
edge and stage level. It likewise issues control summons to the stage level and edge level.
4.2 Component Interaction Diagrams
4.2.1 Gateways
Figure 5: Interaction “On Gateways” Diagram
(Source: Created by Author)
The Gateway plays a role as that of a smart conduit in between the cloud as well as other
machines that provide connectivity to the assets with the help of varieties in IT or OT protocols.
P a g e 8 | 16
Paraphrase This Document
Need a fresh take? Get an instant paraphrase of this document with our AI Paraphraser

ARCHITECTURE AND SYSTEMS INTEGRATION
In the above diagram, it is reflected that the gateway will act as an intermediate platform for
connecting the Prefix cloud with the help of IT/OT protocols so that operations can be carried
out remotely.
4.2.2 Controllers
Figure 6: Interaction “On Controllers” Diagram
(Source: Created by Author)
The use of the controllers that are existing along with assets that are industrial and commercial
which are being operated as stand alone can be connected with the cloud. This will facilitate
the collection of data for analysis to better understand the current performance and increasing
efficiency.
P a g e 9 | 16

ARCHITECTURE AND SYSTEMS INTEGRATION
4.2.3 Sensor Nodes
Figure 7: Interaction “On Sensor Nodes” Diagram
(Source: Created by Author)
The deployment of intelligent sensors that are low cost upon or even near the assets will allow
transmission of data directly or indirectly through a gateway to Predix.
The Predix asset advantage enables designers to make, store, and administer asset models that
describe asset properties, and moreover different leveled associations (parent, tyke,
companion, etc.) among assets and other showing segments. Asset models routinely use
essential parts (Perera, Liu and Jayawardena 2015). For example, game plans support various
ways to deal with recognize and check for assets, which can give a wealthier point of view of
how the favorable circumstances live inside the business and who needs get to. Formats can be
used to make the structures that portray the parts that make up an unreliable asset.
P a g e 10 | 16
⊘ This is a preview!⊘
Do you want full access?
Subscribe today to unlock all pages.

Trusted by 1+ million students worldwide
1 out of 16