Report on Downtime Analysis of Production Machinery Process
VerifiedAdded on  2022/09/27
|5
|954
|26
Report
AI Summary
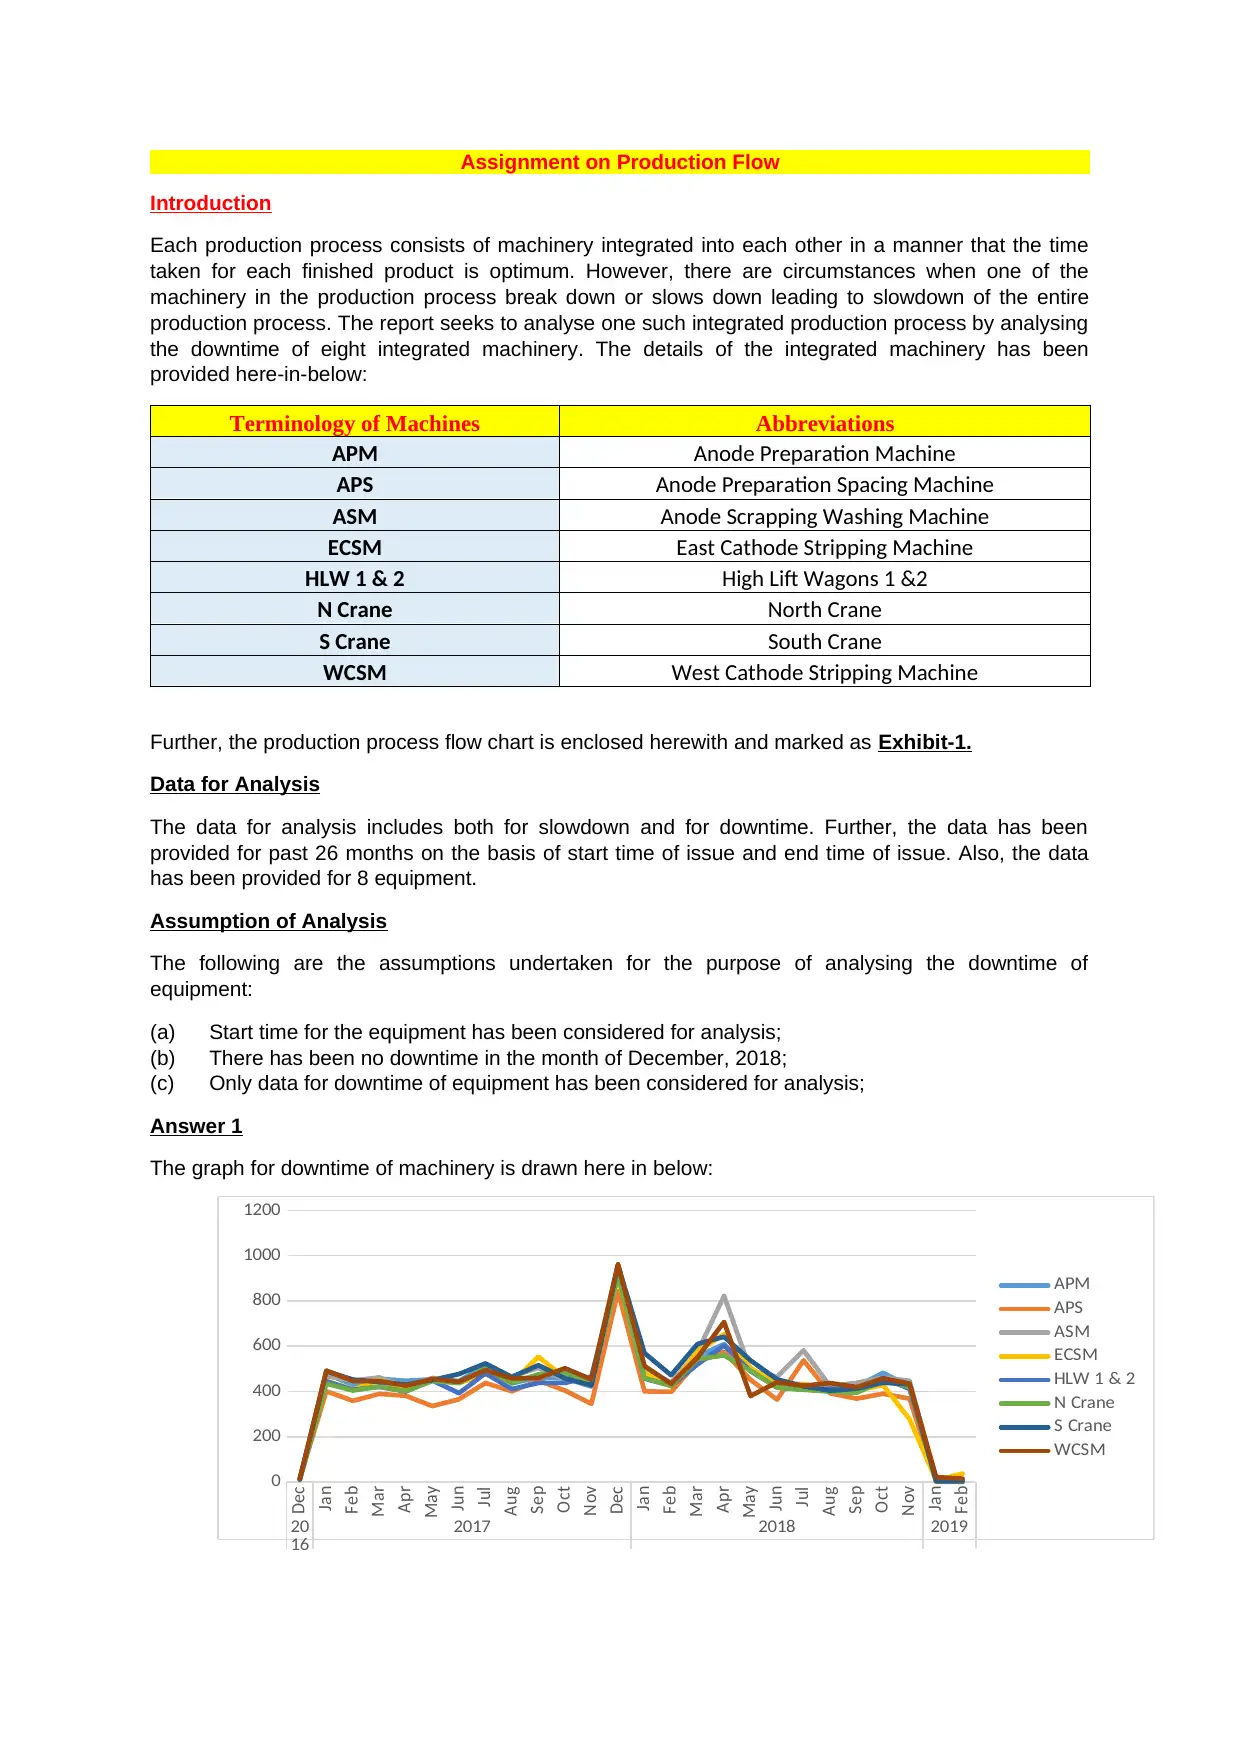
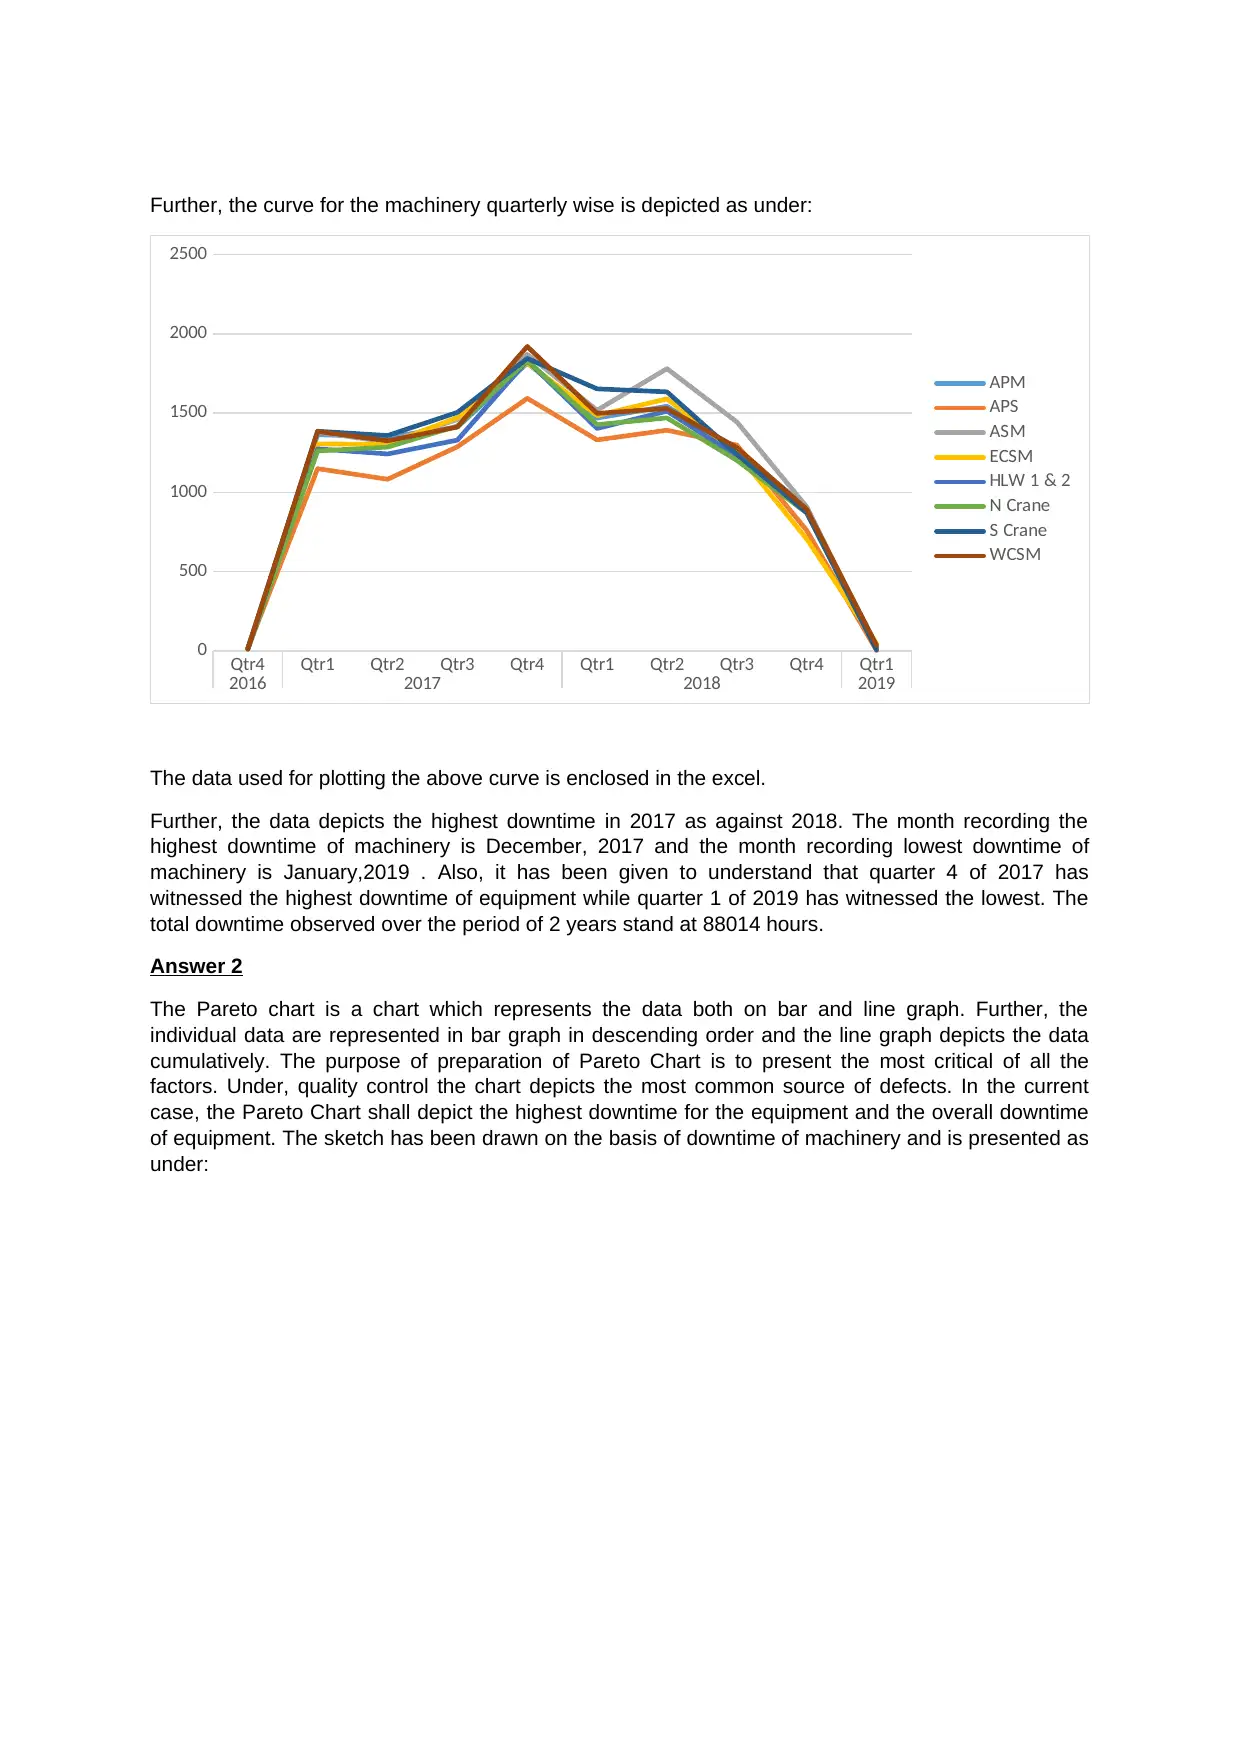
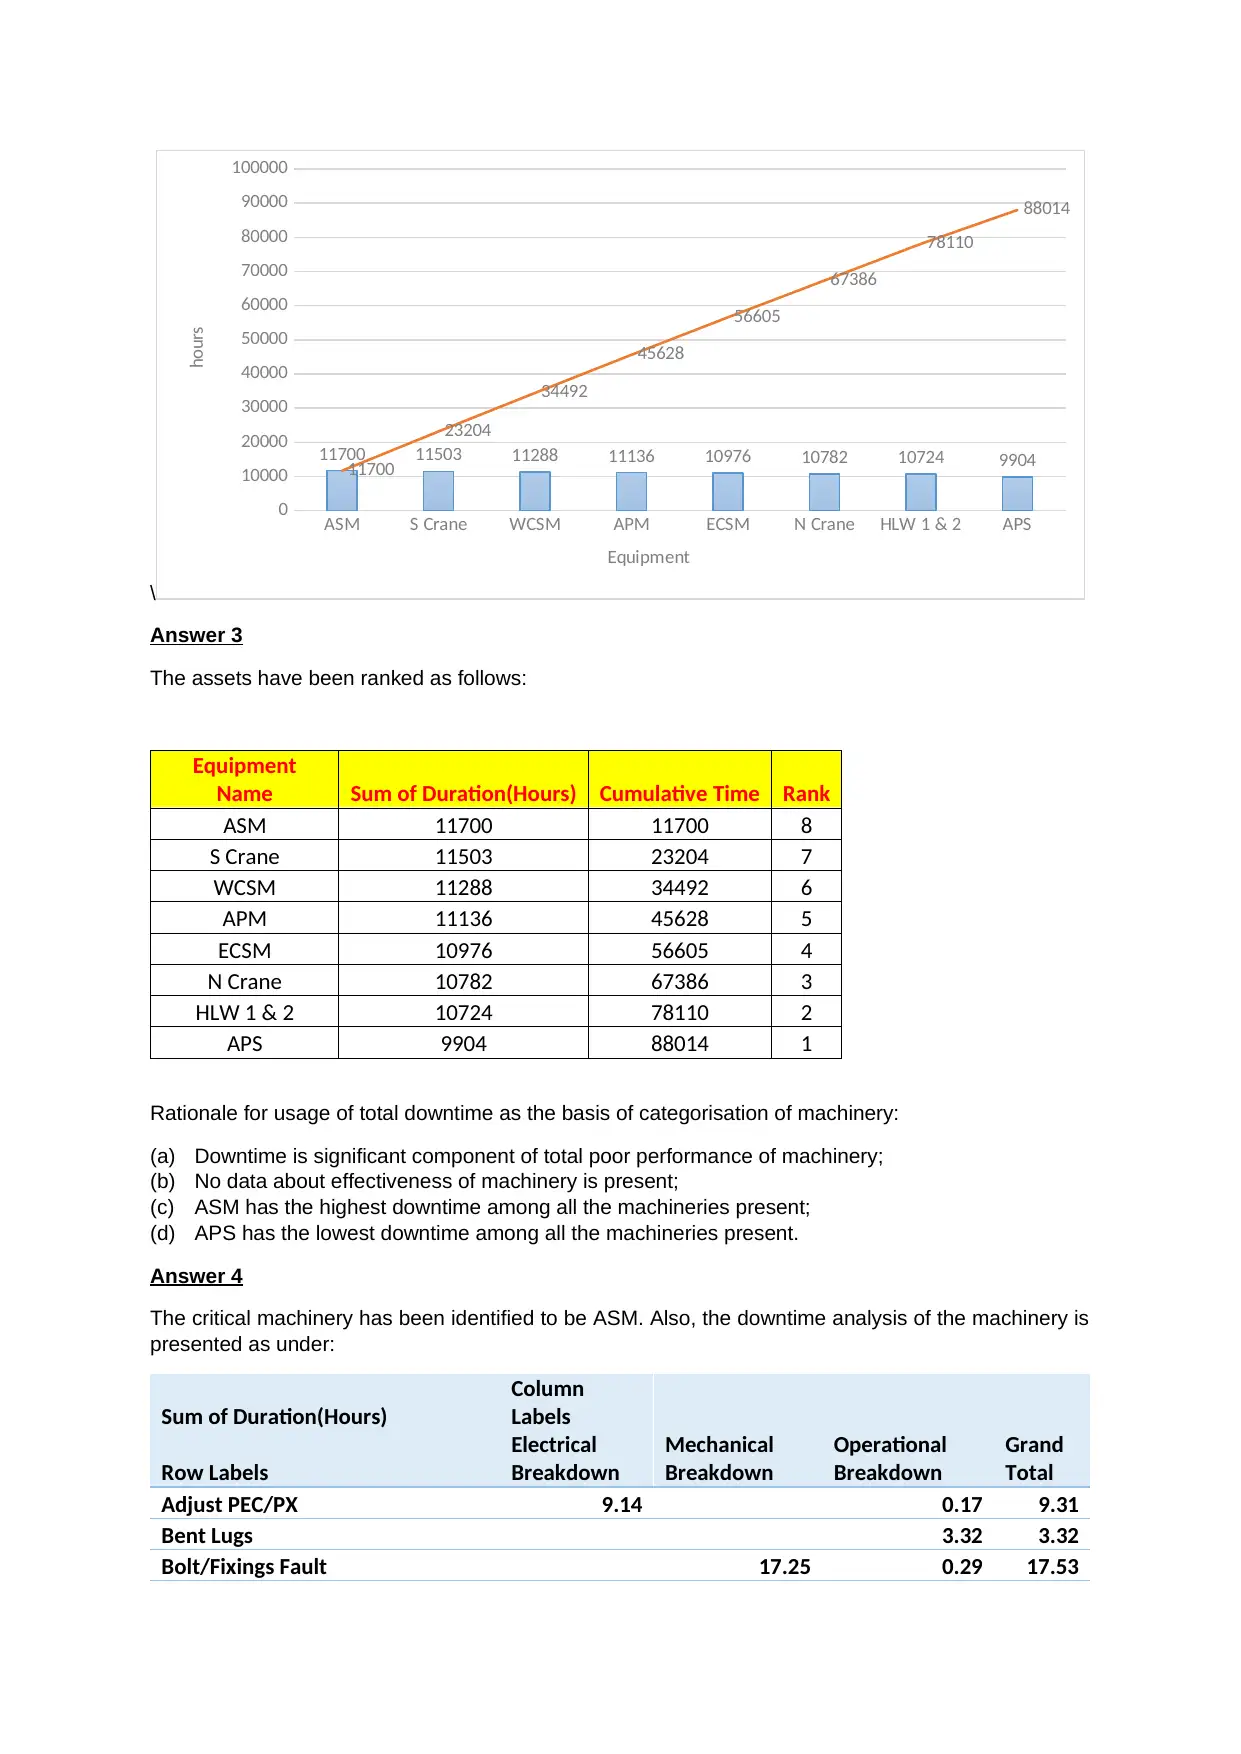
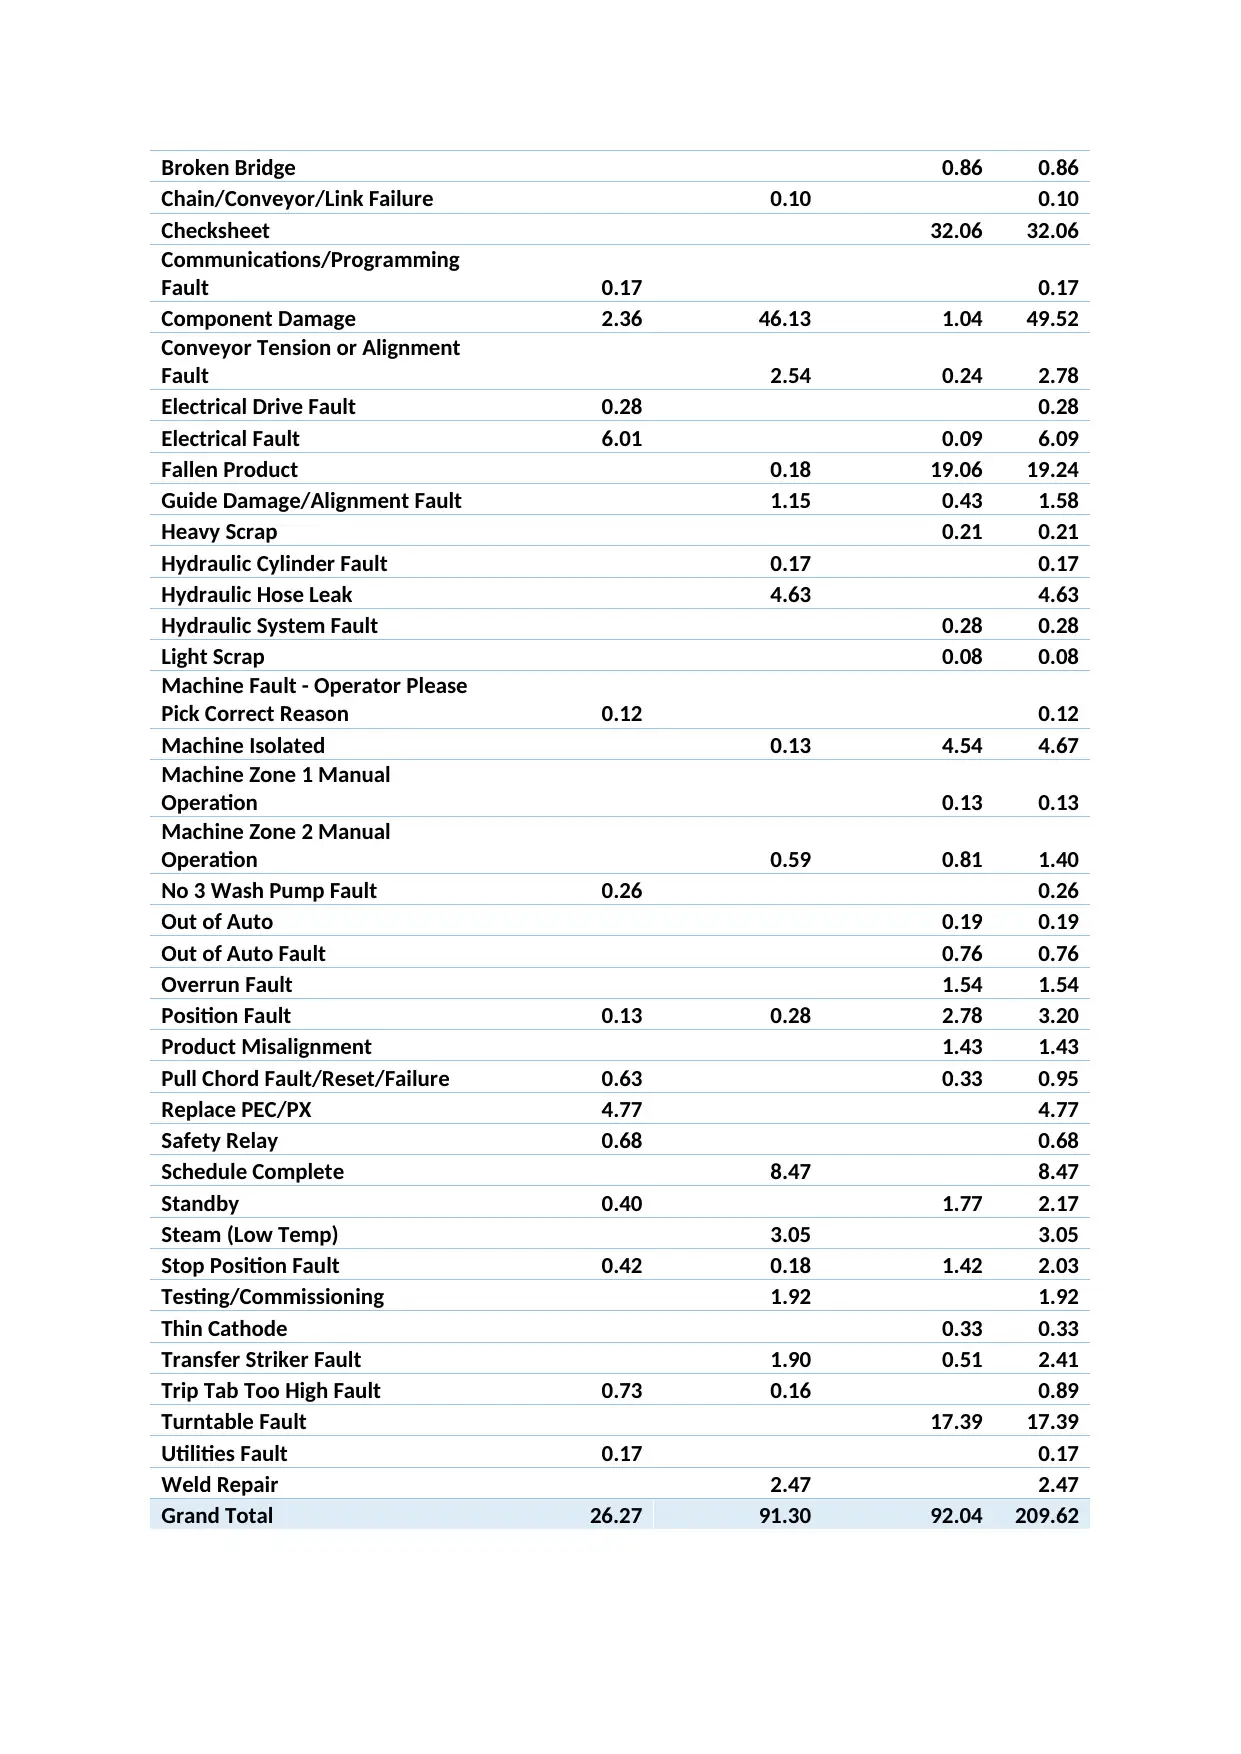
This report analyzes the downtime of eight integrated machinery in a production process over a 26-month period. The analysis includes generating downtime trends on a monthly and quarterly basis, creating a Pareto chart to identify critical factors, and ranking the equipment based on downtime duration. The report identifies the most critical machinery, ASM, and analyzes the causes of its downtime, categorized as electrical, mechanical, and operational breakdowns, with specific reasons and justifications provided. The findings highlight the impact of component damage and check sheet issues on downtime. The total downtime observed over the period of 2 years stand at 88014 hours. The report concludes with recommendations for improving the production process by addressing the identified downtime causes and critical equipment.

Assignment on Production Flow
Introduction
Each production process consists of machinery integrated into each other in a manner that the time
taken for each finished product is optimum. However, there are circumstances when one of the
machinery in the production process break down or slows down leading to slowdown of the entire
production process. The report seeks to analyse one such integrated production process by analysing
the downtime of eight integrated machinery. The details of the integrated machinery has been
provided here-in-below:
Terminology of Machines Abbreviations
APM Anode Preparation Machine
APS Anode Preparation Spacing Machine
ASM Anode Scrapping Washing Machine
ECSM East Cathode Stripping Machine
HLW 1 & 2 High Lift Wagons 1 &2
N Crane North Crane
S Crane South Crane
WCSM West Cathode Stripping Machine
Further, the production process flow chart is enclosed herewith and marked as Exhibit-1.
Data for Analysis
The data for analysis includes both for slowdown and for downtime. Further, the data has been
provided for past 26 months on the basis of start time of issue and end time of issue. Also, the data
has been provided for 8 equipment.
Assumption of Analysis
The following are the assumptions undertaken for the purpose of analysing the downtime of
equipment:
(a) Start time for the equipment has been considered for analysis;
(b) There has been no downtime in the month of December, 2018;
(c) Only data for downtime of equipment has been considered for analysis;
Answer 1
The graph for downtime of machinery is drawn here in below:
Dec
Jan
Feb
Mar
Apr
May
Jun
Jul
Aug
Sep
Oct
Nov
Dec
Jan
Feb
Mar
Apr
May
Jun
Jul
Aug
Sep
Oct
Nov
Jan
Feb
20
16
2017 2018 2019
0
200
400
600
800
1000
1200
APM
APS
ASM
ECSM
HLW 1 & 2
N Crane
S Crane
WCSM
Paraphrase This Document
Need a fresh take? Get an instant paraphrase of this document with our AI Paraphraser

Further, the curve for the machinery quarterly wise is depicted as under:
Qtr4 Qtr1 Qtr2 Qtr3 Qtr4 Qtr1 Qtr2 Qtr3 Qtr4 Qtr1
2016 2017 2018 2019
0
500
1000
1500
2000
2500
APM
APS
ASM
ECSM
HLW 1 & 2
N Crane
S Crane
WCSM
The data used for plotting the above curve is enclosed in the excel.
Further, the data depicts the highest downtime in 2017 as against 2018. The month recording the
highest downtime of machinery is December, 2017 and the month recording lowest downtime of
machinery is January,2019 . Also, it has been given to understand that quarter 4 of 2017 has
witnessed the highest downtime of equipment while quarter 1 of 2019 has witnessed the lowest. The
total downtime observed over the period of 2 years stand at 88014 hours.
Answer 2
The Pareto chart is a chart which represents the data both on bar and line graph. Further, the
individual data are represented in bar graph in descending order and the line graph depicts the data
cumulatively. The purpose of preparation of Pareto Chart is to present the most critical of all the
factors. Under, quality control the chart depicts the most common source of defects. In the current
case, the Pareto Chart shall depict the highest downtime for the equipment and the overall downtime
of equipment. The sketch has been drawn on the basis of downtime of machinery and is presented as
under:

\
ASM S Crane WCSM APM ECSM N Crane HLW 1 & 2 APS
0
10000
20000
30000
40000
50000
60000
70000
80000
90000
100000
11700 11503 11288 11136 10976 10782 10724 990411700
23204
34492
45628
56605
67386
78110
88014
Equipment
hours
Answer 3
The assets have been ranked as follows:
Equipment
Name Sum of Duration(Hours) Cumulative Time Rank
ASM 11700 11700 8
S Crane 11503 23204 7
WCSM 11288 34492 6
APM 11136 45628 5
ECSM 10976 56605 4
N Crane 10782 67386 3
HLW 1 & 2 10724 78110 2
APS 9904 88014 1
Rationale for usage of total downtime as the basis of categorisation of machinery:
(a) Downtime is significant component of total poor performance of machinery;
(b) No data about effectiveness of machinery is present;
(c) ASM has the highest downtime among all the machineries present;
(d) APS has the lowest downtime among all the machineries present.
Answer 4
The critical machinery has been identified to be ASM. Also, the downtime analysis of the machinery is
presented as under:
Sum of Duration(Hours)
Column
Labels
Row Labels
Electrical
Breakdown
Mechanical
Breakdown
Operational
Breakdown
Grand
Total
Adjust PEC/PX 9.14 0.17 9.31
Bent Lugs 3.32 3.32
Bolt/Fixings Fault 17.25 0.29 17.53
⊘ This is a preview!⊘
Do you want full access?
Subscribe today to unlock all pages.

Trusted by 1+ million students worldwide

Broken Bridge 0.86 0.86
Chain/Conveyor/Link Failure 0.10 0.10
Checksheet 32.06 32.06
Communications/Programming
Fault 0.17 0.17
Component Damage 2.36 46.13 1.04 49.52
Conveyor Tension or Alignment
Fault 2.54 0.24 2.78
Electrical Drive Fault 0.28 0.28
Electrical Fault 6.01 0.09 6.09
Fallen Product 0.18 19.06 19.24
Guide Damage/Alignment Fault 1.15 0.43 1.58
Heavy Scrap 0.21 0.21
Hydraulic Cylinder Fault 0.17 0.17
Hydraulic Hose Leak 4.63 4.63
Hydraulic System Fault 0.28 0.28
Light Scrap 0.08 0.08
Machine Fault - Operator Please
Pick Correct Reason 0.12 0.12
Machine Isolated 0.13 4.54 4.67
Machine Zone 1 Manual
Operation 0.13 0.13
Machine Zone 2 Manual
Operation 0.59 0.81 1.40
No 3 Wash Pump Fault 0.26 0.26
Out of Auto 0.19 0.19
Out of Auto Fault 0.76 0.76
Overrun Fault 1.54 1.54
Position Fault 0.13 0.28 2.78 3.20
Product Misalignment 1.43 1.43
Pull Chord Fault/Reset/Failure 0.63 0.33 0.95
Replace PEC/PX 4.77 4.77
Safety Relay 0.68 0.68
Schedule Complete 8.47 8.47
Standby 0.40 1.77 2.17
Steam (Low Temp) 3.05 3.05
Stop Position Fault 0.42 0.18 1.42 2.03
Testing/Commissioning 1.92 1.92
Thin Cathode 0.33 0.33
Transfer Striker Fault 1.90 0.51 2.41
Trip Tab Too High Fault 0.73 0.16 0.89
Turntable Fault 17.39 17.39
Utilities Fault 0.17 0.17
Weld Repair 2.47 2.47
Grand Total 26.27 91.30 92.04 209.62
Paraphrase This Document
Need a fresh take? Get an instant paraphrase of this document with our AI Paraphraser

On the basis of above table, it may be seen that the highest downtime for Electrical, Mechanical and
Operational breakdown has been observed for Component Damage and has been one of the major
reason for the machinery poor performance. Also, Check sheet is also one of the significant reason
for downtime of machinery. In addition to above, the highest downtime has been observed for
operational breakdown followed by Mechanical breakdown and electrical breakdown.
1 out of 5
Related Documents
Your All-in-One AI-Powered Toolkit for Academic Success.
 +13062052269
info@desklib.com
Available 24*7 on WhatsApp / Email
Unlock your academic potential
Copyright © 2020–2025 A2Z Services. All Rights Reserved. Developed and managed by ZUCOL.


