Inferential Statistics Report: Analysis of Mobile App Data - BUS708
VerifiedAdded on 2022/10/19
|17
|2327
|38
Report
AI Summary
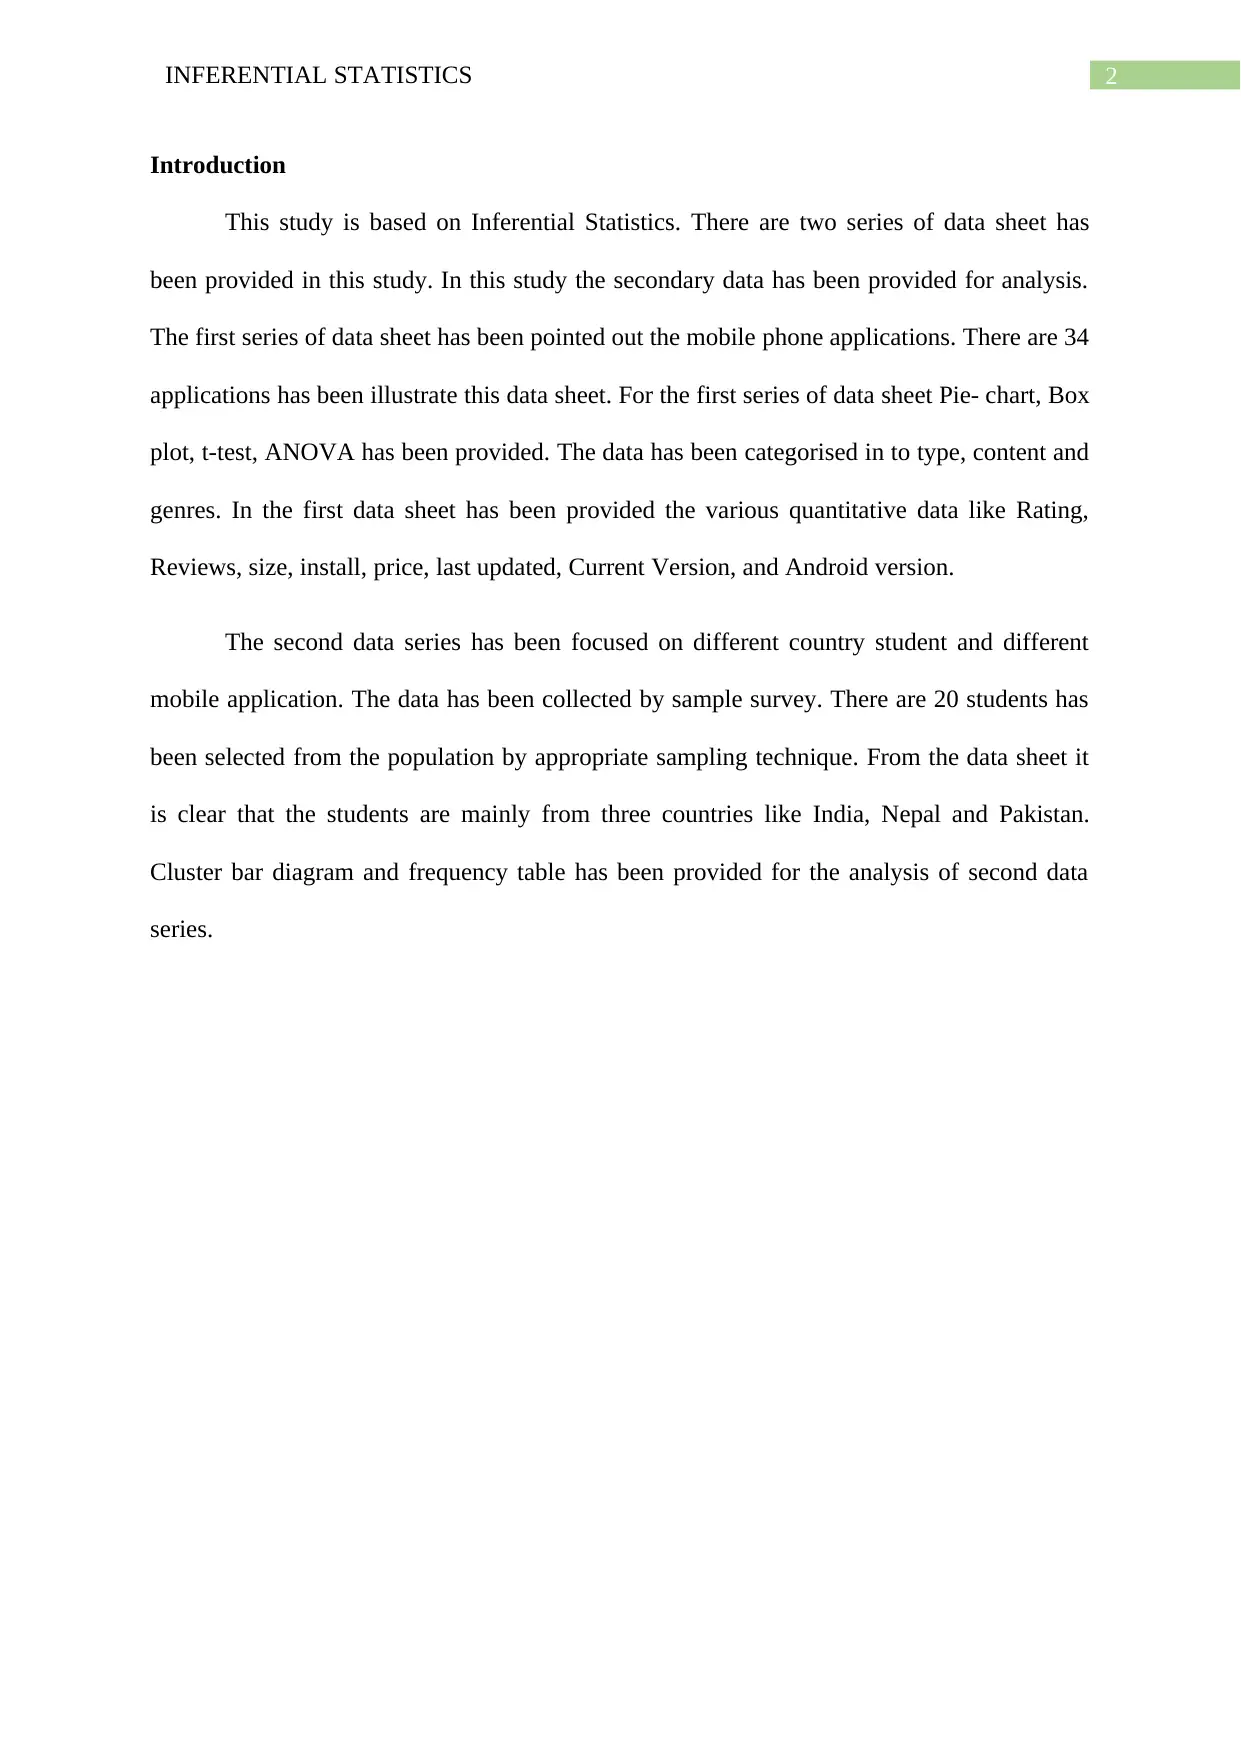
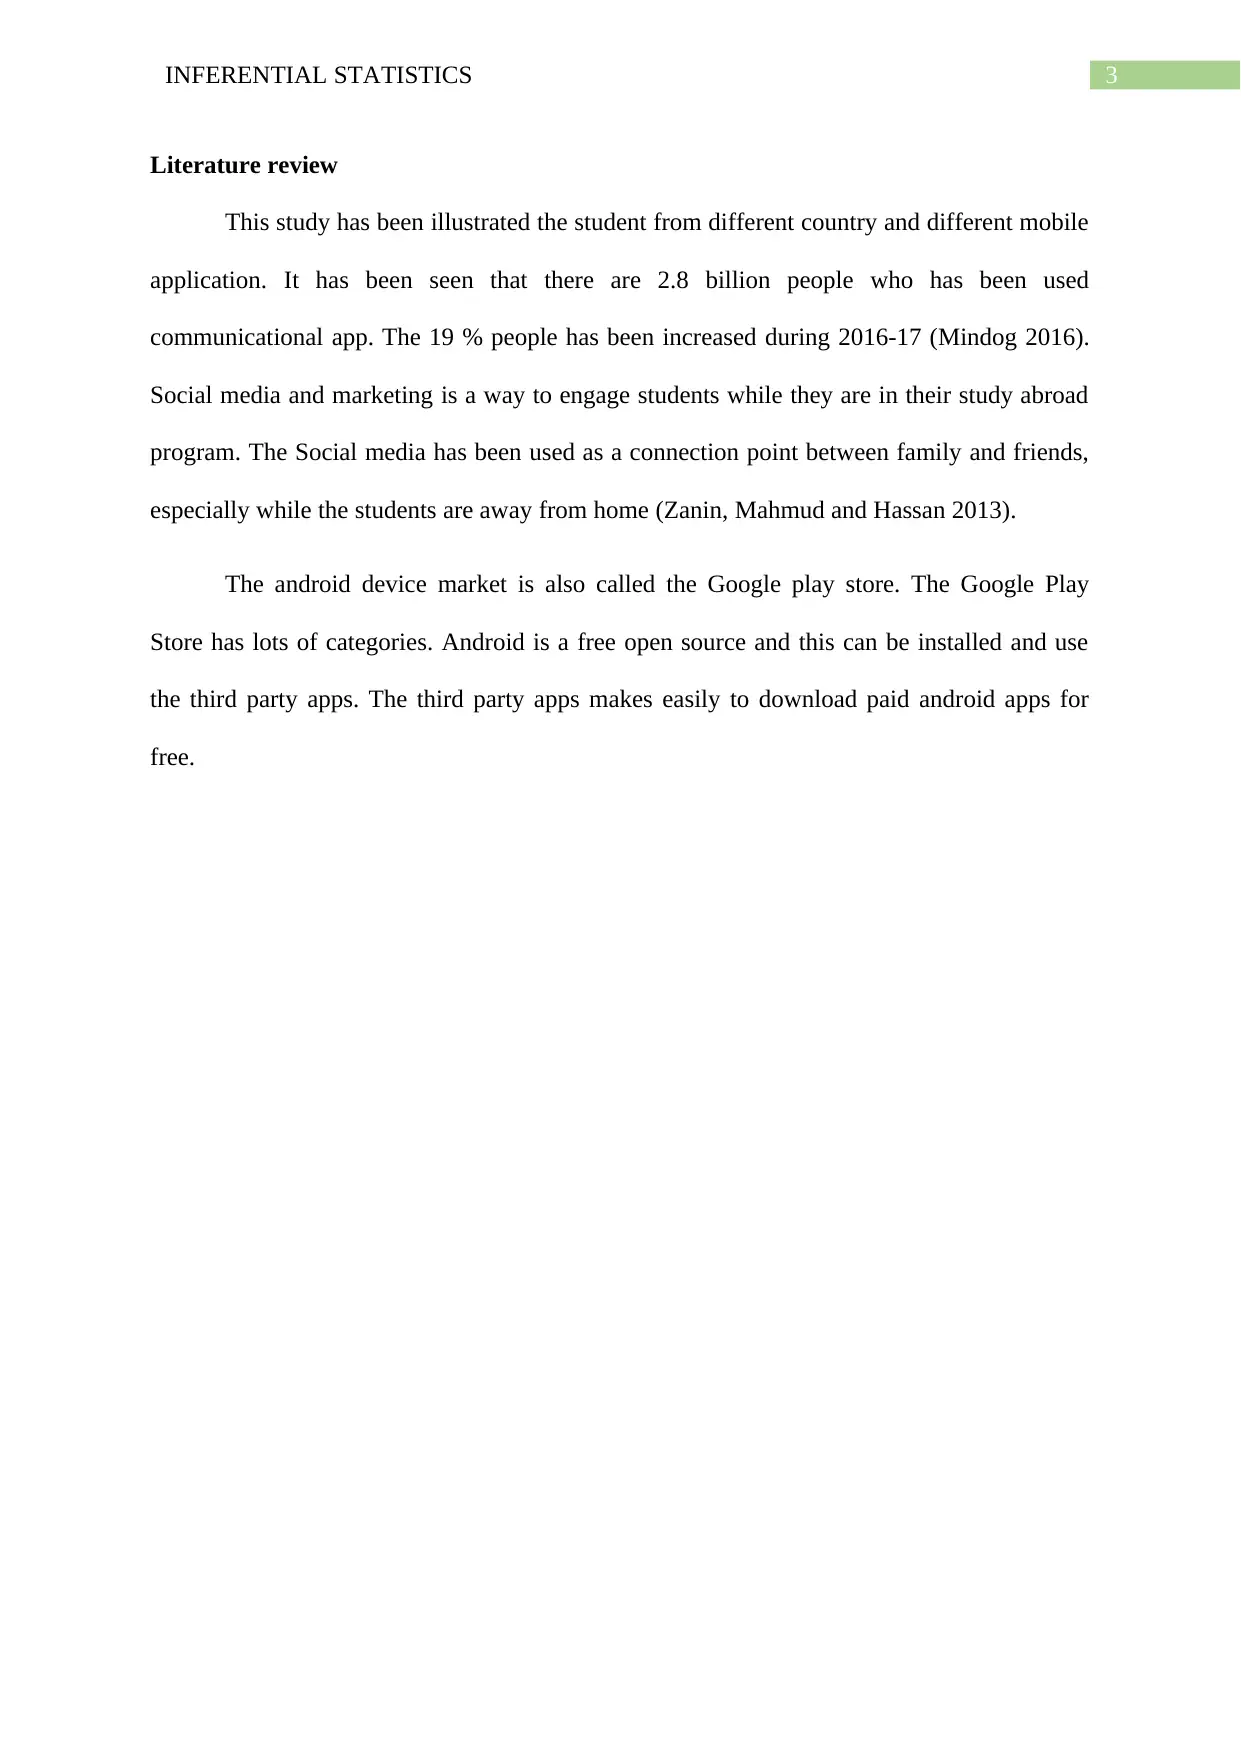
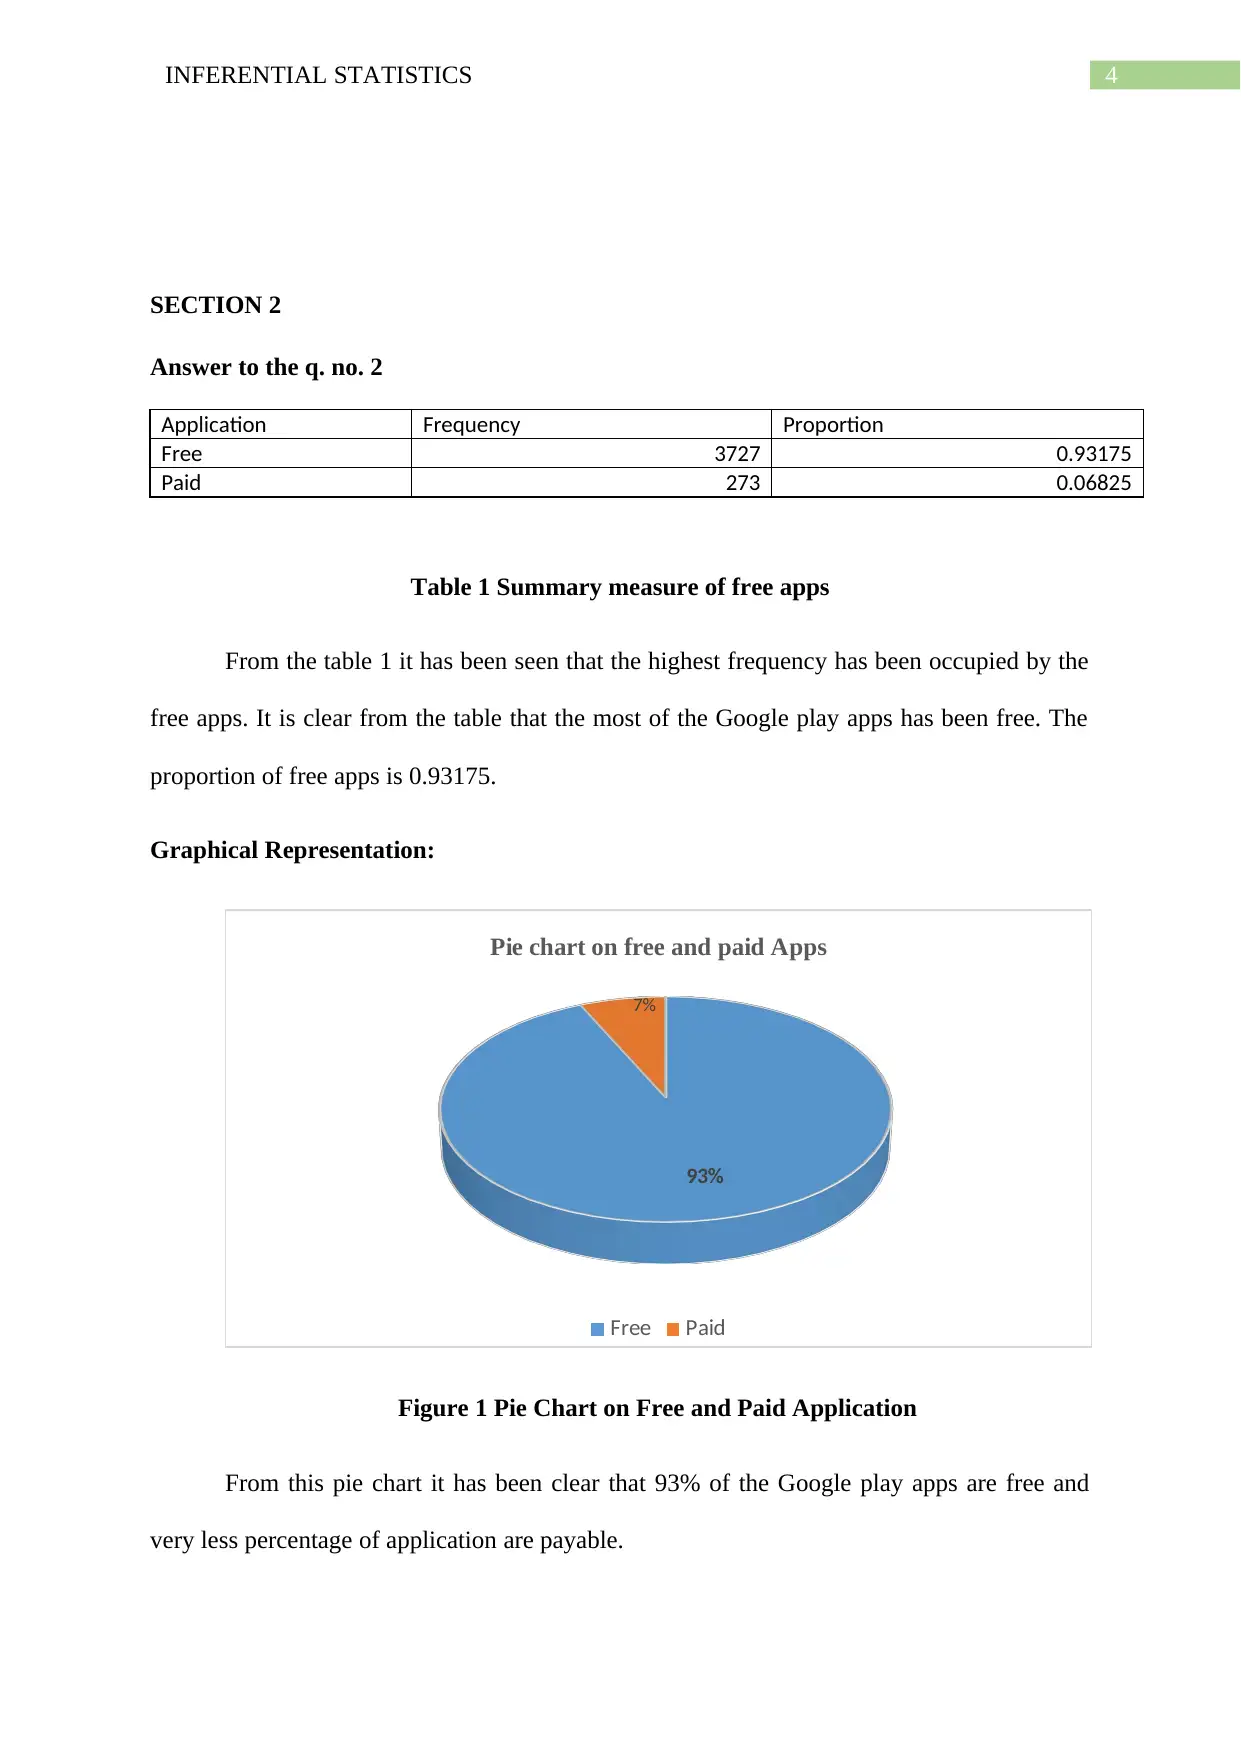
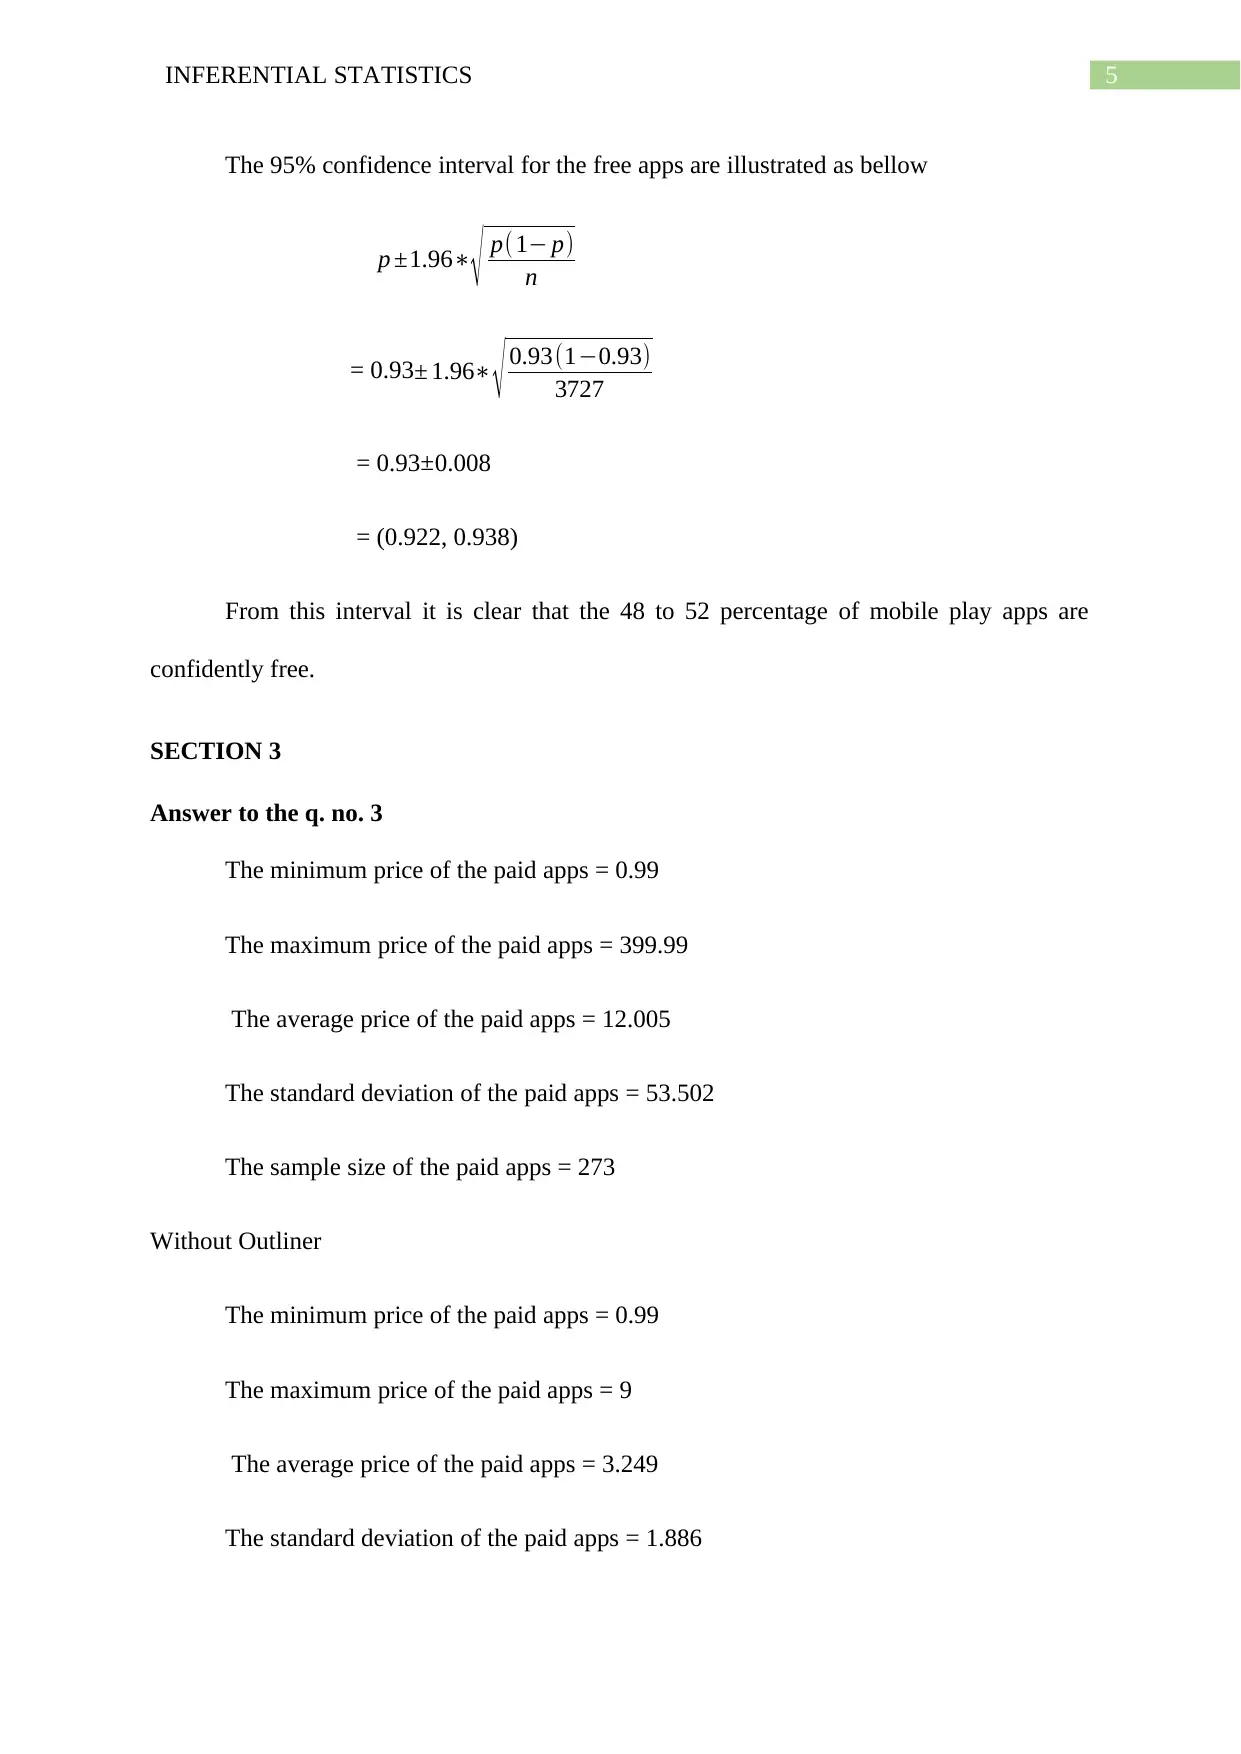
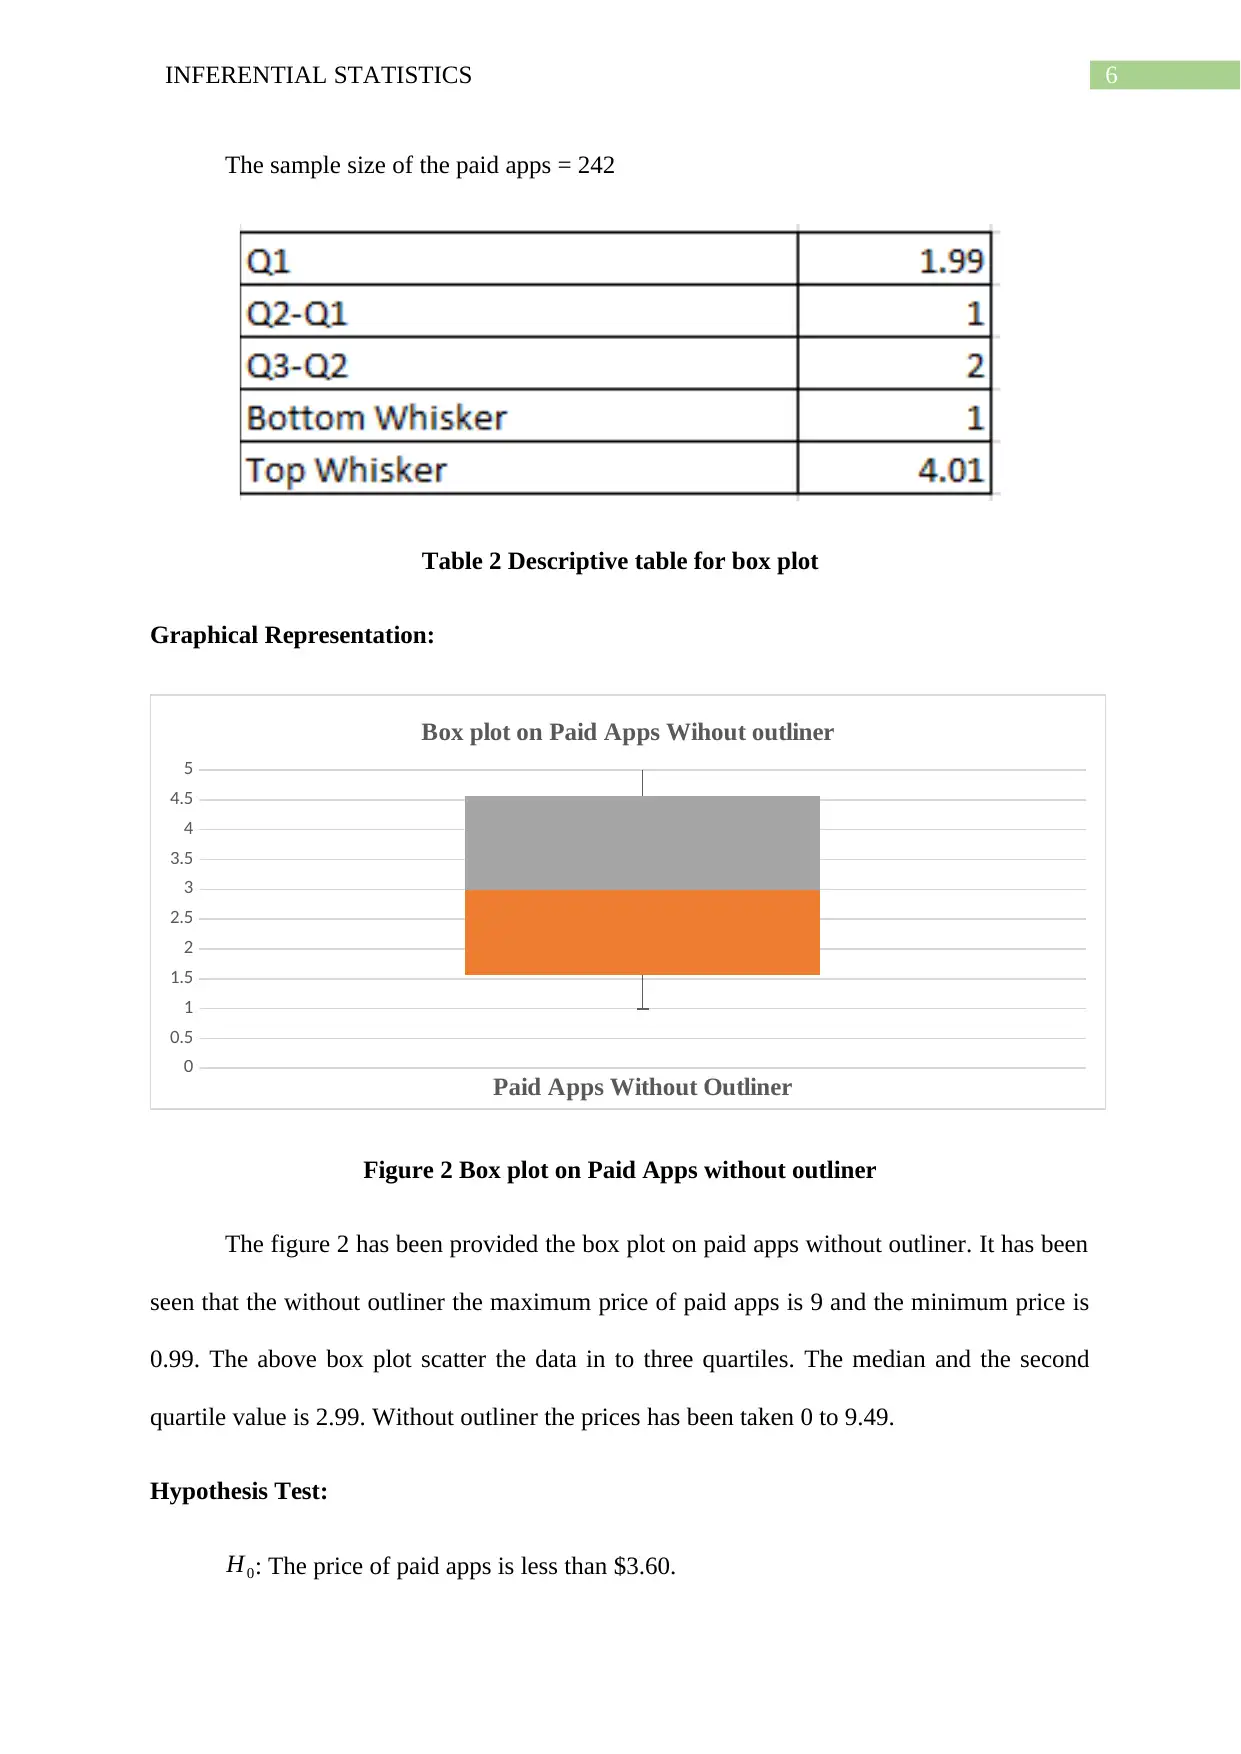
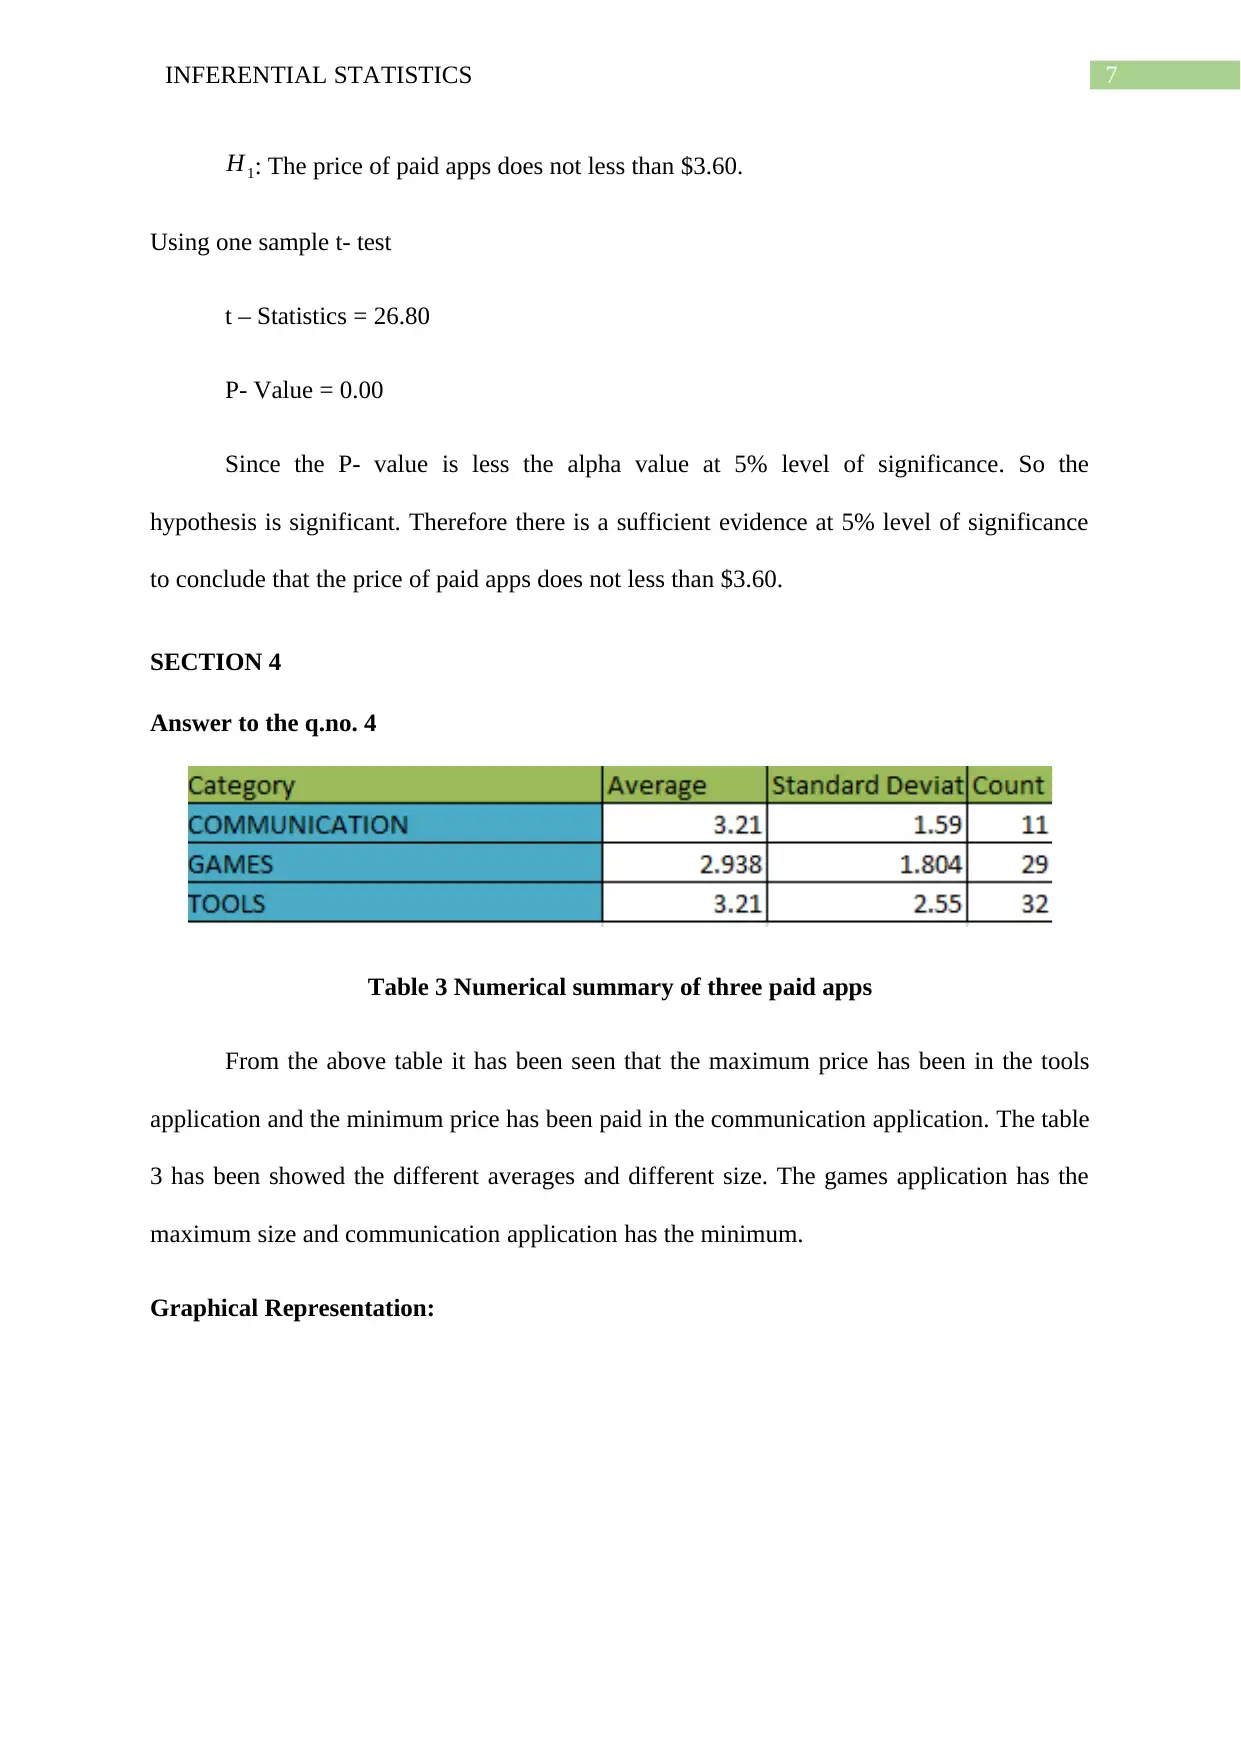
This report presents an analysis of two datasets using inferential statistics. The first dataset focuses on mobile phone applications, examining aspects like app type (free vs. paid), prices, categories, ratings, and reviews using techniques such as pie charts, box plots, t-tests, ANOVA, and regression analysis. The second dataset analyzes student usage of different communication apps across various countries, employing cluster bar diagrams and frequency tables. Key findings include the prevalence of free apps, price comparisons across app categories, the relationship between ratings and reviews, and the association between country and app preference. The report concludes with recommendations for app usage and highlights the importance of understanding statistical concepts for data-driven decision-making. The analysis includes hypothesis testing to determine statistical significance and provide insights into the data.

Running head: INFERENTIAL STATISTICS
Inferential Statistics
Name of the Student:
Name of the University:
Author Note:
Inferential Statistics
Name of the Student:
Name of the University:
Author Note:
Paraphrase This Document
Need a fresh take? Get an instant paraphrase of this document with our AI Paraphraser

1INFERENTIAL STATISTICS
Table of Contents
SECTION 1................................................................................................................................2
Introduction............................................................................................................................2
Literature review....................................................................................................................3
SECTION 2................................................................................................................................4
Answer to the q. no. 2............................................................................................................4
SECTION 3................................................................................................................................5
Answer to the q. no. 3............................................................................................................5
SECTION 4................................................................................................................................8
Answer to the q.no. 4.............................................................................................................8
SECTION 5................................................................................................................................9
Answer to the q.no. 5.............................................................................................................9
SECTION 6..............................................................................................................................11
Answer to the q.no. 6...........................................................................................................11
Conclusion and Recommendation............................................................................................14
References................................................................................................................................15
SECTION 1

2INFERENTIAL STATISTICS
Introduction
This study is based on Inferential Statistics. There are two series of data sheet has
been provided in this study. In this study the secondary data has been provided for analysis.
The first series of data sheet has been pointed out the mobile phone applications. There are 34
applications has been illustrate this data sheet. For the first series of data sheet Pie- chart, Box
plot, t-test, ANOVA has been provided. The data has been categorised in to type, content and
genres. In the first data sheet has been provided the various quantitative data like Rating,
Reviews, size, install, price, last updated, Current Version, and Android version.
The second data series has been focused on different country student and different
mobile application. The data has been collected by sample survey. There are 20 students has
been selected from the population by appropriate sampling technique. From the data sheet it
is clear that the students are mainly from three countries like India, Nepal and Pakistan.
Cluster bar diagram and frequency table has been provided for the analysis of second data
series.
⊘ This is a preview!⊘
Do you want full access?
Subscribe today to unlock all pages.

Trusted by 1+ million students worldwide

3INFERENTIAL STATISTICS
Literature review
This study has been illustrated the student from different country and different mobile
application. It has been seen that there are 2.8 billion people who has been used
communicational app. The 19 % people has been increased during 2016-17 (Mindog 2016).
Social media and marketing is a way to engage students while they are in their study abroad
program. The Social media has been used as a connection point between family and friends,
especially while the students are away from home (Zanin, Mahmud and Hassan 2013).
The android device market is also called the Google play store. The Google Play
Store has lots of categories. Android is a free open source and this can be installed and use
the third party apps. The third party apps makes easily to download paid android apps for
free.
Paraphrase This Document
Need a fresh take? Get an instant paraphrase of this document with our AI Paraphraser

4INFERENTIAL STATISTICS
SECTION 2
Answer to the q. no. 2
Application Frequency Proportion
Free 3727 0.93175
Paid 273 0.06825
Table 1 Summary measure of free apps
From the table 1 it has been seen that the highest frequency has been occupied by the
free apps. It is clear from the table that the most of the Google play apps has been free. The
proportion of free apps is 0.93175.
Graphical Representation:
93%
7%
Pie chart on free and paid Apps
Free Paid
Figure 1 Pie Chart on Free and Paid Application
From this pie chart it has been clear that 93% of the Google play apps are free and
very less percentage of application are payable.

5INFERENTIAL STATISTICS
The 95% confidence interval for the free apps are illustrated as bellow
p ±1.96∗
√ p( 1− p)
n
= 0.93± 1.96∗ √ 0.93(1−0.93)
3727
= 0.93±0.008
= (0.922, 0.938)
From this interval it is clear that the 48 to 52 percentage of mobile play apps are
confidently free.
SECTION 3
Answer to the q. no. 3
The minimum price of the paid apps = 0.99
The maximum price of the paid apps = 399.99
The average price of the paid apps = 12.005
The standard deviation of the paid apps = 53.502
The sample size of the paid apps = 273
Without Outliner
The minimum price of the paid apps = 0.99
The maximum price of the paid apps = 9
The average price of the paid apps = 3.249
The standard deviation of the paid apps = 1.886
⊘ This is a preview!⊘
Do you want full access?
Subscribe today to unlock all pages.

Trusted by 1+ million students worldwide

6INFERENTIAL STATISTICS
The sample size of the paid apps = 242
Table 2 Descriptive table for box plot
Graphical Representation:
Paid Apps Without Outliner
0
0.5
1
1.5
2
2.5
3
3.5
4
4.5
5
Box plot on Paid Apps Wihout outliner
Figure 2 Box plot on Paid Apps without outliner
The figure 2 has been provided the box plot on paid apps without outliner. It has been
seen that the without outliner the maximum price of paid apps is 9 and the minimum price is
0.99. The above box plot scatter the data in to three quartiles. The median and the second
quartile value is 2.99. Without outliner the prices has been taken 0 to 9.49.
Hypothesis Test:
H0: The price of paid apps is less than $3.60.
Paraphrase This Document
Need a fresh take? Get an instant paraphrase of this document with our AI Paraphraser

7INFERENTIAL STATISTICS
H1: The price of paid apps does not less than $3.60.
Using one sample t- test
t – Statistics = 26.80
P- Value = 0.00
Since the P- value is less the alpha value at 5% level of significance. So the
hypothesis is significant. Therefore there is a sufficient evidence at 5% level of significance
to conclude that the price of paid apps does not less than $3.60.
SECTION 4
Answer to the q.no. 4
Table 3 Numerical summary of three paid apps
From the above table it has been seen that the maximum price has been in the tools
application and the minimum price has been paid in the communication application. The table
3 has been showed the different averages and different size. The games application has the
maximum size and communication application has the minimum.
Graphical Representation:

8INFERENTIAL STATISTICS
Figure 3 Histogram on Paid three Categories
The figure 3 has been provided the histogram on communication, games and tools
categories. It has been seen that the average price for communication and tools are equal.
Therefore it has been cleared from the figure that the histogram is symmetrical.
Hypothesis Test:
H0: There is a difference in prices among the three paid apps.
H1: There does not any difference in prices among the three paid apps.
Using one way ANOVA the hypothesis has been tested.
Table 4 ANOVA table
⊘ This is a preview!⊘
Do you want full access?
Subscribe today to unlock all pages.

Trusted by 1+ million students worldwide

9INFERENTIAL STATISTICS
Since the P- Value is larger than the alpha value at 5% level of significance. So the
given hypothesis is not significant. Therefore there is a sufficient evidence at 5% level of
significance to conclude that there is a difference in prices among the three paid apps.
SECTION 5
Answer to the q.no. 5
The regression model for the ratings and reviews as given bellow
Y= β0 +β1 X1
Where Y= Reviews
X1= Ratings
β0And β1are regression coefficient.
Therefore Y= 427098X – 1289979.7
The correlation coefficient between ratings and review = 0.007
That means the correlation is very low between two variable.
The coefficient of determination between ratings and reviews = 0.0052
Hypothesis Test:
H0: There is no relationship between ratings and reviews.
H1: There is a relationship between ratings and reviews.
Paraphrase This Document
Need a fresh take? Get an instant paraphrase of this document with our AI Paraphraser

10INFERENTIAL STATISTICS
Table 5 ANOVA test
Since the P- value is less than the alpha value. So the above hypothesis is significant.
Therefore there is a sufficient evidence at 5% level of significance to conclude that there is a
relationship between ratings and reviews.
Graphical Representation:
Figure 4 Scatter plot on Ratings versus Reviews
The figure 4 has been provided the scatter plot on ratings and reviews. The above
figure has been shown a relationship between two variable. In the X- axis provide the ratings
and in the Y- axis provide the reviews. It is clear from the figure that there is a positive
relationship between two variable. The ratings has been scattered between 1 - 5 and the
reviews has been scattered between 0 - 20000000. Most of the review has been seen between
4 to 5 from 0 – 20000000. There are very few of the data has been fall over 20000000.

11INFERENTIAL STATISTICS
SECTION 6
Answer to the q.no. 6
Table 6 Numerical summary on the students of different country and their
communicational Apps
It has been seen that there are three country and five communicational app has been
provided in the data sheet. Most of the students are from Pakistan. The number of students
are from India is 5. From the table 6 it has been cleared that the Line, Messenger and
Whatsapp communicational app user student is 4. Only the student from Pakistan has been
used the Telegram app. It is to noticeable point that the student from Pakistan has been prefer
all the communicational app. The student from Nepal does not us the Telegram and
Messenger app.
Graphical Representation:
⊘ This is a preview!⊘
Do you want full access?
Subscribe today to unlock all pages.

Trusted by 1+ million students worldwide
1 out of 17
Related Documents

Your All-in-One AI-Powered Toolkit for Academic Success.
+13062052269
info@desklib.com
Available 24*7 on WhatsApp / Email
Unlock your academic potential
Copyright © 2020–2025 A2Z Services. All Rights Reserved. Developed and managed by ZUCOL.