Statistics Homework: Regression Analysis and Hypothesis Testing

Verified

Added on  2023/01/23

|4
|457
|81
Homework Assignment
AI Summary
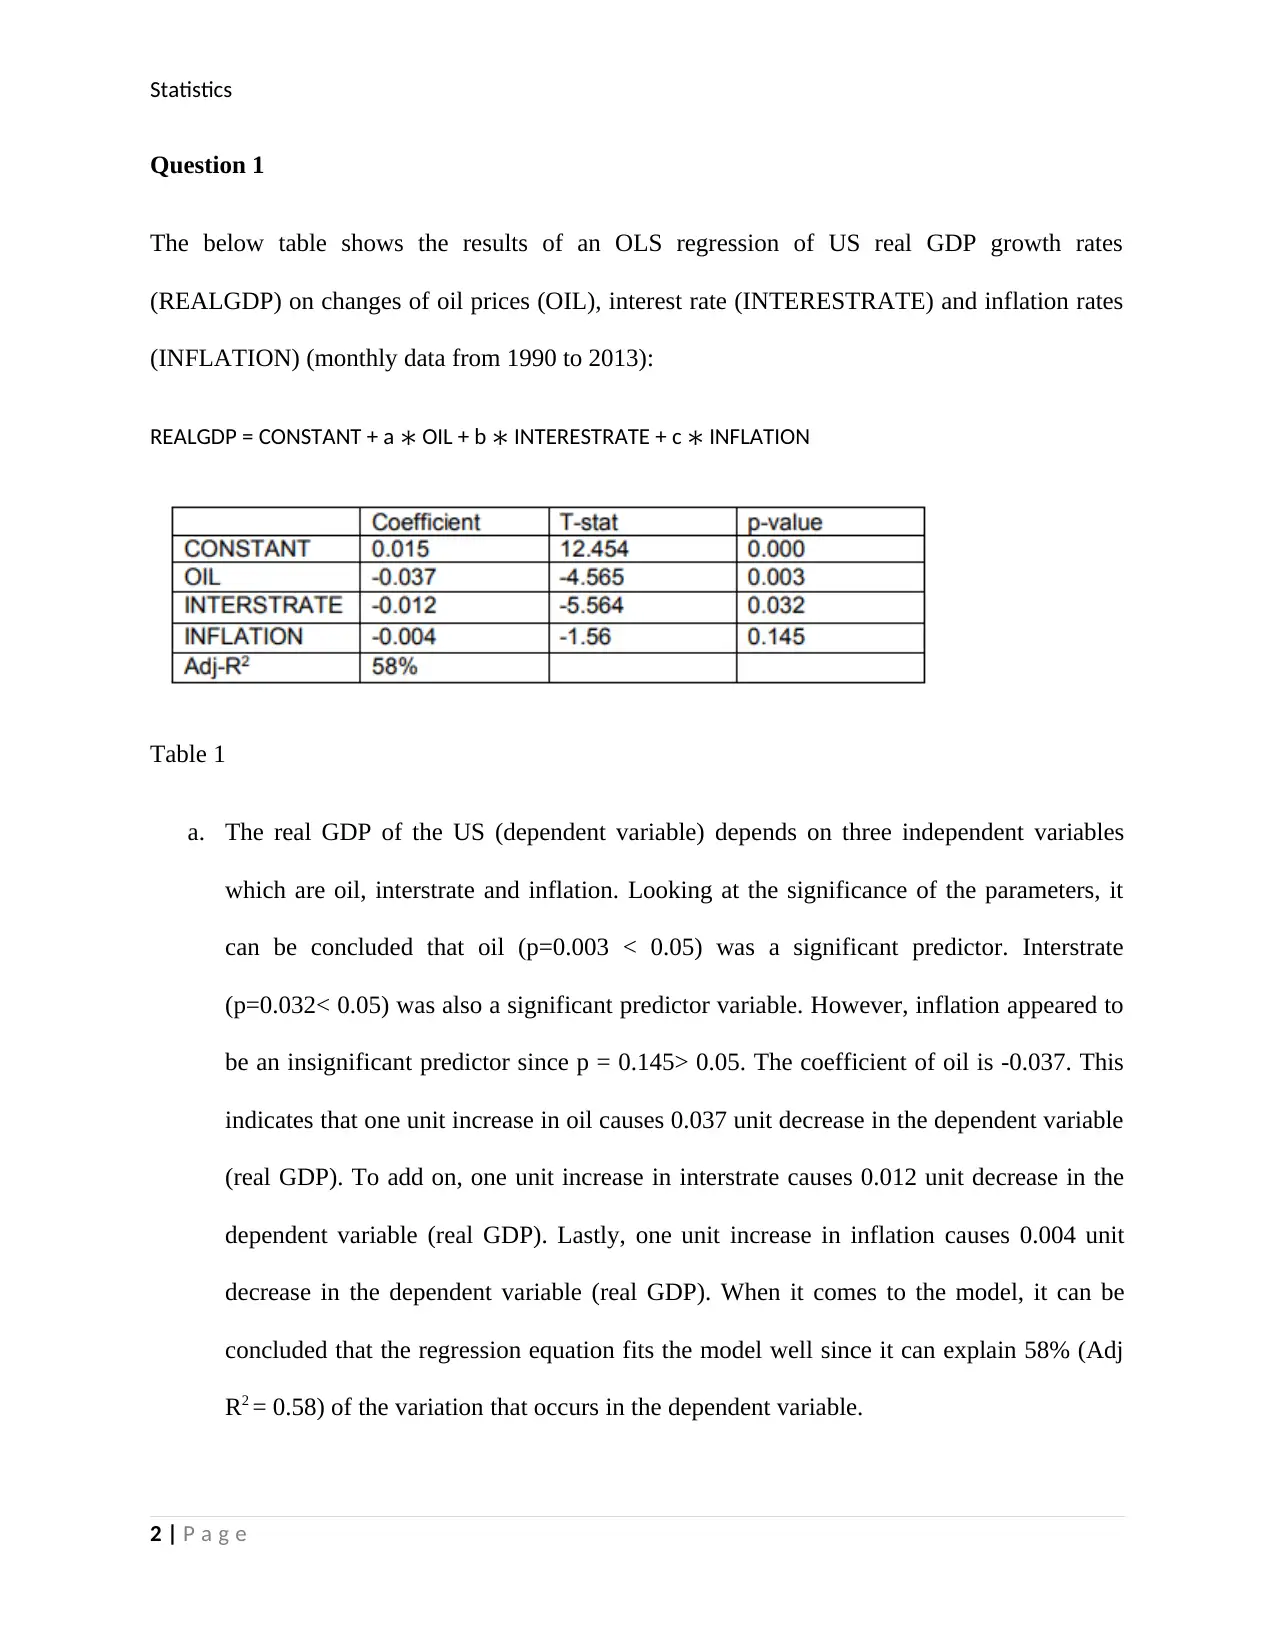
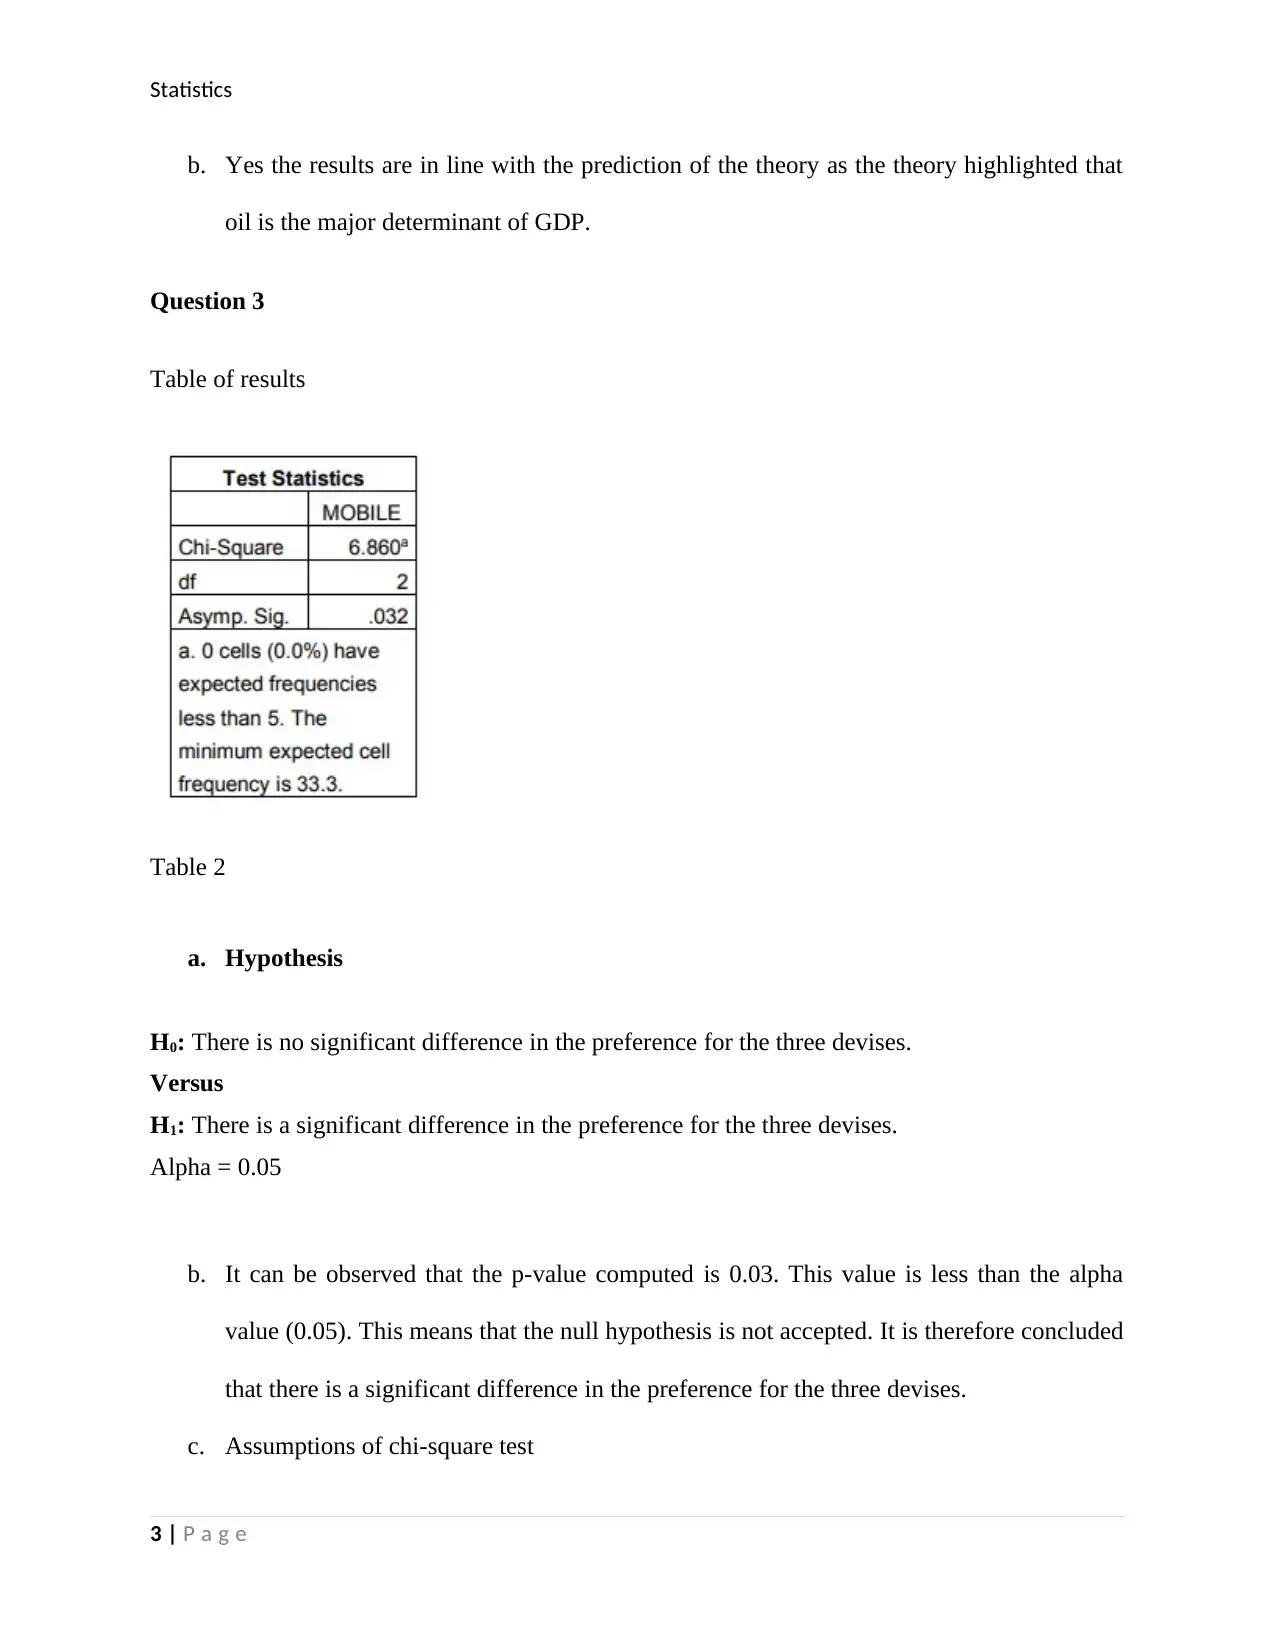
This homework assignment involves the analysis of statistical data using OLS regression and hypothesis testing. The first question focuses on an OLS regression model analyzing the impact of oil prices, interest rates, and inflation on US real GDP growth rates. The student discusses the statistical significance of the parameters, interprets the coefficients, and assesses the overall fit of the model. The second part of the assignment presents a Mann-Whitney test comparing the distribution of productivity between different employee groups. The student identifies the null and alternative hypotheses, interprets the p-value, and discusses the assumptions of the chi-square test. The solution demonstrates a clear understanding of statistical concepts, the interpretation of statistical outputs, and the ability to draw meaningful conclusions from the data.
Document Page
Statistics
Statistics
Student name:
Tutor name:
1 | P a g e
tabler-icon-diamond-filled.svg

Paraphrase This Document

Need a fresh take? Get an instant paraphrase of this document with our AI Paraphraser
Document Page
Statistics
Question 1
The below table shows the results of an OLS regression of US real GDP growth rates
(REALGDP) on changes of oil prices (OIL), interest rate (INTERESTRATE) and inflation rates
(INFLATION) (monthly data from 1990 to 2013):
REALGDP = CONSTANT + a OIL + b INTERESTRATE + c INFLATION
Table 1
a. The real GDP of the US (dependent variable) depends on three independent variables
which are oil, interstrate and inflation. Looking at the significance of the parameters, it
can be concluded that oil (p=0.003 < 0.05) was a significant predictor. Interstrate
(p=0.032< 0.05) was also a significant predictor variable. However, inflation appeared to
be an insignificant predictor since p = 0.145> 0.05. The coefficient of oil is -0.037. This
indicates that one unit increase in oil causes 0.037 unit decrease in the dependent variable
(real GDP). To add on, one unit increase in interstrate causes 0.012 unit decrease in the
dependent variable (real GDP). Lastly, one unit increase in inflation causes 0.004 unit
decrease in the dependent variable (real GDP). When it comes to the model, it can be
concluded that the regression equation fits the model well since it can explain 58% (Adj
R2 = 0.58) of the variation that occurs in the dependent variable.
2 | P a g e
Document Page
Statistics
b. Yes the results are in line with the prediction of the theory as the theory highlighted that
oil is the major determinant of GDP.
Question 3
Table of results
Table 2
a. Hypothesis
H0: There is no significant difference in the preference for the three devises.
Versus
H1: There is a significant difference in the preference for the three devises.
Alpha = 0.05
b. It can be observed that the p-value computed is 0.03. This value is less than the alpha
value (0.05). This means that the null hypothesis is not accepted. It is therefore concluded
that there is a significant difference in the preference for the three devises.
c. Assumptions of chi-square test
3 | P a g e
Document Page
Statistics
The data points in the cells should be counts and not percentages.
There should be mutual exclusivity of the levels of the variables involved.
The value of the cells should be more than 5. This was accomplished otherwise
there would be no results.
The groups being compared are independent.
4 | P a g e
chevron_up_icon
1 out of 4
circle_padding
hide_on_mobile
zoom_out_icon
[object Object]