Working with Inferential Statistics: Movie Injury Analysis and Tests

Verified

Added on  2022/11/16

|7
|879
|480
Homework Assignment
AI Summary
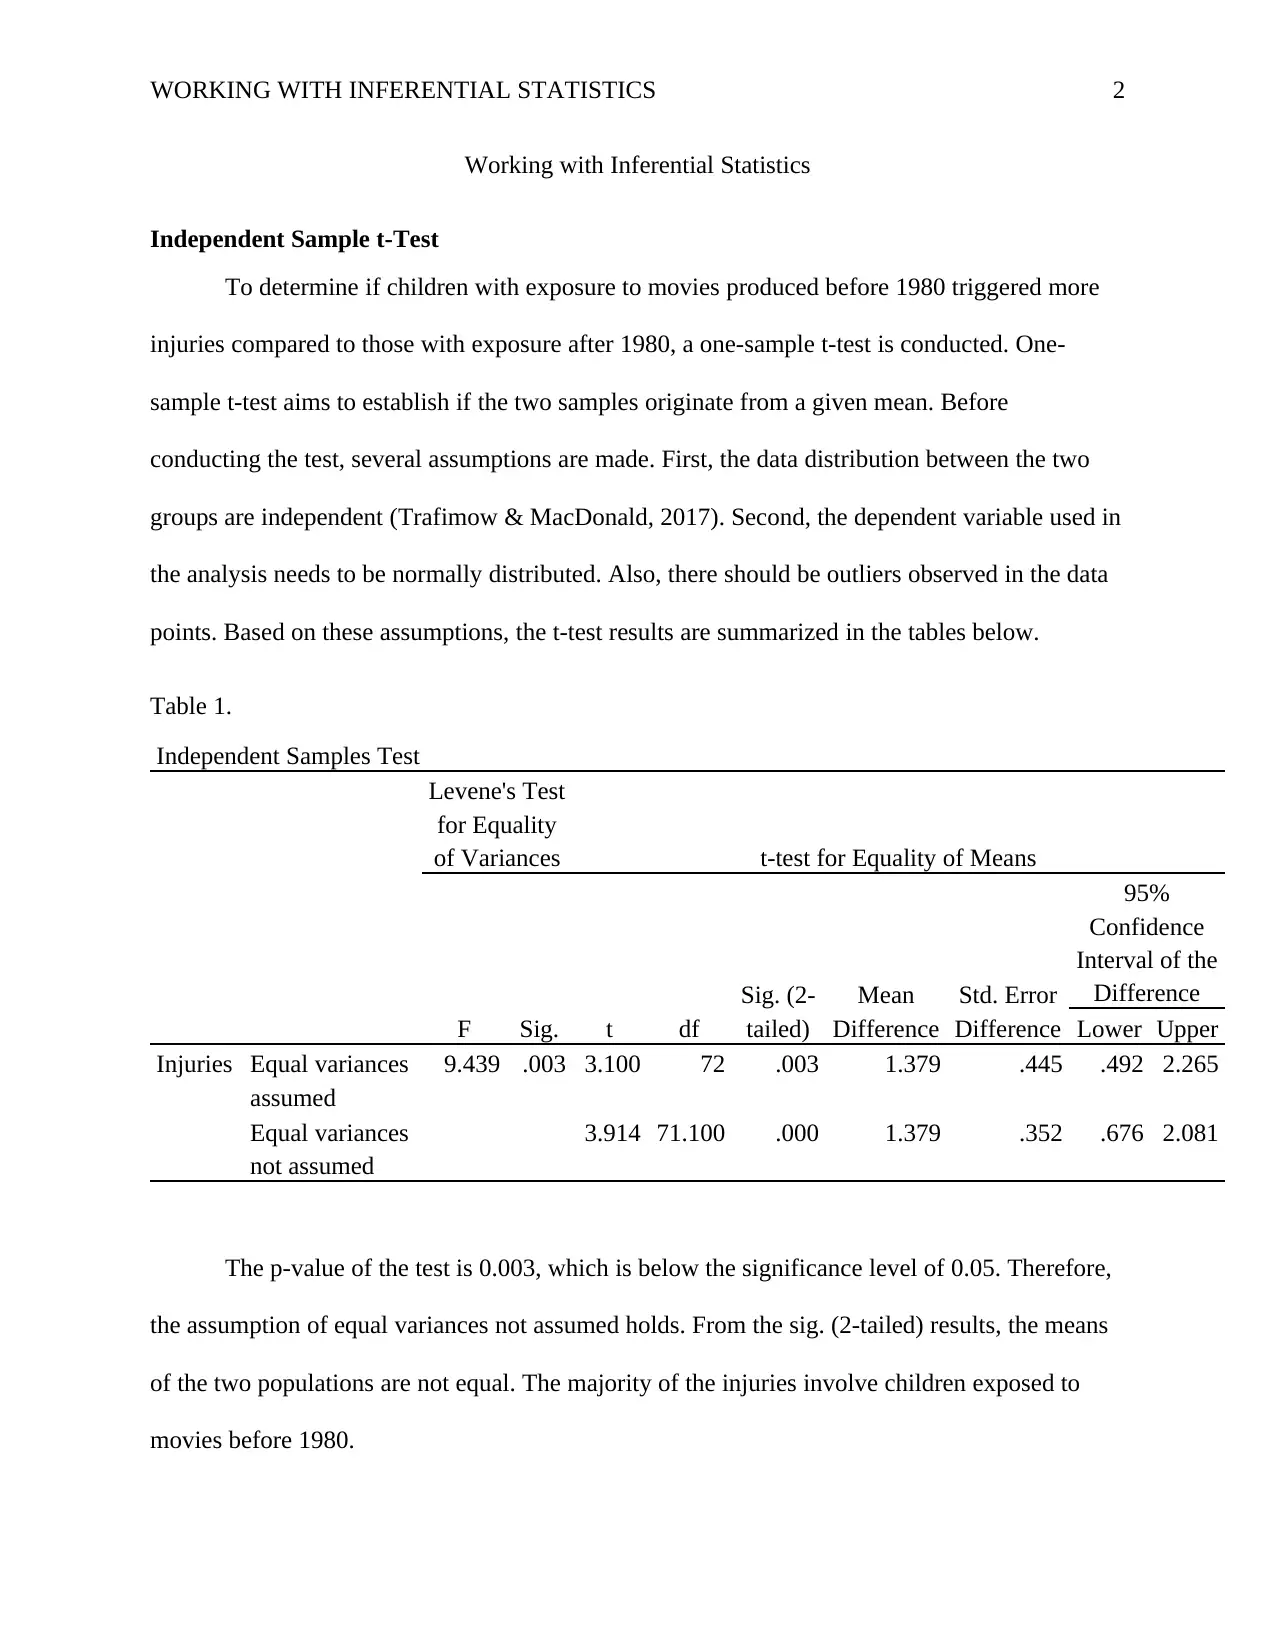
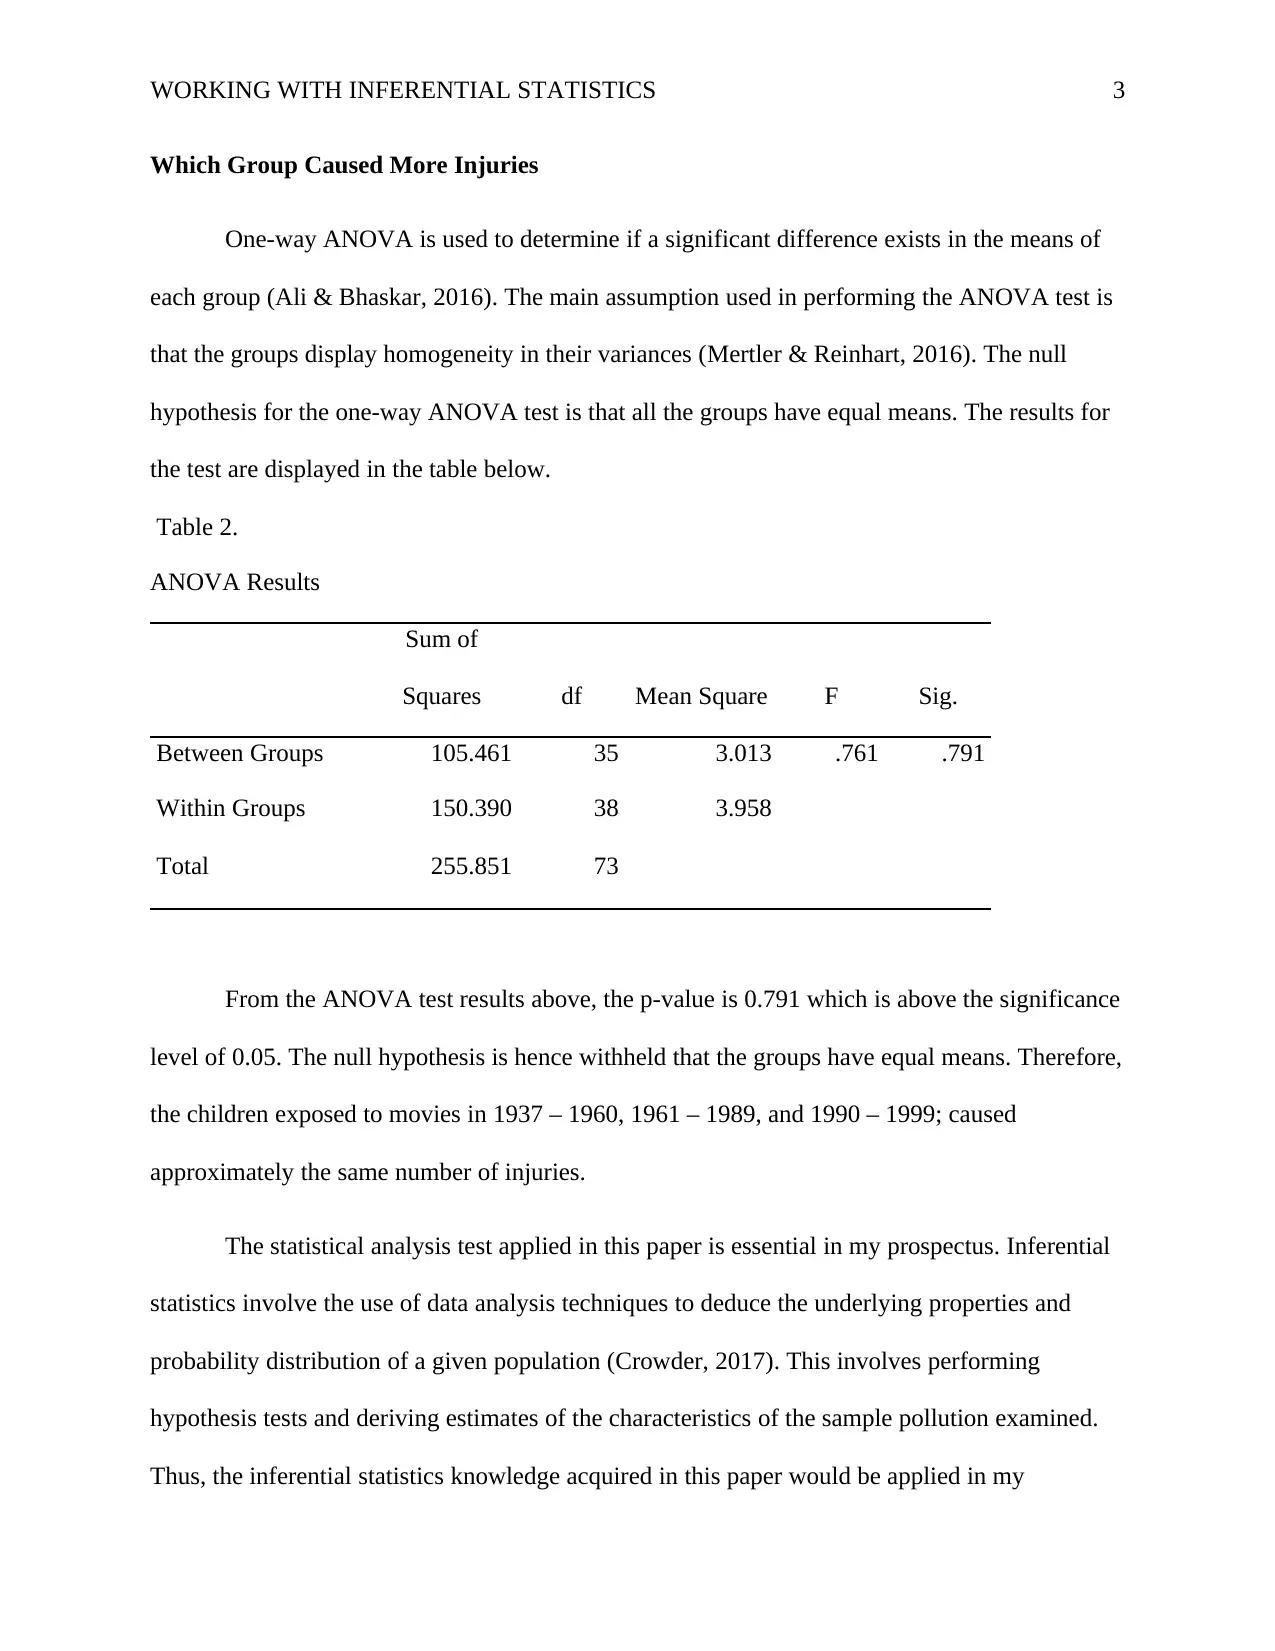
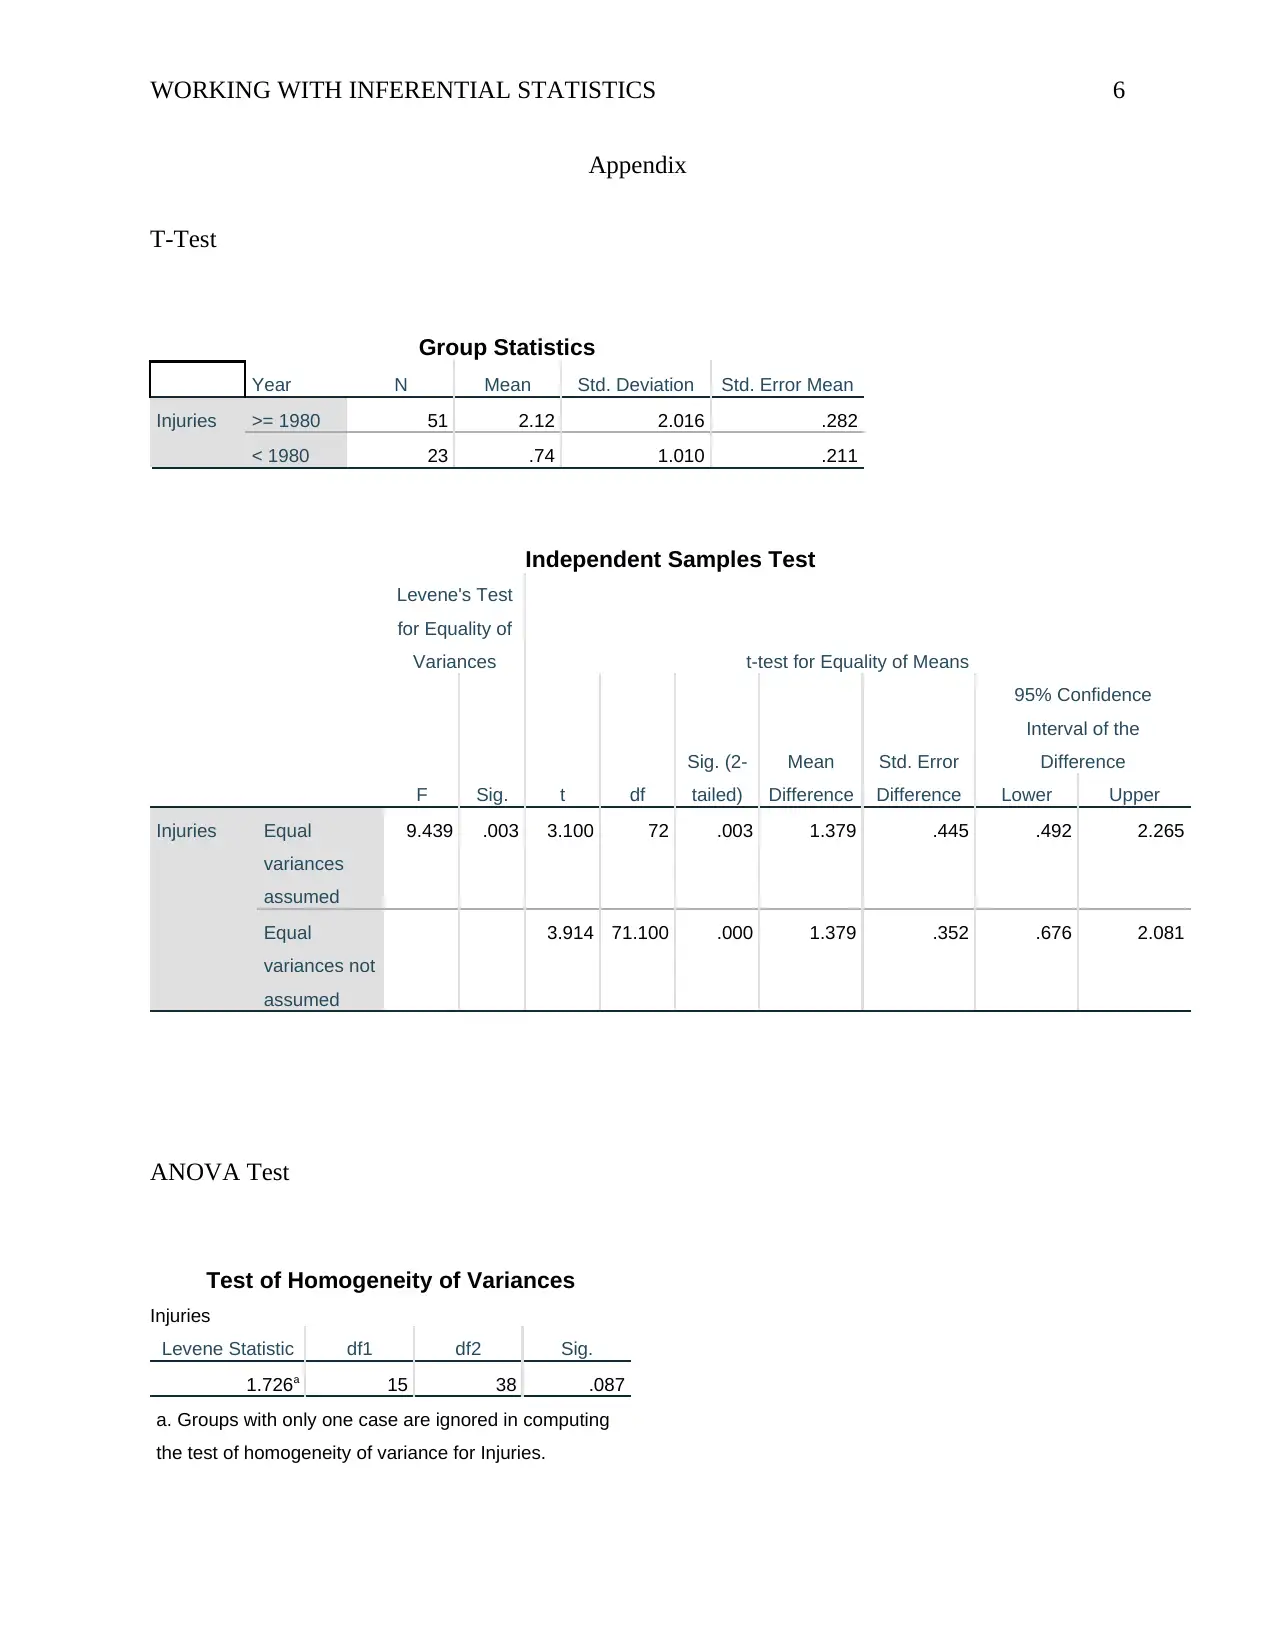
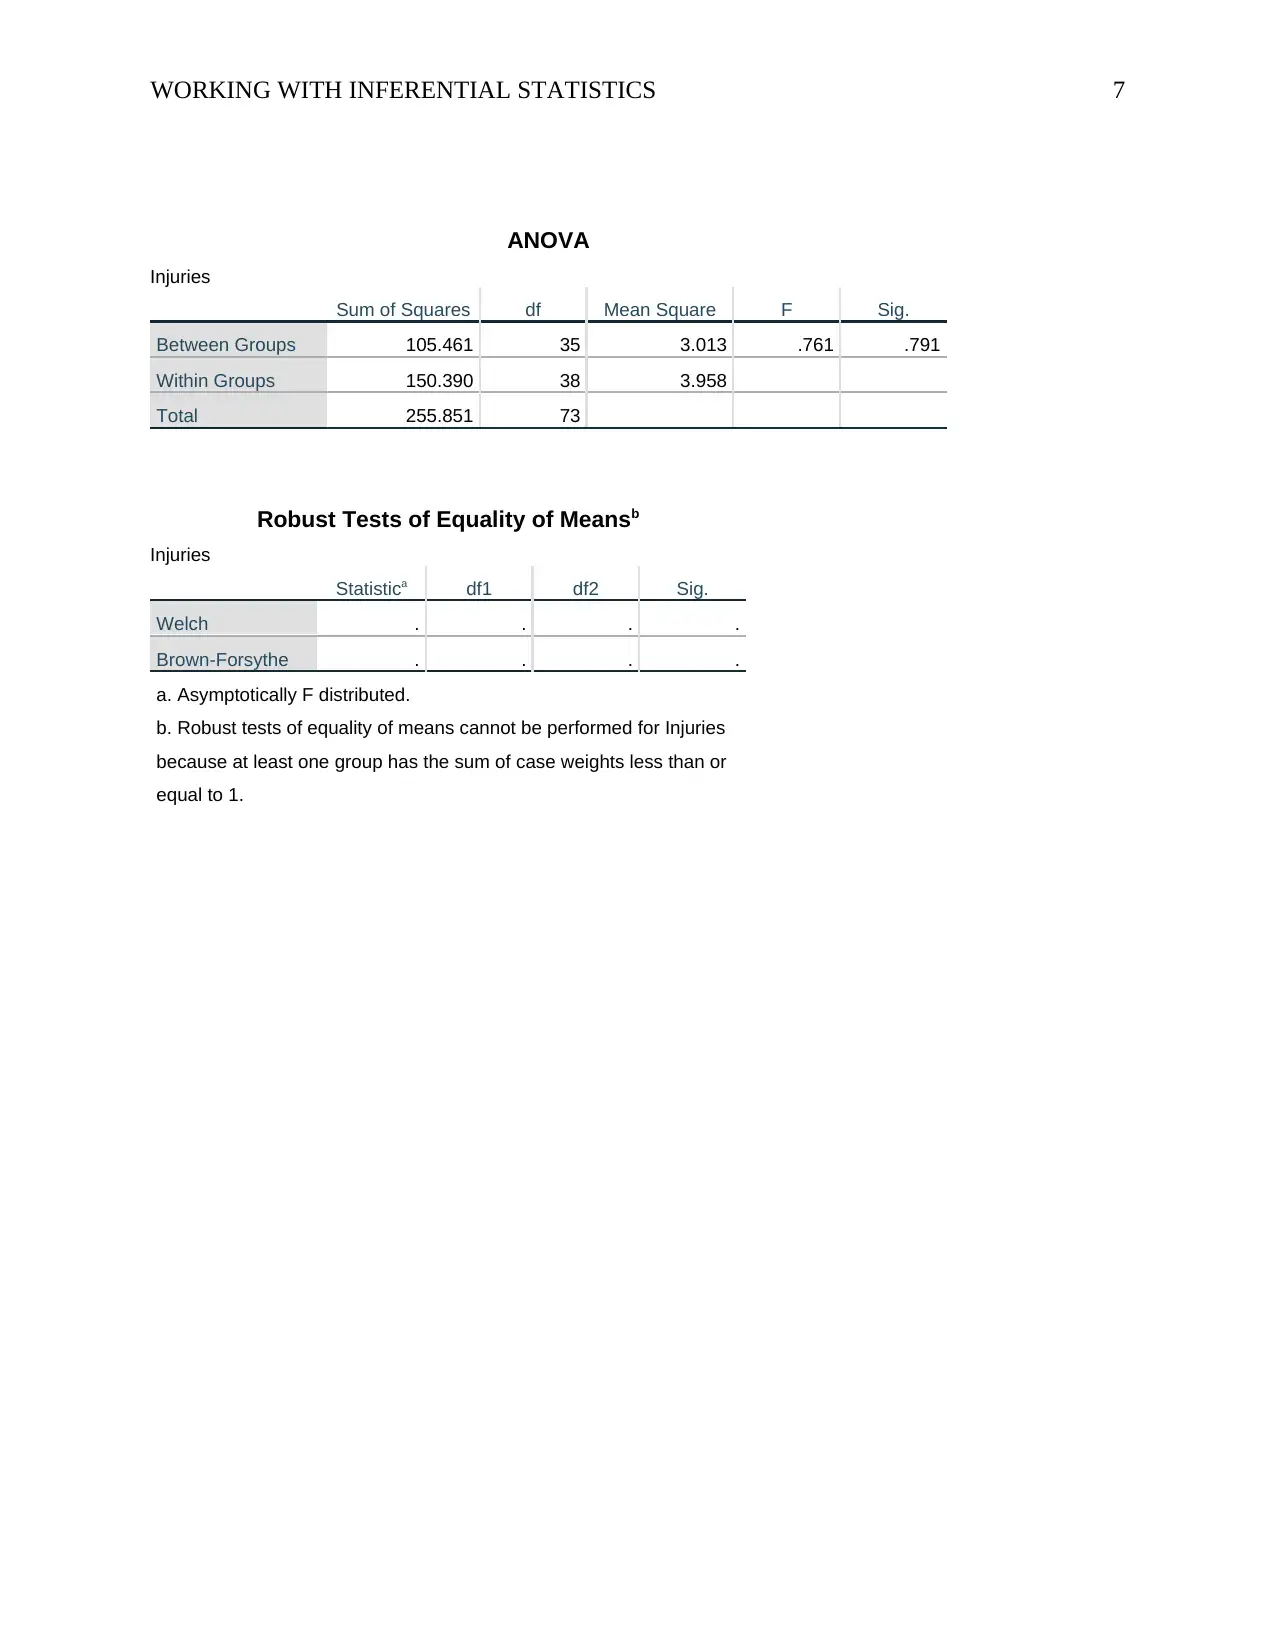
This assignment delves into the application of inferential statistics to analyze the relationship between exposure to movies and the incidence of injuries. The student conducted an independent samples t-test to compare injury rates for children exposed to movies produced before and after 1980, followed by a one-way ANOVA to determine if significant differences exist among different movie release periods. The t-test results showed a significant difference in injury rates, with higher rates associated with movies released before 1980. The ANOVA test indicated that the groups, categorized by movie release periods, had approximately the same number of injuries. The assignment highlights the importance of inferential statistics in making predictions and generalizations from sample data to a larger population, particularly relevant to the student's prospectus. The document includes the statistical analysis results, including tables for t-tests, ANOVA, and group statistics, along with relevant references and appendices.
tabler-icon-diamond-filled.svg

Contribute Materials

Your contribution can guide someone’s learning journey. Share your documents today.
Document Page
Running head: WORKING WITH INFERENTIAL STATISTICS 1
Working with Inferential Statistics
Student name
Institutional affiliation
tabler-icon-diamond-filled.svg

Secure Best Marks with AI Grader

Need help grading? Try our AI Grader for instant feedback on your assignments.
Document Page
WORKING WITH INFERENTIAL STATISTICS 2
Working with Inferential Statistics
Independent Sample t-Test
To determine if children with exposure to movies produced before 1980 triggered more
injuries compared to those with exposure after 1980, a one-sample t-test is conducted. One-
sample t-test aims to establish if the two samples originate from a given mean. Before
conducting the test, several assumptions are made. First, the data distribution between the two
groups are independent (Trafimow & MacDonald, 2017). Second, the dependent variable used in
the analysis needs to be normally distributed. Also, there should be outliers observed in the data
points. Based on these assumptions, the t-test results are summarized in the tables below.
Table 1.
Independent Samples Test
Levene's Test
for Equality
of Variances t-test for Equality of Means
F Sig. t df
Sig. (2-
tailed)
Mean
Difference
Std. Error
Difference
95%
Confidence
Interval of the
Difference
Lower Upper
Injuries Equal variances
assumed
9.439 .003 3.100 72 .003 1.379 .445 .492 2.265
Equal variances
not assumed
3.914 71.100 .000 1.379 .352 .676 2.081
The p-value of the test is 0.003, which is below the significance level of 0.05. Therefore,
the assumption of equal variances not assumed holds. From the sig. (2-tailed) results, the means
of the two populations are not equal. The majority of the injuries involve children exposed to
movies before 1980.
Document Page
WORKING WITH INFERENTIAL STATISTICS 3
Which Group Caused More Injuries
One-way ANOVA is used to determine if a significant difference exists in the means of
each group (Ali & Bhaskar, 2016). The main assumption used in performing the ANOVA test is
that the groups display homogeneity in their variances (Mertler & Reinhart, 2016). The null
hypothesis for the one-way ANOVA test is that all the groups have equal means. The results for
the test are displayed in the table below.
Table 2.
ANOVA Results
Sum of
Squares df Mean Square F Sig.
Between Groups 105.461 35 3.013 .761 .791
Within Groups 150.390 38 3.958
Total 255.851 73
From the ANOVA test results above, the p-value is 0.791 which is above the significance
level of 0.05. The null hypothesis is hence withheld that the groups have equal means. Therefore,
the children exposed to movies in 1937 – 1960, 1961 – 1989, and 1990 – 1999; caused
approximately the same number of injuries.
The statistical analysis test applied in this paper is essential in my prospectus. Inferential
statistics involve the use of data analysis techniques to deduce the underlying properties and
probability distribution of a given population (Crowder, 2017). This involves performing
hypothesis tests and deriving estimates of the characteristics of the sample pollution examined.
Thus, the inferential statistics knowledge acquired in this paper would be applied in my
Document Page
WORKING WITH INFERENTIAL STATISTICS 4
prospectus in making conclusions about a population in experimental studies. Besides,
significant predictions can be made from a small sample analyzed and pertinent generalizations
made about a large population.
tabler-icon-diamond-filled.svg

Secure Best Marks with AI Grader

Need help grading? Try our AI Grader for instant feedback on your assignments.
Document Page
WORKING WITH INFERENTIAL STATISTICS 5
References
Trafimow, D., & MacDonald, J. A. (2017). Performing inferential statistics before data
collection. Educational and psychological measurement, 77(2), 204-219.
Mertler, C. A., & Reinhart, R. V. (2016). Advanced and multivariate statistical methods:
Practical application and interpretation. Routledge.
Ali, Z., & Bhaskar, S. B. (2016). Basic statistical tools in research and data analysis. Indian
journal of anesthesia, 60(9), 662.
Crowder, M. J. (2017). Statistical analysis of reliability data. Routledge.
Document Page
WORKING WITH INFERENTIAL STATISTICS 6
Appendix
T-Test
Group Statistics
Year N Mean Std. Deviation Std. Error Mean
Injuries >= 1980 51 2.12 2.016 .282
< 1980 23 .74 1.010 .211
Independent Samples Test
Levene's Test
for Equality of
Variances t-test for Equality of Means
F Sig. t df
Sig. (2-
tailed)
Mean
Difference
Std. Error
Difference
95% Confidence
Interval of the
Difference
Lower Upper
Injuries Equal
variances
assumed
9.439 .003 3.100 72 .003 1.379 .445 .492 2.265
Equal
variances not
assumed
3.914 71.100 .000 1.379 .352 .676 2.081
ANOVA Test
Test of Homogeneity of Variances
Injuries
Levene Statistic df1 df2 Sig.
1.726a 15 38 .087
a. Groups with only one case are ignored in computing
the test of homogeneity of variance for Injuries.
Document Page
WORKING WITH INFERENTIAL STATISTICS 7
ANOVA
Injuries
Sum of Squares df Mean Square F Sig.
Between Groups 105.461 35 3.013 .761 .791
Within Groups 150.390 38 3.958
Total 255.851 73
Robust Tests of Equality of Meansb
Injuries
Statistica df1 df2 Sig.
Welch . . . .
Brown-Forsythe . . . .
a. Asymptotically F distributed.
b. Robust tests of equality of means cannot be performed for Injuries
because at least one group has the sum of case weights less than or
equal to 1.
chevron_up_icon
1 out of 7
circle_padding
hide_on_mobile
zoom_out_icon
logo.png

Your All-in-One AI-Powered Toolkit for Academic Success.

Available 24*7 on WhatsApp / Email

[object Object]