University of Maryland STAT200 Assignment 3: Statistics Analysis
VerifiedAdded on 2023/05/29
|4
|1405
|295
Homework Assignment
AI Summary
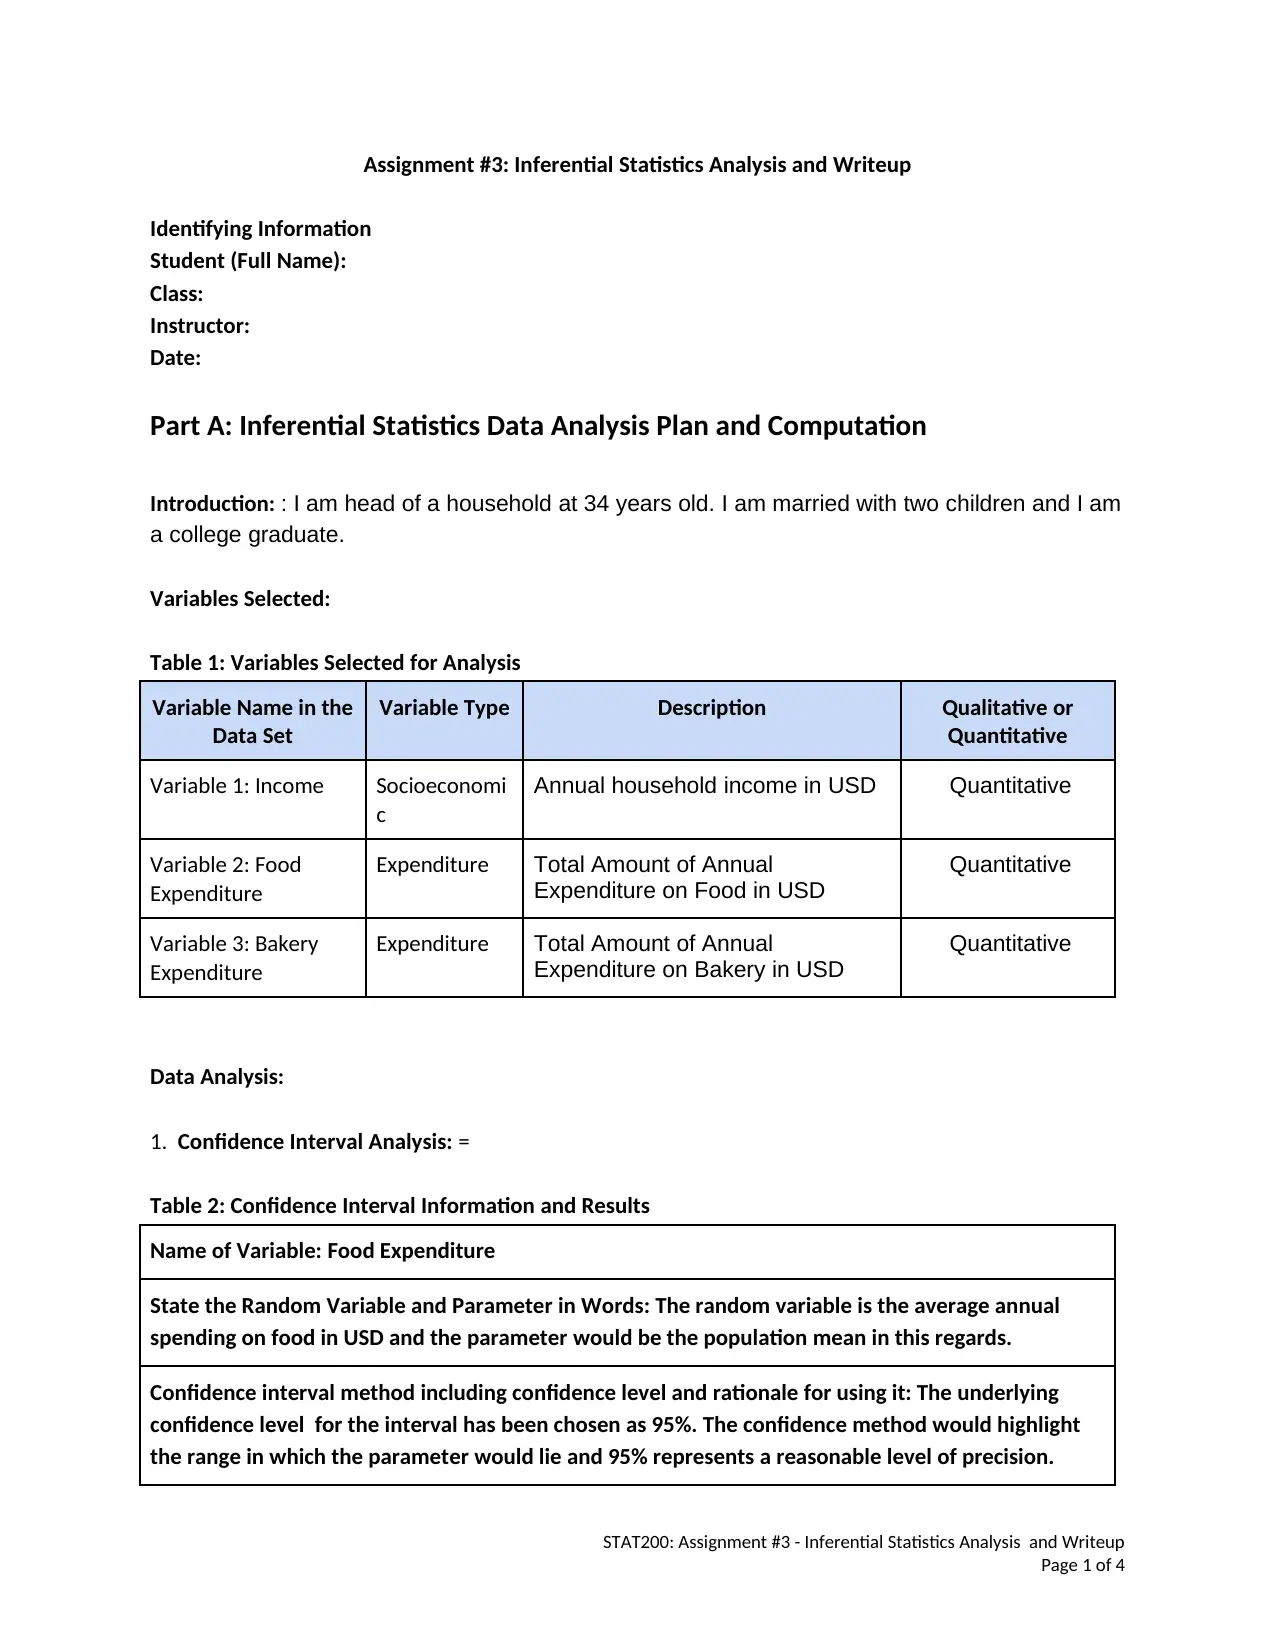
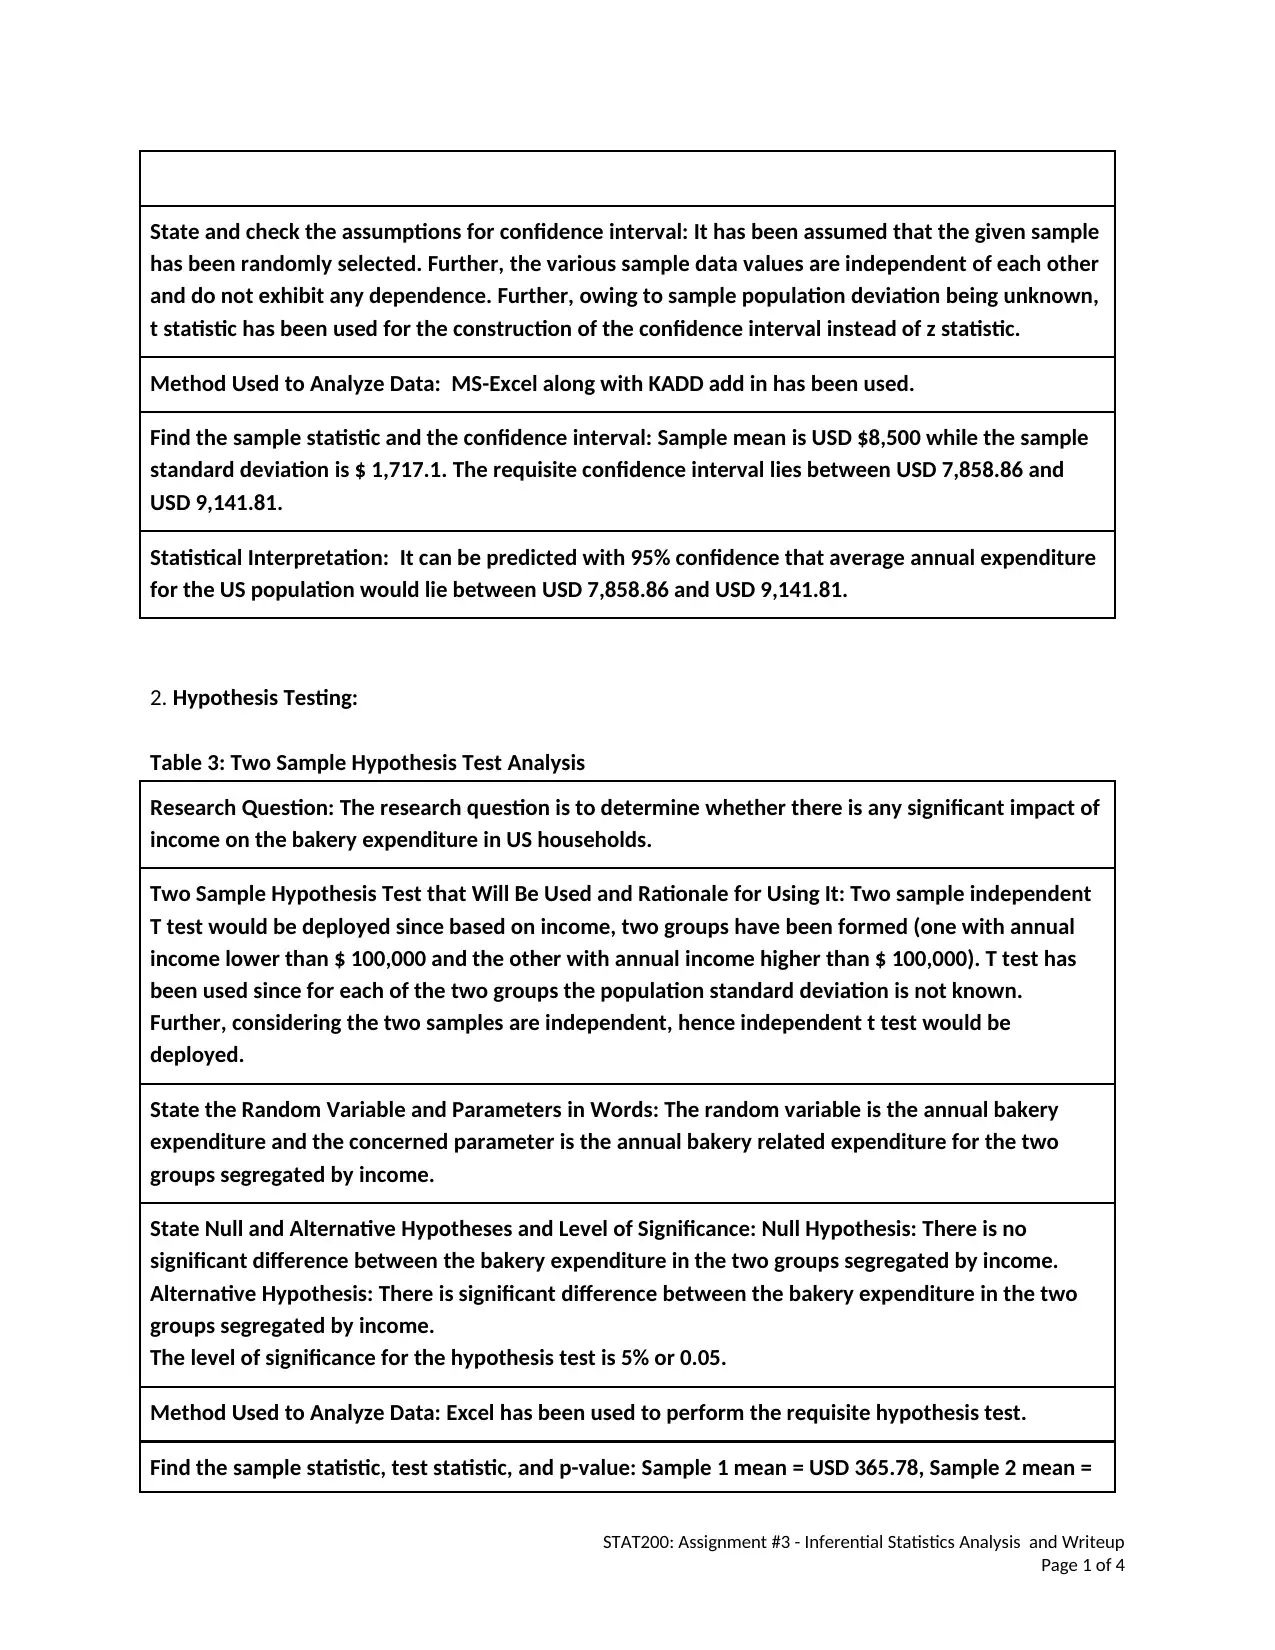
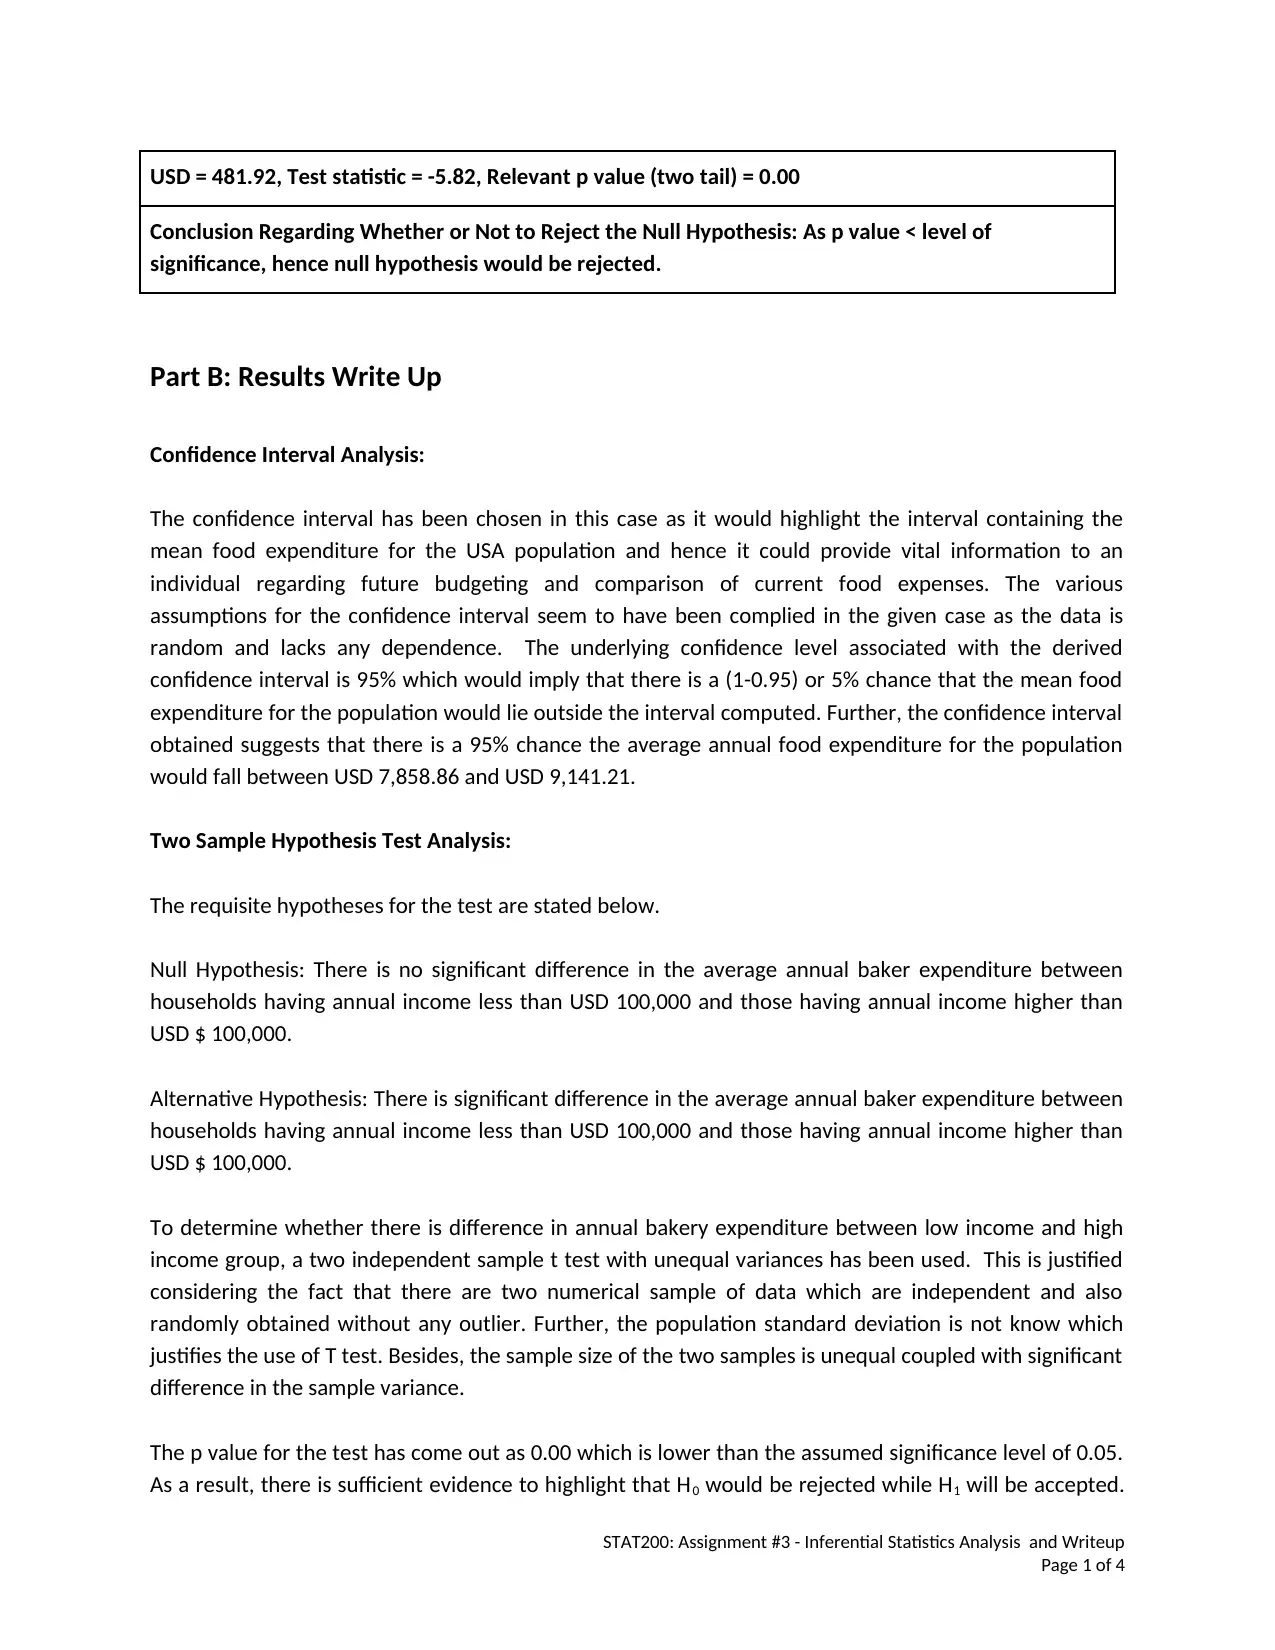
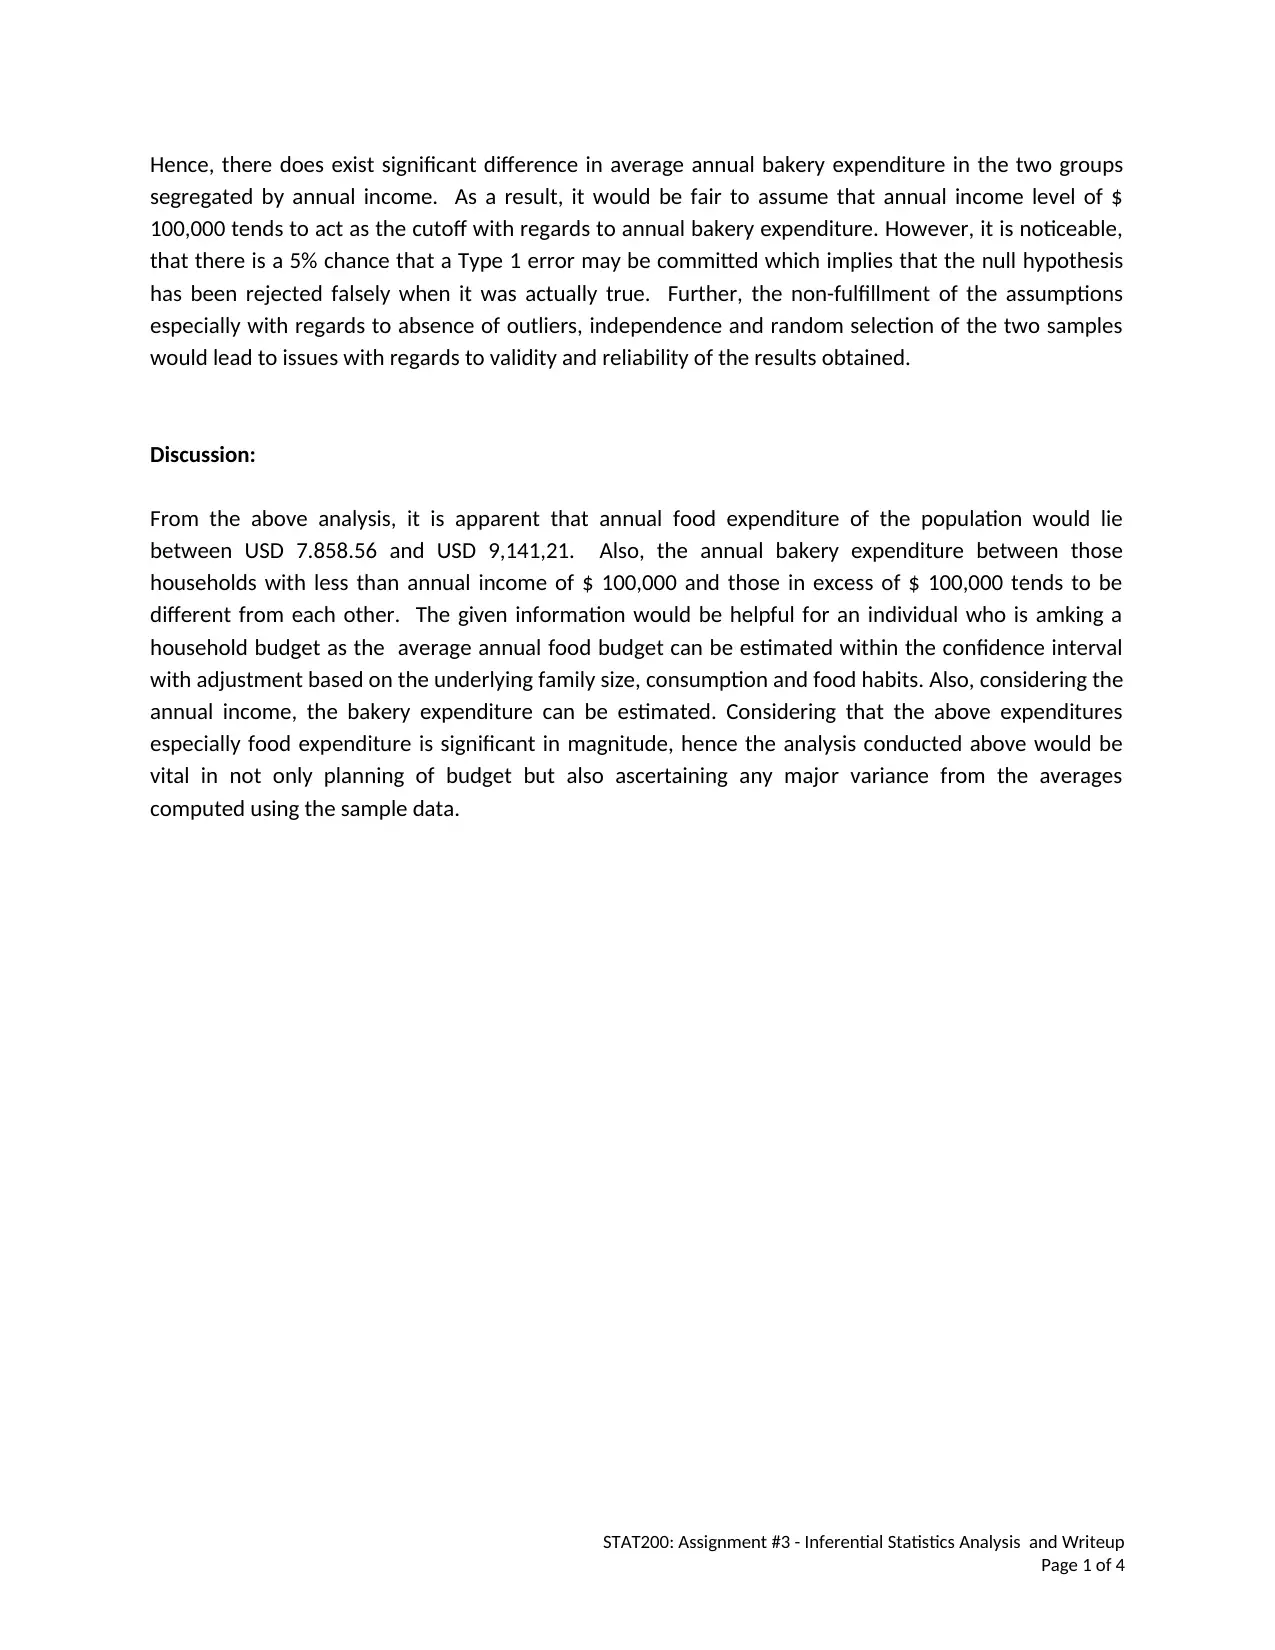
This assignment, completed for a STAT200 Introduction to Statistics course at the University of Maryland, presents an inferential statistics analysis. It begins with the selection of variables, including income and expenditure data, followed by a detailed data analysis plan. The analysis includes the construction and interpretation of a 95% confidence interval for food expenditure, revealing the likely range of average annual spending. Furthermore, the assignment conducts a two-sample independent t-test to investigate the impact of income on bakery expenditure, leading to the rejection of the null hypothesis and the conclusion that there is a significant difference in bakery spending between income groups. The results are thoroughly discussed, highlighting the practical implications of the findings for budgeting and expenditure planning, while also acknowledging potential limitations related to data assumptions. The analysis is performed using MS-Excel with the KADD add-in.
1 out of 4
Related Documents


Your All-in-One AI-Powered Toolkit for Academic Success.
+13062052269
info@desklib.com
Available 24*7 on WhatsApp / Email
![[object Object]](/_next/static/media/star-bottom.7253800d.svg)
Copyright © 2020–2026 A2Z Services. All Rights Reserved. Developed and managed by ZUCOL.