Analyzing the Impact of Inflation on Cash Rate Policy in Australia
VerifiedAdded on 2020/07/23
|19
|4464
|39
AI Summary
This assignment delves into the intricate relationship between inflation rates and cash rate policies within the Australian economy. By analyzing various economic indicators—such as Gross Domestic Product (GDP), unemployment rates, interest rates, money supply, and consumer price indices—the paper aims to unravel how these factors collectively influence monetary policy decisions. The investigation begins with a thorough examination of Australia's current inflation trends compared to historical data, using graphical illustrations like the cash rate graph and consumer price indices to provide context. Additionally, it contrasts Australian economic conditions with global counterparts, such as China and Japan, to identify unique challenges and opportunities faced by the Reserve Bank of Australia (RBA). The paper also evaluates how shifts in money supply impact inflation expectations and policy effectiveness. Through this comprehensive analysis, students are expected to gain a deeper understanding of macroeconomic principles at play, providing insights into effective policy formulation for managing economic stability.

CASE STUDY
Paraphrase This Document
Need a fresh take? Get an instant paraphrase of this document with our AI Paraphraser
Table of Contents
INTRODUCTION...........................................................................................................................1
Q 1....................................................................................................................................................1
Q 2 ...................................................................................................................................................2
Q 3....................................................................................................................................................3
Q 4....................................................................................................................................................4
Q 5....................................................................................................................................................7
CONCLUSION................................................................................................................................9
REFERENCES .............................................................................................................................10

Index of Tables
Table 1: Table of Australia's indicators...........................................................................................4
Table 1: Table of Australia's indicators...........................................................................................4
⊘ This is a preview!⊘
Do you want full access?
Subscribe today to unlock all pages.
Trusted by 1+ million students worldwide
Illustration Index
Illustration 1: china inflation rate.....................................................................................................3
Illustration 2: Japanese inflation rate...............................................................................................4
Illustration 3: Unites States inflation rate........................................................................................5
Illustration 4: inflation rate of Australia..........................................................................................6
Illustration 5: Graph of Cash rate ....................................................................................................7
Illustration 6: Australia's indicators.................................................................................................9
Illustration 7: money supply curve................................................................................................10
Illustration 8: GDP of countries.....................................................................................................11
Illustration 9: inflation rate of countries........................................................................................12
Paraphrase This Document
Need a fresh take? Get an instant paraphrase of this document with our AI Paraphraser
INTRODUCTION
The economy of policy has a huge impact on economic condition of any country
(Bussière, Delle, and Peltonen, 2014, page 175.). The case study includes the study of Australia's
economic condition. It includes the impact of cash rate on inflation rate and other major
economic factors as well. It will also show the impact of global and domestic macroeconomic
indicators on the decision of changing cash rate. It will also study objectives of monetary policy
and functions of RBA in the economic system of Australia. Moreover, by using the money
market equilibrium model and monetary transmission mechanism the report will show the effects
of increase and decrease of cash rate on inflation rate and economy. The Australian economy is a
stable resilient economy with a GDP of AUD$ 1.69 trillion as of 2017. The total wealth of
Australia is AUD$ 8.9 trillion and the country hasn't seen a period of recession. In the year 2016
the inflation rate in the Australian economy was calculated to be 1.3. Moreover, the rate of
unemployment in the mentioned nation was found 5.7 in and fell to 5.6 as of August 2017.
Q 1
The monetary policy can be referred as the measures focused on effective operations of
the economy or it can be defined as the policies made to sustain and control the cost, supply and
availability of money in the system (Borio, 2012, page, 240). In other words, these are credit
control measures taken by the central bank of a country to ensure effective working of economic
system of the country. The monetary policy controls the flow of money in the economy which
effects declines the demand and the inflation rate also declines due to decrease in demand, which
determines the interest rate. The monetary policy are made by the Reserve Bank of Australia
with certain prime objectives to support economic system of the country.
Exchange rate : Stability of currency refers to the keeping the exchange rate stable.
Instability in the exchange rate causes inflow and outflow of gold which results in
differentiated balance of payments. Thus, the exchange rates play an important role in the
international trades. It is the main concern of RBA as the economic state of the county is
highly influenced due to high or low of exchange currency. A high or appreciating
exchange will slow down economic activities and pick up from inflation. The Australian
dollar experienced a hike in comparison to the US dollar which resulted in slow pick up
in economic activities and inflation.
1
Full employment : Unemployment is a critical problem which leads to instability in the
whole country. It is considered as socially dangerous and wasteful for the economy . The
unemployment can be defined as a lot of people not working because of inability of the
economy to provide them with jobs. . Full employment is the condition where there is
absence of involuntary unemployment. The full employment is the main objective of
monetary policy as it help to stabilize price in the market. The monetary policy of
Australia has focussed on full employment.
Currency stability : The currency stability is commonly used in order to judge the
purchasing power for goods and services. It can also be linked to price stability in the
market, that is, the condition in which the prices of products and services remain constant
(Bodie, 2013, page, 156). The currency stability is an important part of the monetary
policy as its value regarding the product and services give rise to inflation or deflation.
Functions of RBA :
The Reserve Bank of Australia is the central bank of the nation and is responsible in
performance of certain functions to mobilize the trade and also monitor all the other banks.
Framing monetary policy of Australia.
It also ensures stability of the financial system of the country (Araya). RBA is
responsible for the stability of financial system, it stabilizes the system through control of
money in system
It is responsible to hold and manage Australia's foreign currency reserves.
The institution is also given the duty to provide the government and the overseas
organizations with the asked services. The RBA provides the government with various
services such as management of its core account.
The RBA also avails the responsibility and power to design, produce and issue Australian
bank notes. The Australian Dollars are produces and designed by the RBA.
The body also sets cash rates for the country, that is the rate of interest for the loans taken
by commercial banks. It is sets and controls the cash rate in the country in the country to
stabilize the economy.
2
⊘ This is a preview!⊘
Do you want full access?
Subscribe today to unlock all pages.
Trusted by 1+ million students worldwide
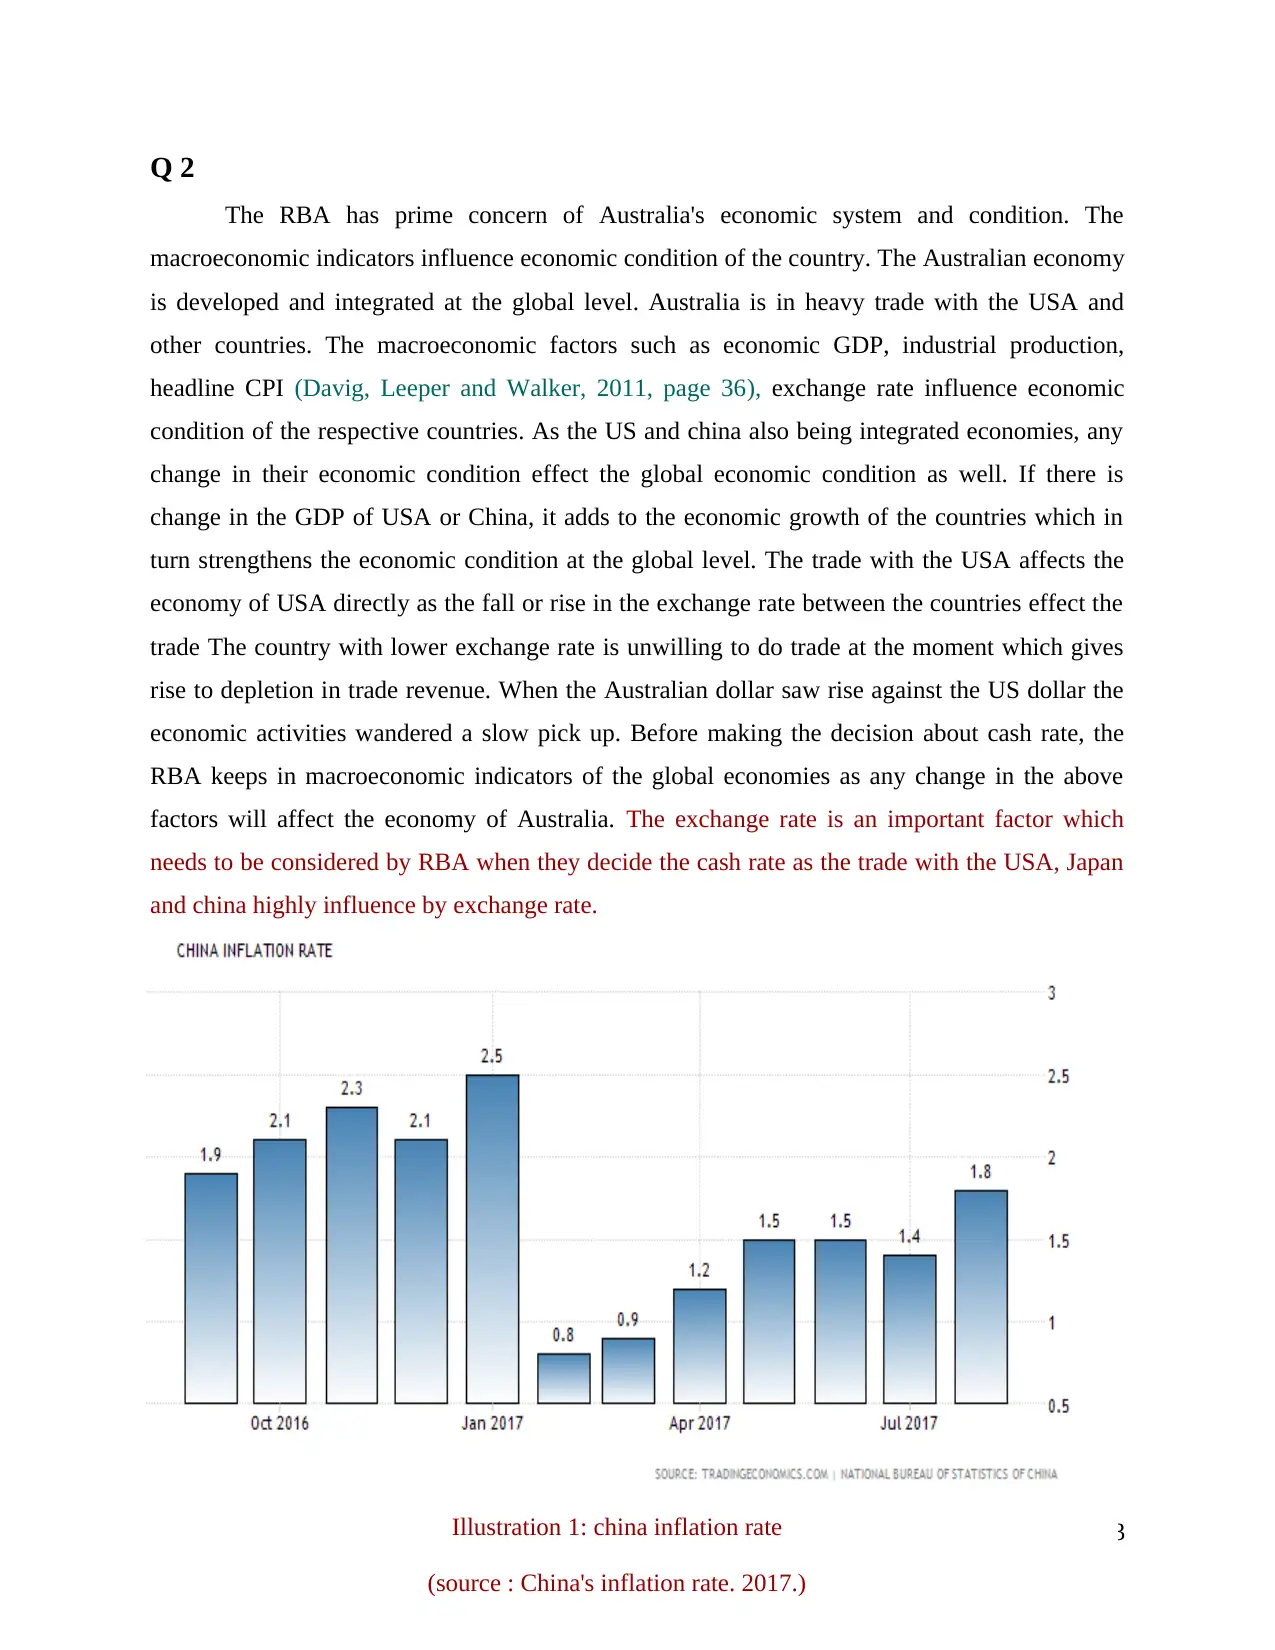
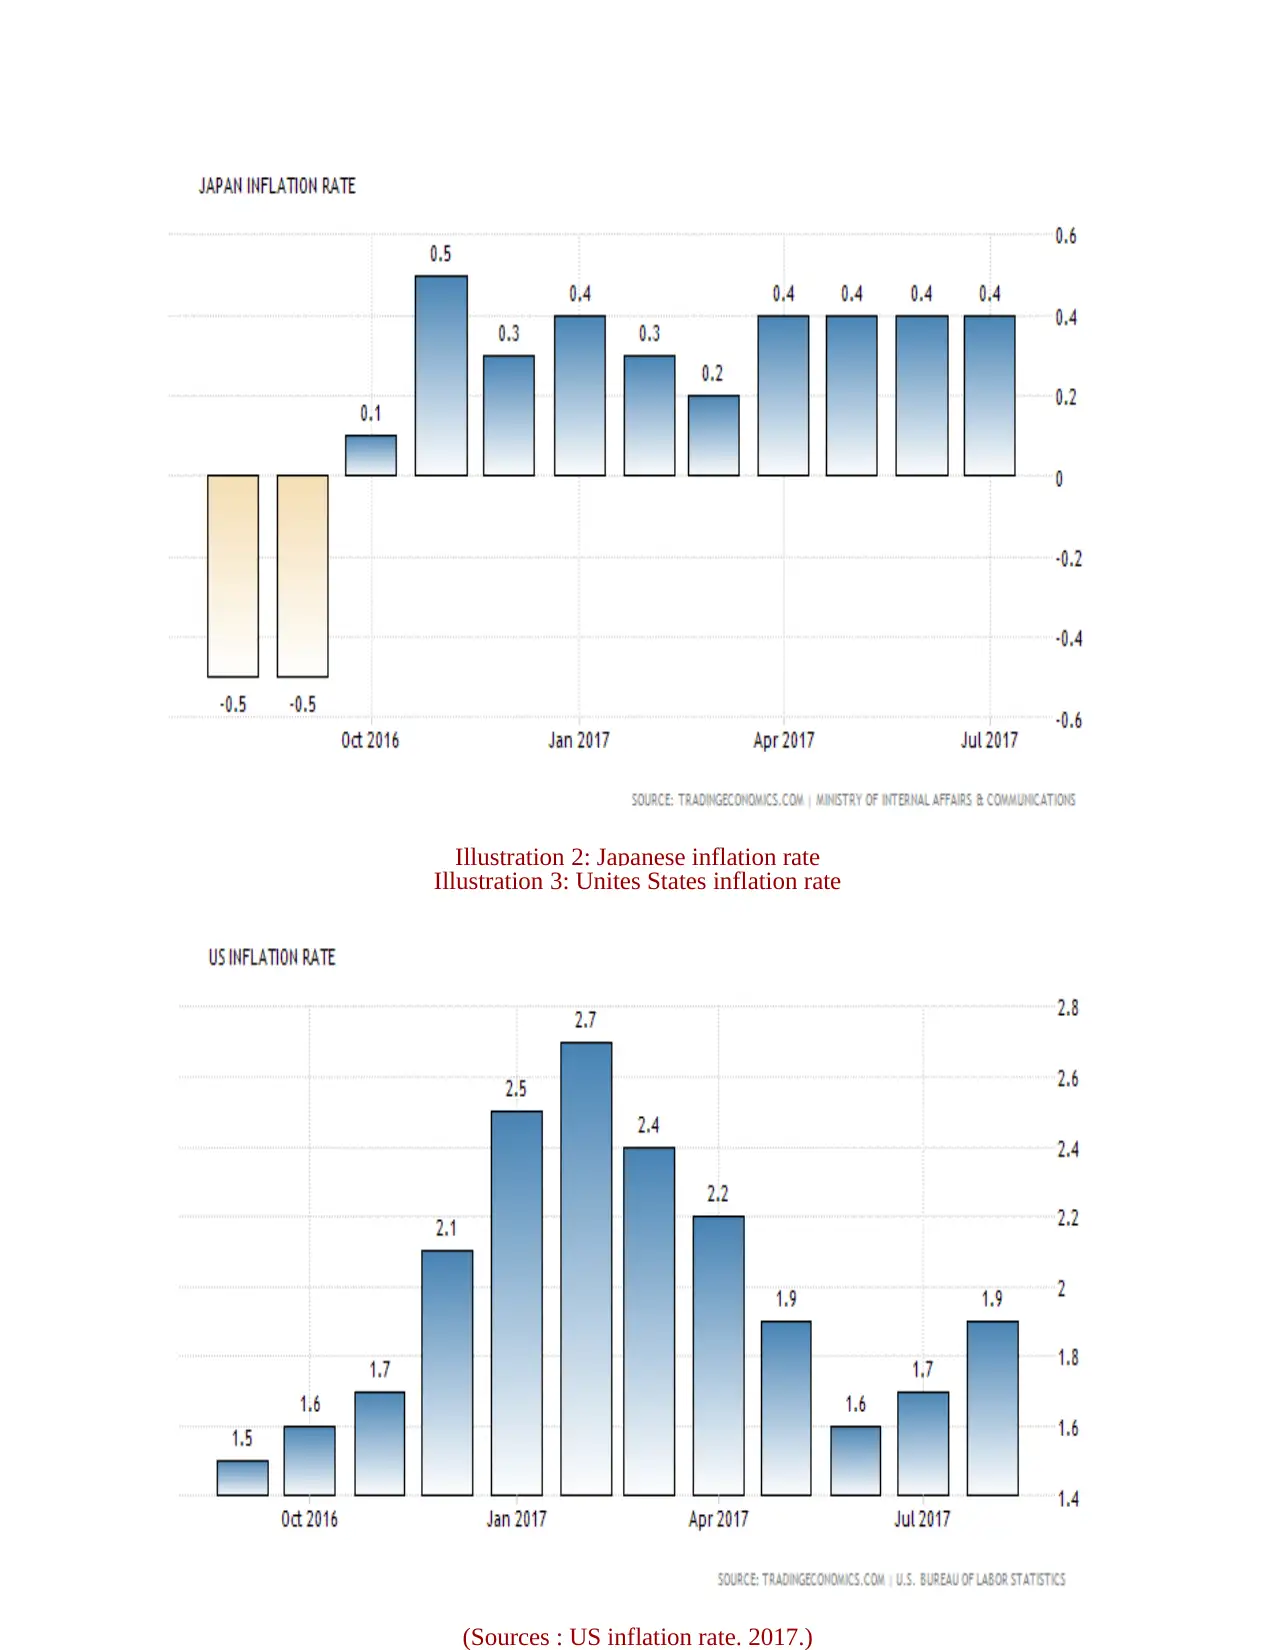
Q 2
The RBA has prime concern of Australia's economic system and condition. The
macroeconomic indicators influence economic condition of the country. The Australian economy
is developed and integrated at the global level. Australia is in heavy trade with the USA and
other countries. The macroeconomic factors such as economic GDP, industrial production,
headline CPI (Davig, Leeper and Walker, 2011, page 36), exchange rate influence economic
condition of the respective countries. As the US and china also being integrated economies, any
change in their economic condition effect the global economic condition as well. If there is
change in the GDP of USA or China, it adds to the economic growth of the countries which in
turn strengthens the economic condition at the global level. The trade with the USA affects the
economy of USA directly as the fall or rise in the exchange rate between the countries effect the
trade The country with lower exchange rate is unwilling to do trade at the moment which gives
rise to depletion in trade revenue. When the Australian dollar saw rise against the US dollar the
economic activities wandered a slow pick up. Before making the decision about cash rate, the
RBA keeps in macroeconomic indicators of the global economies as any change in the above
factors will affect the economy of Australia. The exchange rate is an important factor which
needs to be considered by RBA when they decide the cash rate as the trade with the USA, Japan
and china highly influence by exchange rate.
3Illustration 1: china inflation rate
(source : China's inflation rate. 2017.)
Paraphrase This Document
Need a fresh take? Get an instant paraphrase of this document with our AI Paraphraser
4
Illustration 2: Japanese inflation rate
(Source : Japan's inflation rate. 2017.)
Illustration 3: Unites States inflation rate
(Sources : US inflation rate. 2017.)
Illustration 2: Japanese inflation rate
(Source : Japan's inflation rate. 2017.)
Illustration 3: Unites States inflation rate
(Sources : US inflation rate. 2017.)
The domestic macroeconomic indicators affect the economic system of Australia in vast
way. The rise or fall in the inflation rate affect the business environment and consumer demand.
The demand for goods decrease during inflation as the consumers cannot afford high priced
products as well as they save money for the further use as well. This decreases demand to a high
constraint (Pal and Mittal, 2011, page 87.). Making changes in the cash rate will affect the
condition of the economy in vast way. The increase in cash rate will increase the interest rate at
which loans are provided to individual which will discourage loan purchase which will decline
invest and demand for products. This will slow the rate of economic growth. On the other hand,
decrease in the cash rate will facilitate loan takers and people will take more loans which will
enhance business and employment in the country. After a while this will result in inflation due
to rise in demand for the products. This demand increases due to abundance of disposable
income in the hands of the population.
5
Illustration 4: inflation rate of Australia
(Source : Measures of consumer price inflation. 2017.)
⊘ This is a preview!⊘
Do you want full access?
Subscribe today to unlock all pages.
Trusted by 1+ million students worldwide
Interest rate are
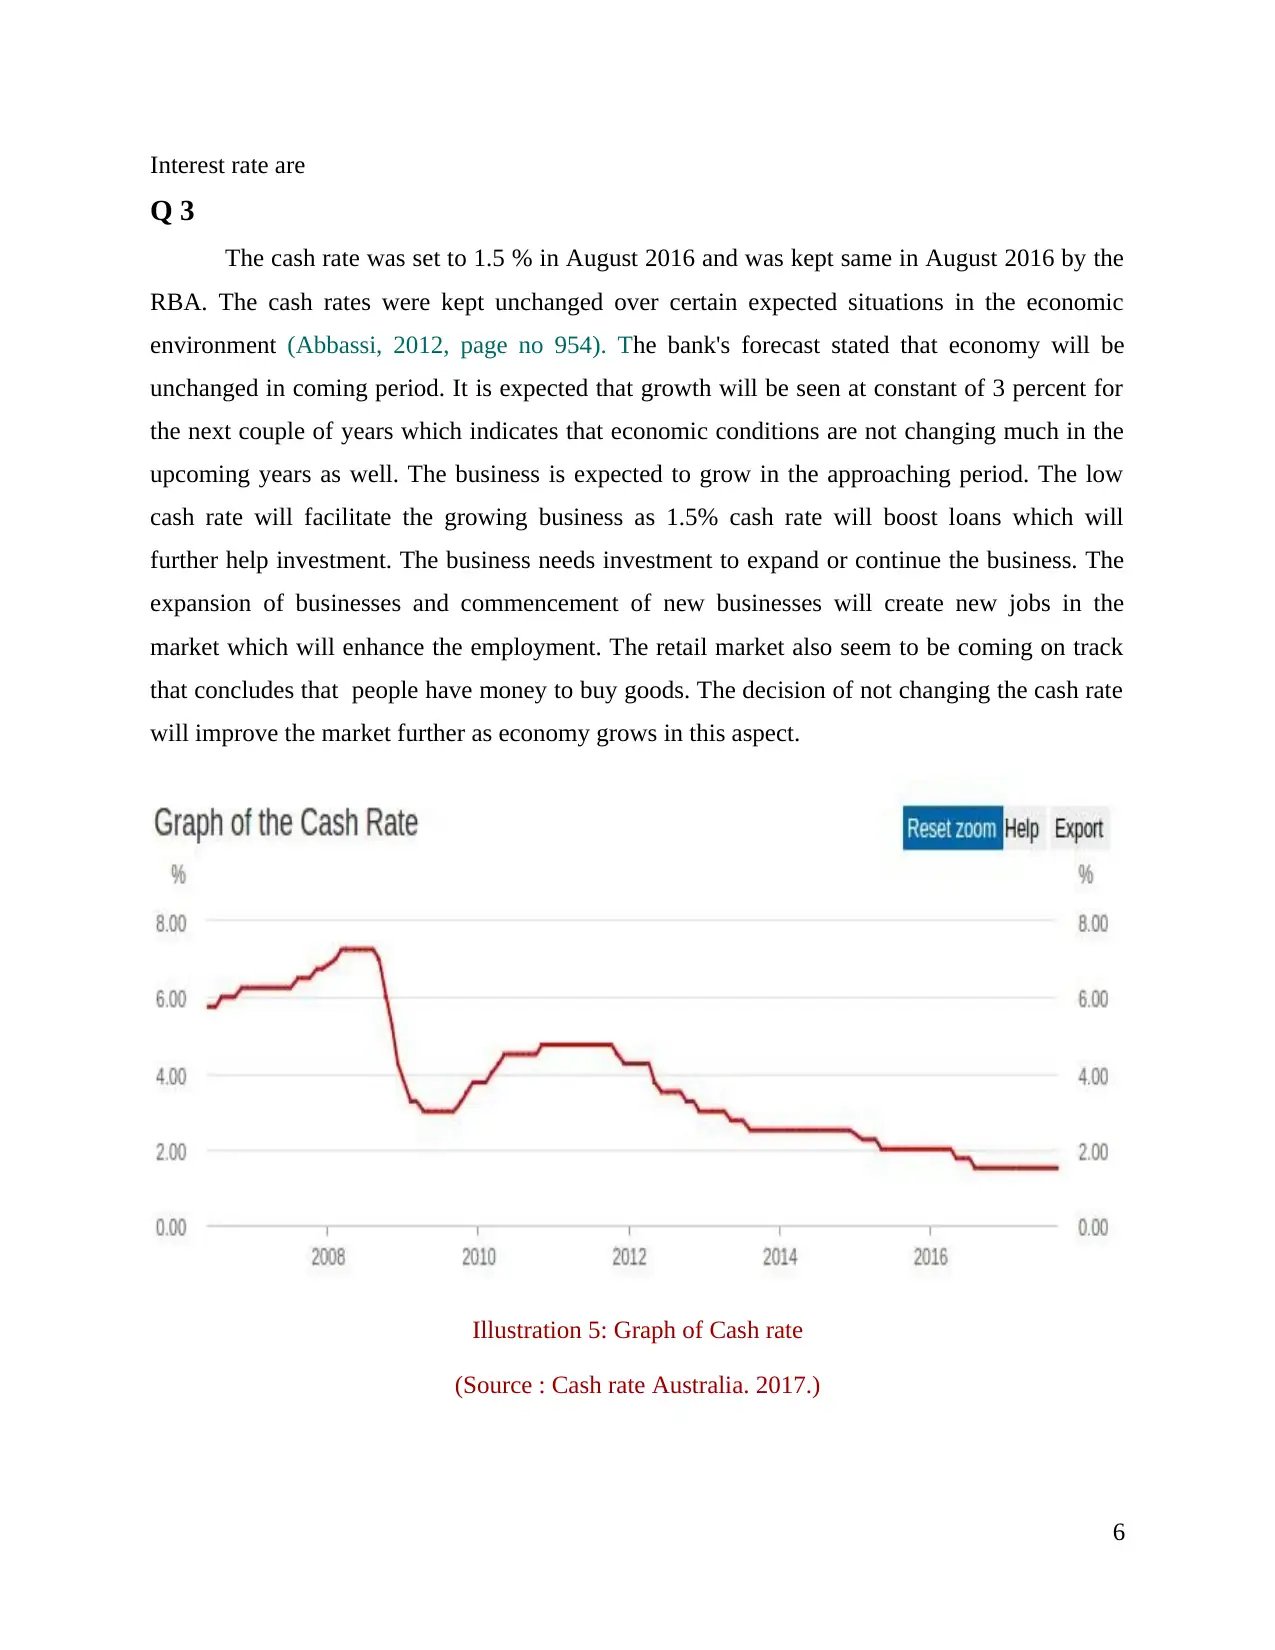
Q 3
The cash rate was set to 1.5 % in August 2016 and was kept same in August 2016 by the
RBA. The cash rates were kept unchanged over certain expected situations in the economic
environment (Abbassi, 2012, page no 954). The bank's forecast stated that economy will be
unchanged in coming period. It is expected that growth will be seen at constant of 3 percent for
the next couple of years which indicates that economic conditions are not changing much in the
upcoming years as well. The business is expected to grow in the approaching period. The low
cash rate will facilitate the growing business as 1.5% cash rate will boost loans which will
further help investment. The business needs investment to expand or continue the business. The
expansion of businesses and commencement of new businesses will create new jobs in the
market which will enhance the employment. The retail market also seem to be coming on track
that concludes that people have money to buy goods. The decision of not changing the cash rate
will improve the market further as economy grows in this aspect.
6
Illustration 5: Graph of Cash rate
(Source : Cash rate Australia. 2017.)
Paraphrase This Document
Need a fresh take? Get an instant paraphrase of this document with our AI Paraphraser
The slow growth in wage rate and also high level of household debt is expected to limit
spending in the retail market. This step will help in lowering down the interest rates on loans
keeping more income to dispose in the hands of the consumers, which will increase spending.
The wage rates are currently low and are expected to rise in the near future, until then lower cash
rate will ease the condition of the economy as people will be able to satisfy their needs. The
inflation rate is expected to rise in the coming period as the economy strengthens (Coibion, 2012,
page, 1399). The strengthening of economy is based on business growth, hike in the retail
market, increase in employment rate which will strengthen the economic system of Australia.
The RBA presuming the above situations and making a statical strategy for the upliftment of the
economy the governor of RBA, Dr. Philip Lowe decided to keep the official cash rate unchanged
to 1.5 %.
Q 4
The table below shows the difference in macroeconomic indicators that influence
economic growth in Australia.
Table 1: Table of Australia's indicators
Year
GDP (in trillion
USD)
Inflation (CPI) in
%
Unemployment rate ( in
%)
2012 1.538 1.8 5.4
2013 1.567 2.5 5.4
2014 1.46 2.5 6.4
2015 1.345 1.5 6.2
2016 1.205 1.3 5.7
The above table shows that GDP, inflation rate and unemployment rate of Australia. The
GDP is in trillion USD and the table interprets that it increased in 2012 and 2013 and then it
experienced a fall in the coming year till 2016 (Stiglitz, 2010, page 165). The inflation rate took
a hike in the year 2013 and 2014 where after which the government decided to reduce the cash
rate in 2015 to control rising inflation in the country. This step proved to be successful and the
7
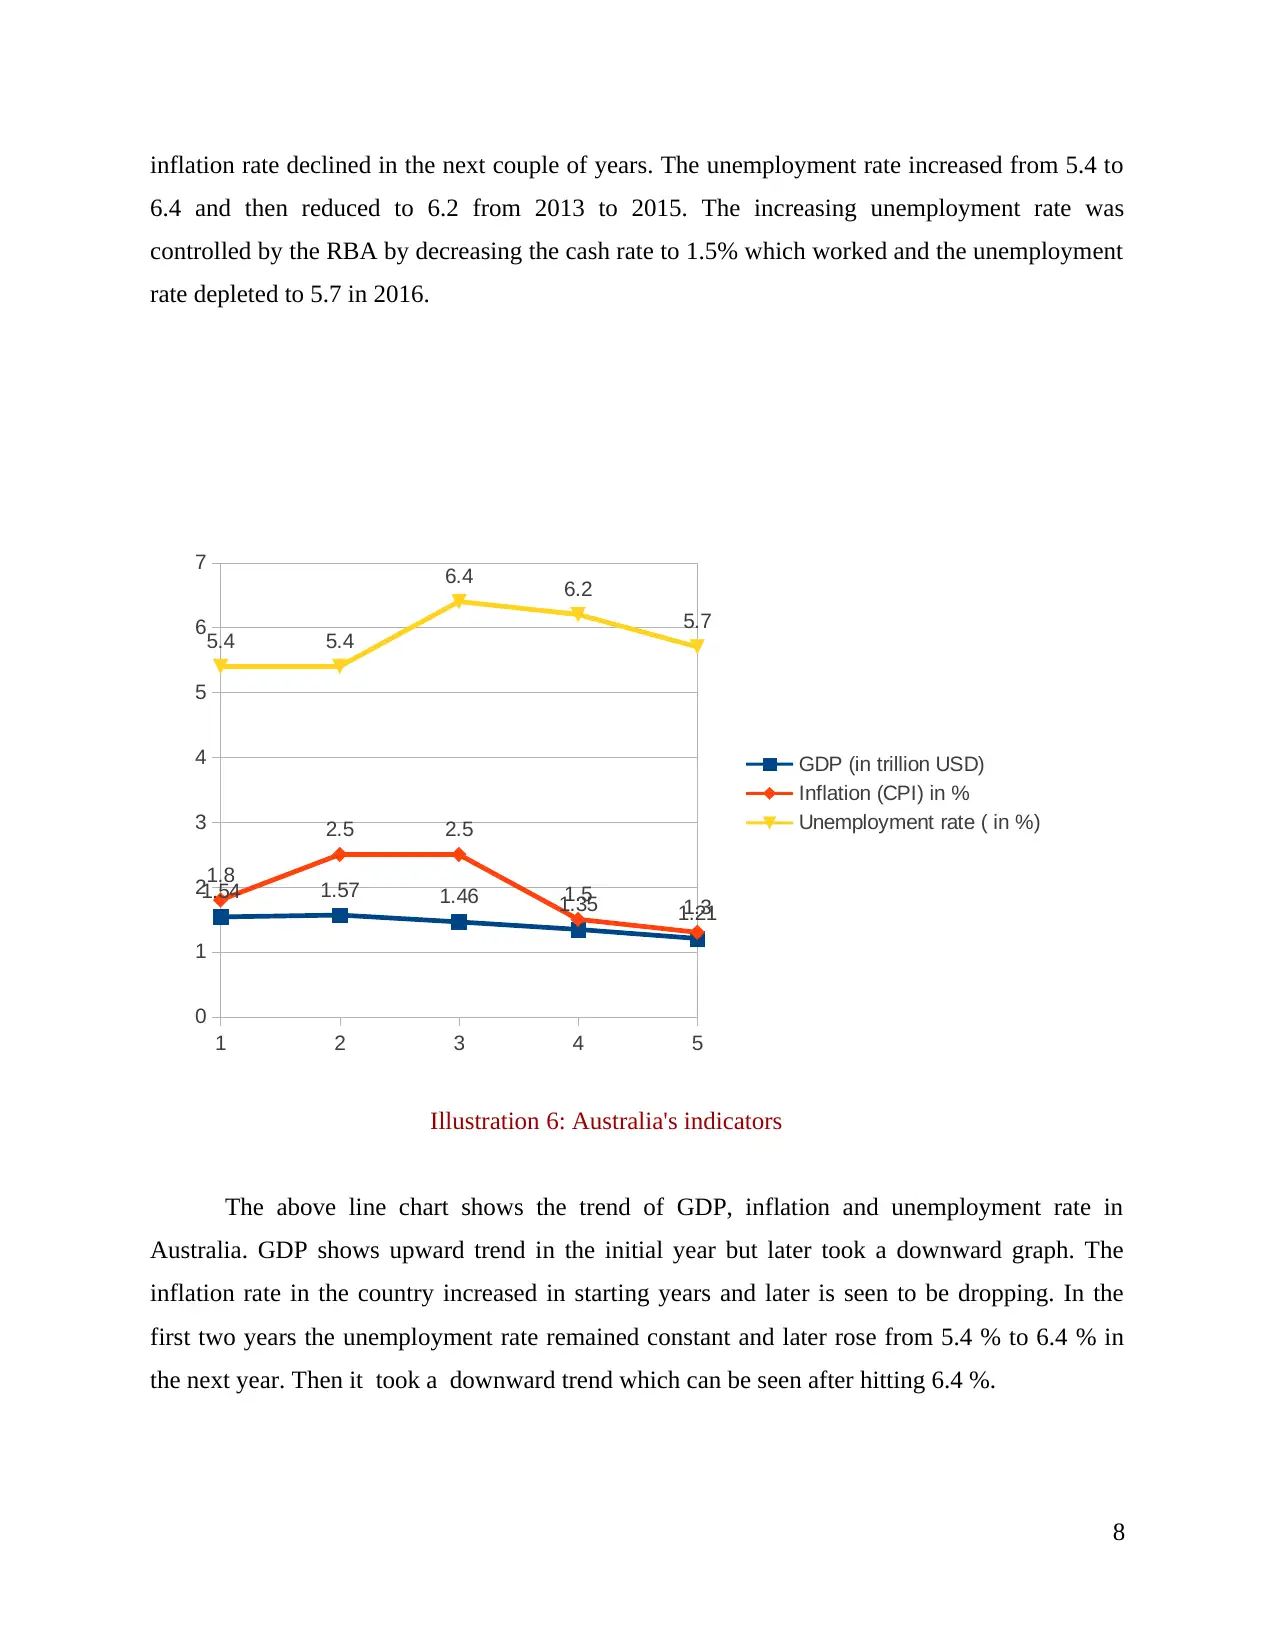
inflation rate declined in the next couple of years. The unemployment rate increased from 5.4 to
6.4 and then reduced to 6.2 from 2013 to 2015. The increasing unemployment rate was
controlled by the RBA by decreasing the cash rate to 1.5% which worked and the unemployment
rate depleted to 5.7 in 2016.
1 2 3 4 5
0
1
2
3
4
5
6
7
1.54 1.57 1.46 1.35 1.21
1.8
2.5 2.5
1.5 1.3
5.4 5.4
6.4 6.2
5.7
GDP (in trillion USD)
Inflation (CPI) in %
Unemployment rate ( in %)
Illustration 6: Australia's indicators
The above line chart shows the trend of GDP, inflation and unemployment rate in
Australia. GDP shows upward trend in the initial year but later took a downward graph. The
inflation rate in the country increased in starting years and later is seen to be dropping. In the
first two years the unemployment rate remained constant and later rose from 5.4 % to 6.4 % in
the next year. Then it took a downward trend which can be seen after hitting 6.4 %.
8
⊘ This is a preview!⊘
Do you want full access?
Subscribe today to unlock all pages.
Trusted by 1+ million students worldwide
1 out of 19
Related Documents


Your All-in-One AI-Powered Toolkit for Academic Success.
+13062052269
info@desklib.com
Available 24*7 on WhatsApp / Email
![[object Object]](/_next/static/media/star-bottom.7253800d.svg)
Unlock your academic potential
Copyright © 2020–2026 A2Z Services. All Rights Reserved. Developed and managed by ZUCOL.