Business Economics BUECO5903: Inflation, AD-AS, and Economic Events
VerifiedAdded on 2023/06/03
|6
|799
|412
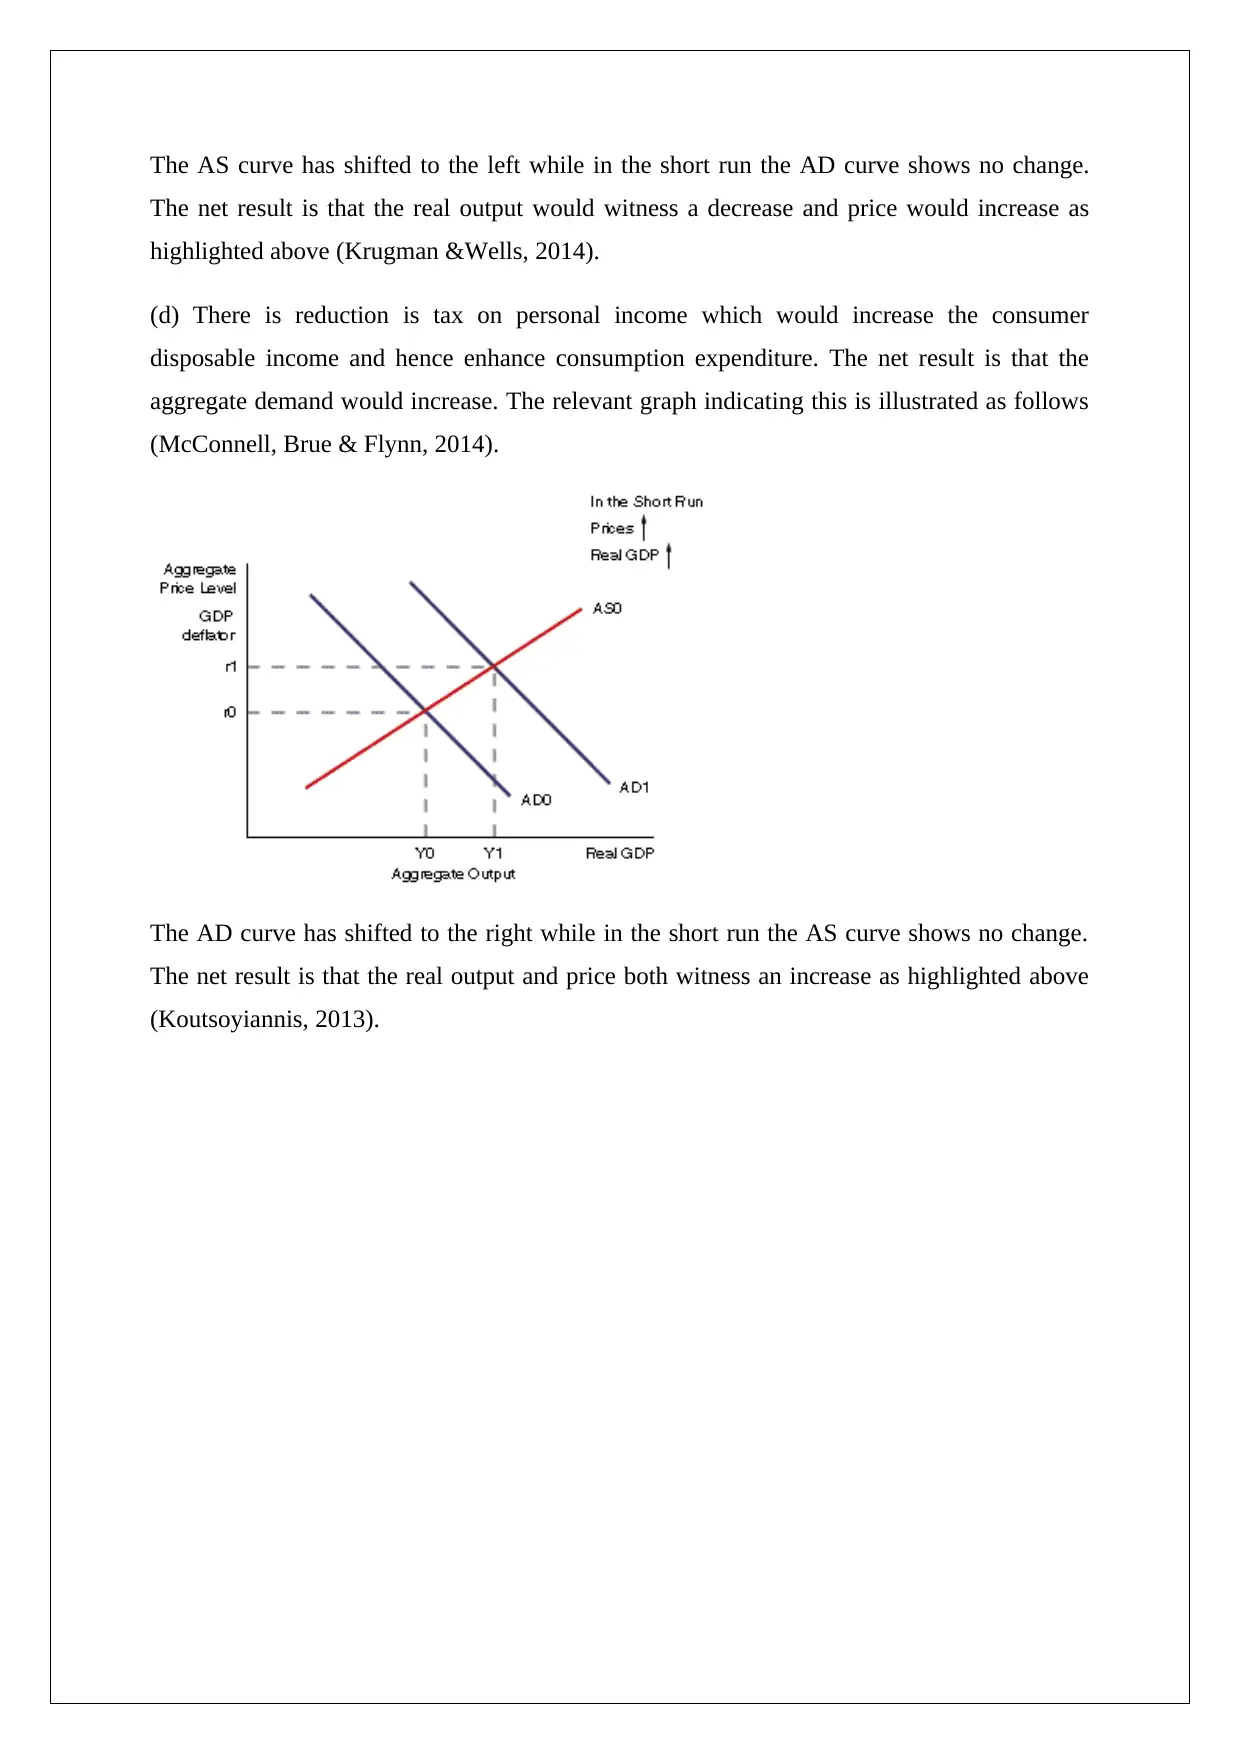
Homework Assignment
AI Summary
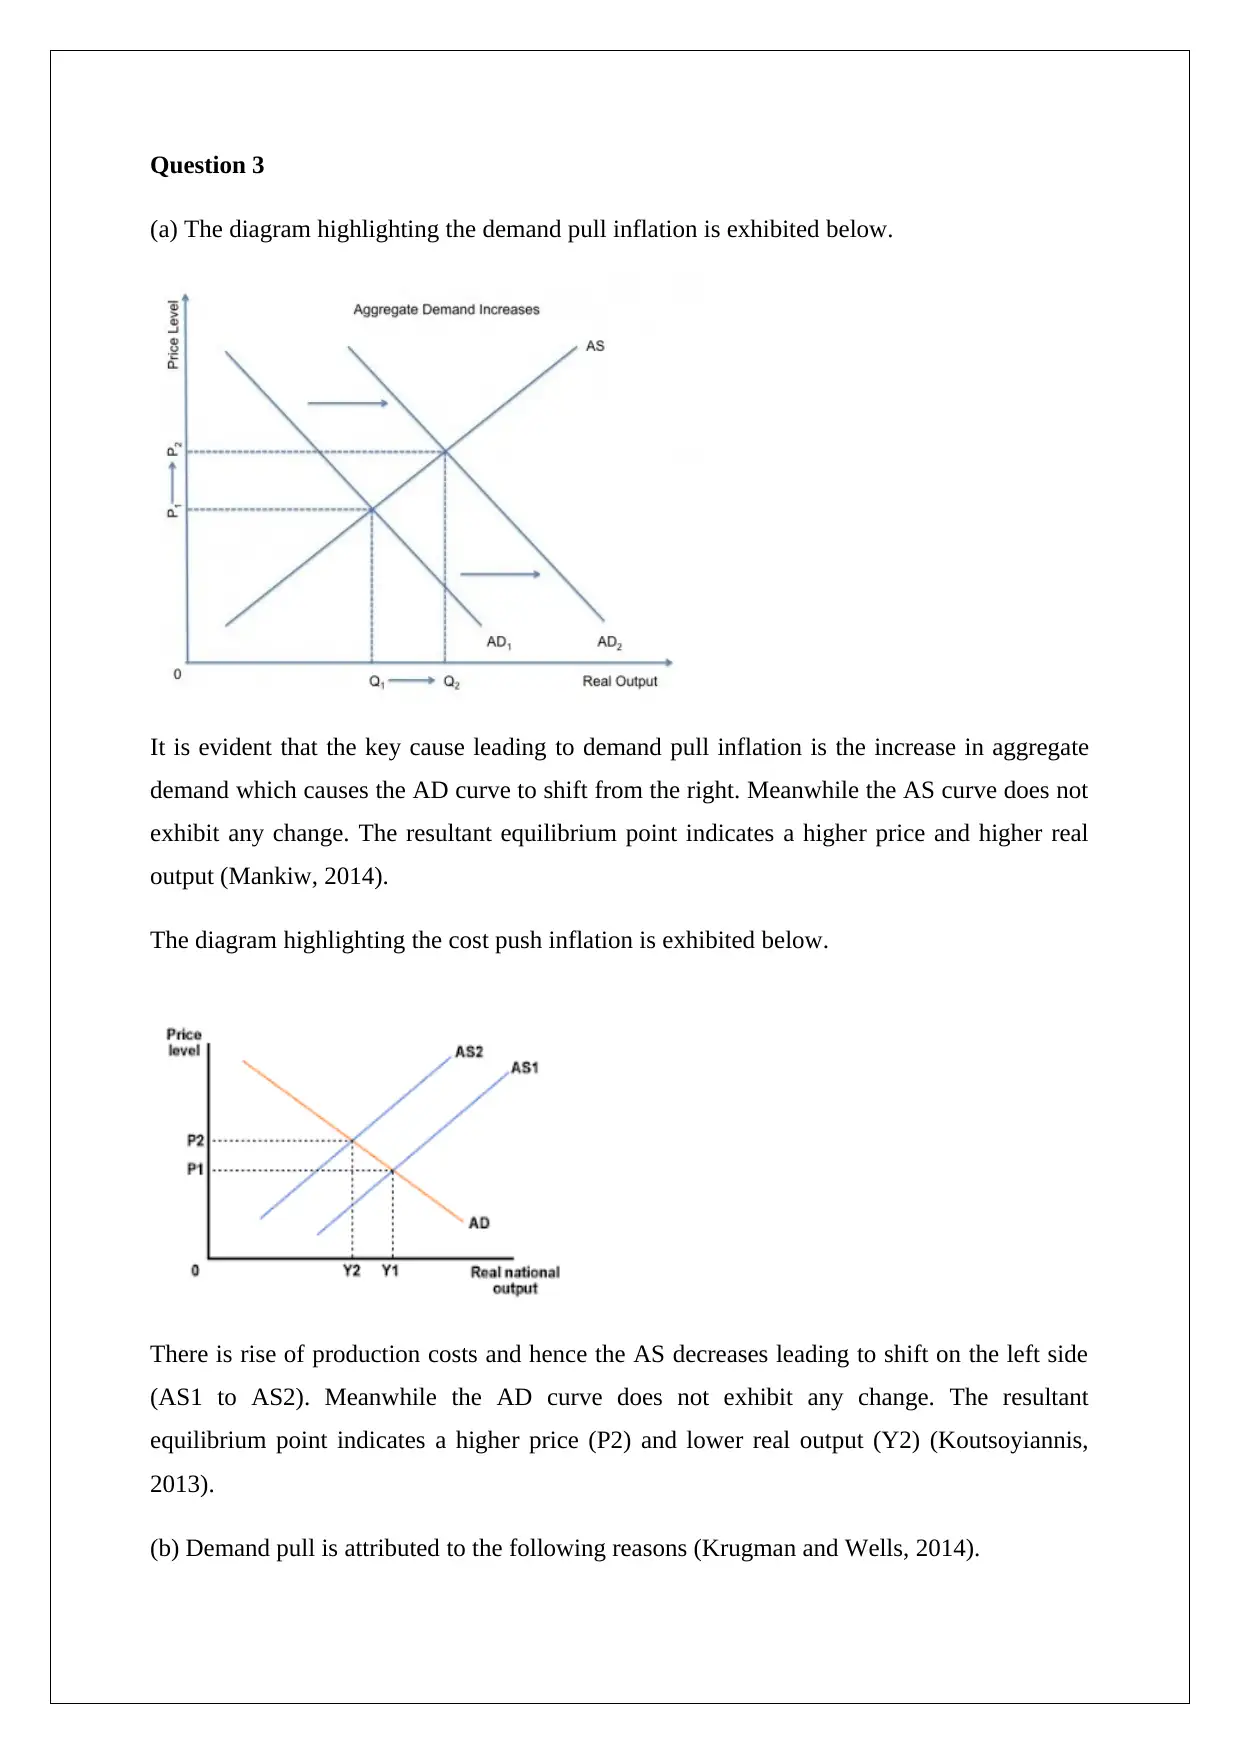
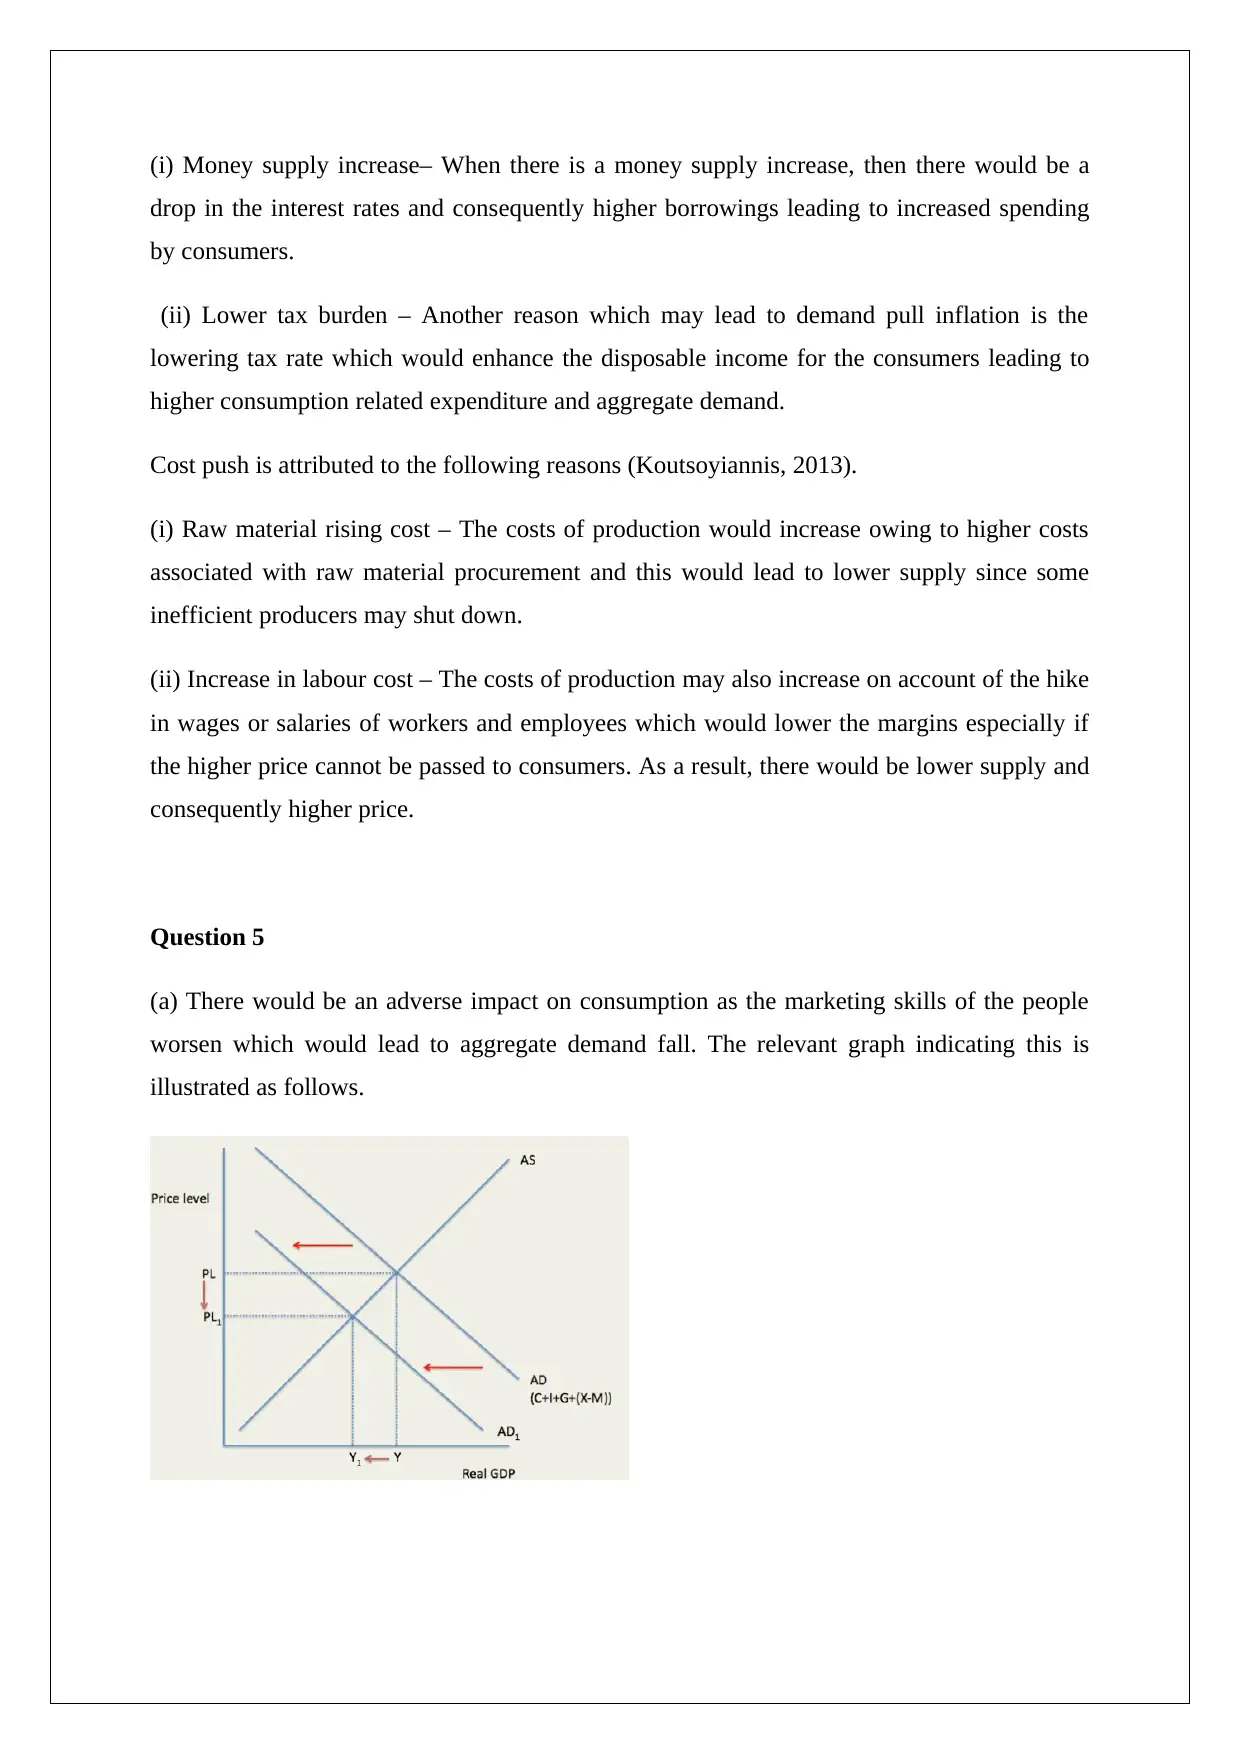
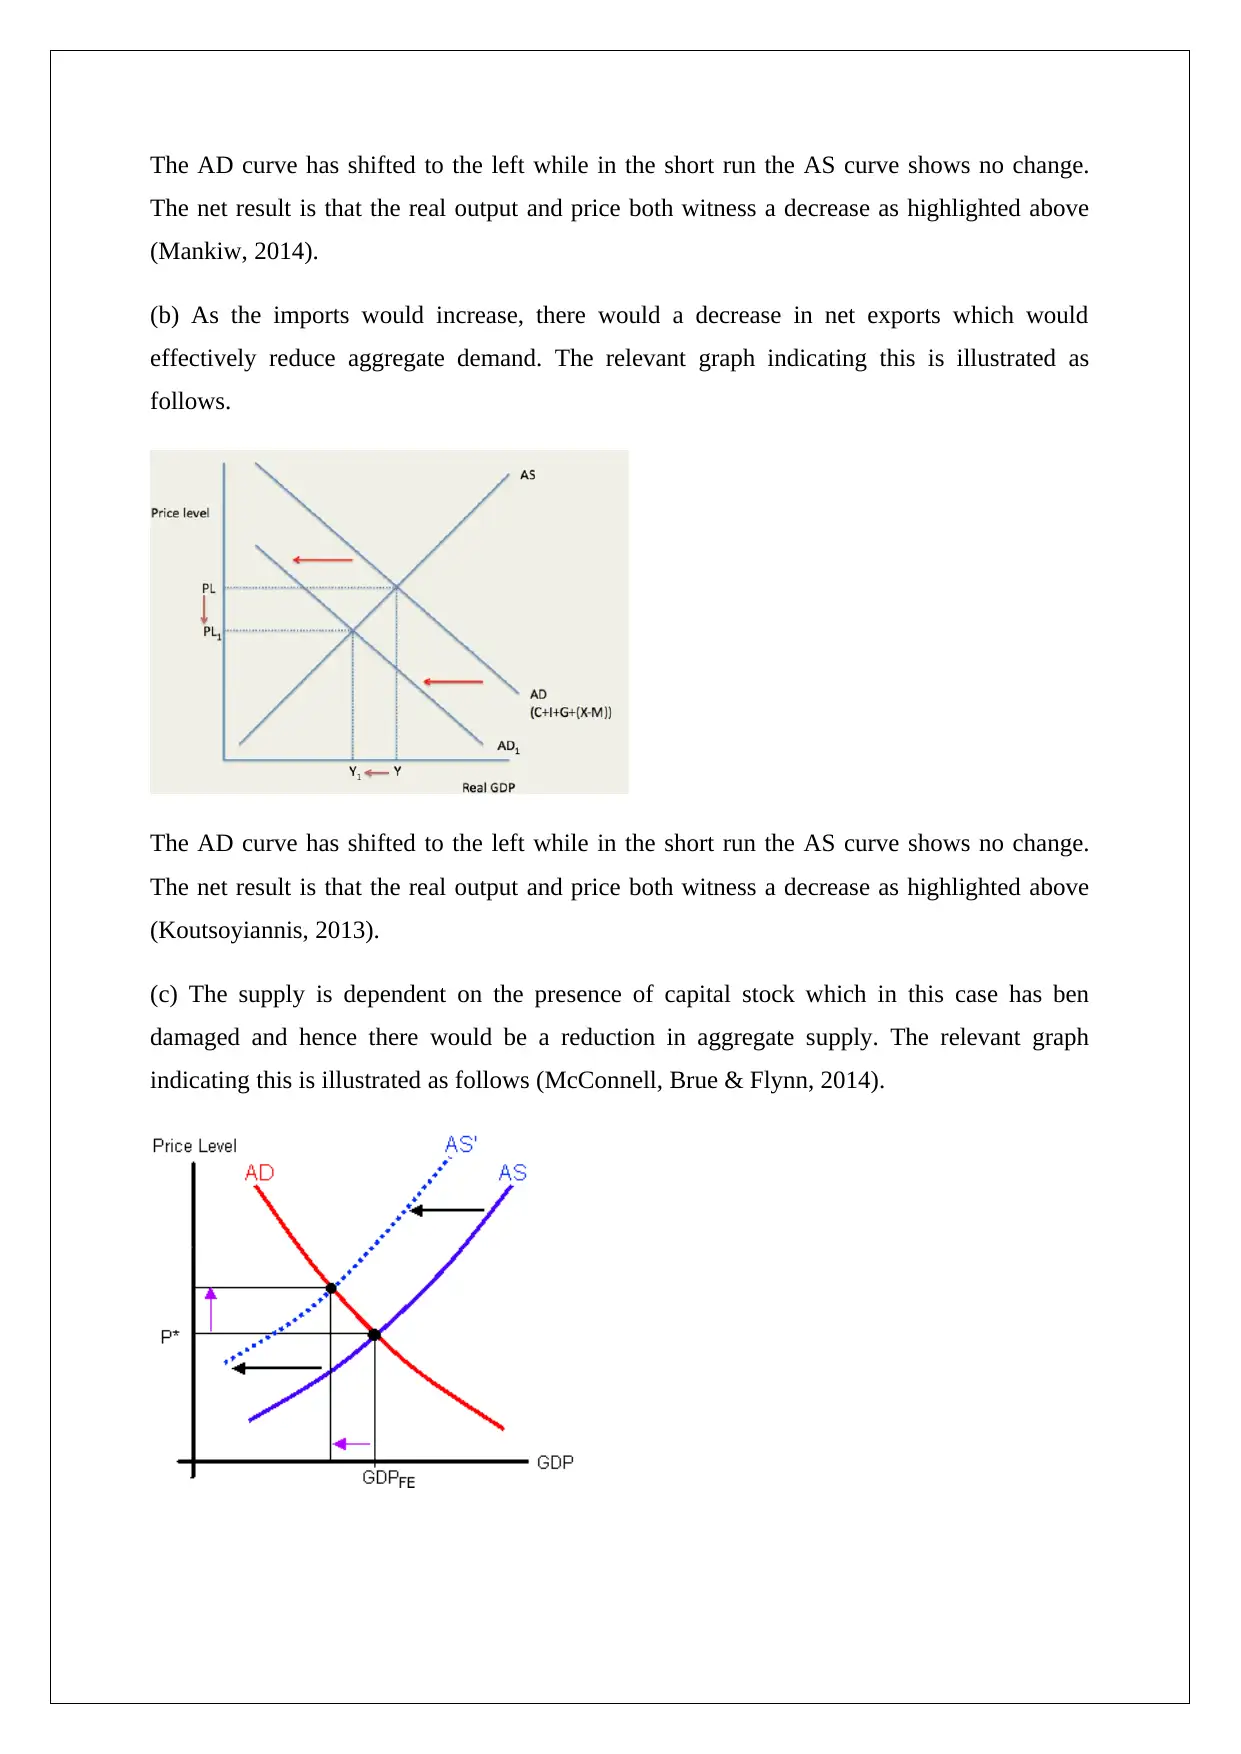
This assignment solution addresses key macroeconomic concepts, including demand-pull and cost-push inflation, and analyzes the impact of various economic events using the aggregate demand-aggregate supply (AD-AS) model. It illustrates the causes of both types of inflation and the effects of changes in money supply, tax rates, raw material costs, and labor costs. The solution also examines how a decline in marketing skills, an increase in imports, destruction of capital stock, and a decrease in personal income tax affect economic activity and the price level. Furthermore, it explores the implications of macroeconomic policy on unemployment and contrasts structural and cyclical unemployment. Diagrams are used throughout to illustrate the economic concepts and their effects on the economy.
1 out of 6
Related Documents


Your All-in-One AI-Powered Toolkit for Academic Success.
+13062052269
info@desklib.com
Available 24*7 on WhatsApp / Email
![[object Object]](/_next/static/media/star-bottom.7253800d.svg)
Copyright © 2020–2026 A2Z Services. All Rights Reserved. Developed and managed by ZUCOL.