Influence of Emotional Branded Content on Instagram Sharing Behavior
VerifiedAdded on 2021/02/20
|14
|3076
|243
Report
AI Summary
This report presents an investigation into the influence of emotional branded content on sharing behavior on Instagram. The study employs data analysis techniques, including reliability tests, ANOVA, and hypothesis testing, to assess the impact of positive and negative emotions, user-generated versus company-generated content, and gender differences on sharing probability. The analysis reveals insights into the effectiveness of emotional branding strategies, with findings indicating varying levels of correlation between emotional content and user engagement. The report evaluates six hypotheses related to the influence of emotional content, providing statistical evidence to support or reject each one. Key findings include an assessment of the reliability of the data, the impact of positive and negative emotions, and the role of user-generated content in influencing sharing behavior, along with analysis of the factors influencing sharing of company generated emotional content. The report concludes with a discussion of the results and their implications for content marketing strategies on Instagram.
AN INVESTIGATION ON
THE INFLUENCE OF
EMOTIONAL BRANDED
CONTENT (INCREASING
SHARING PROBABILITY)
THE INFLUENCE OF
EMOTIONAL BRANDED
CONTENT (INCREASING
SHARING PROBABILITY)
Paraphrase This Document
Need a fresh take? Get an instant paraphrase of this document with our AI Paraphraser
Table of Contents
DATA ANALYSIS.........................................................................................................................1
Reliability Test.............................................................................................................................1
Hypothesis Testing......................................................................................................................2
H1: The larger the total amount of positive emotion the content exhibits, the more likely it is
going to be shared.......................................................................................................................2
H2: The larger the total amount of negative emotion the content exhibits, the more likely it
is going to be shared...................................................................................................................5
Hypotheses 3: Consumers are more likely to share user generated emotionally branded
content.........................................................................................................................................7
Hypotheses 4: Consumers are more likely to share company generated emotionally branded
content.........................................................................................................................................9
Hypotheses 5: Are male Instagram users more likely to share emotional branded content?12
Hypotheses 6: Are female Instagram users more likely to share emotional branded content?
...................................................................................................................................................12
Discussion..................................................................................................................................13
REFERENCES..............................................................................................................................14
DATA ANALYSIS
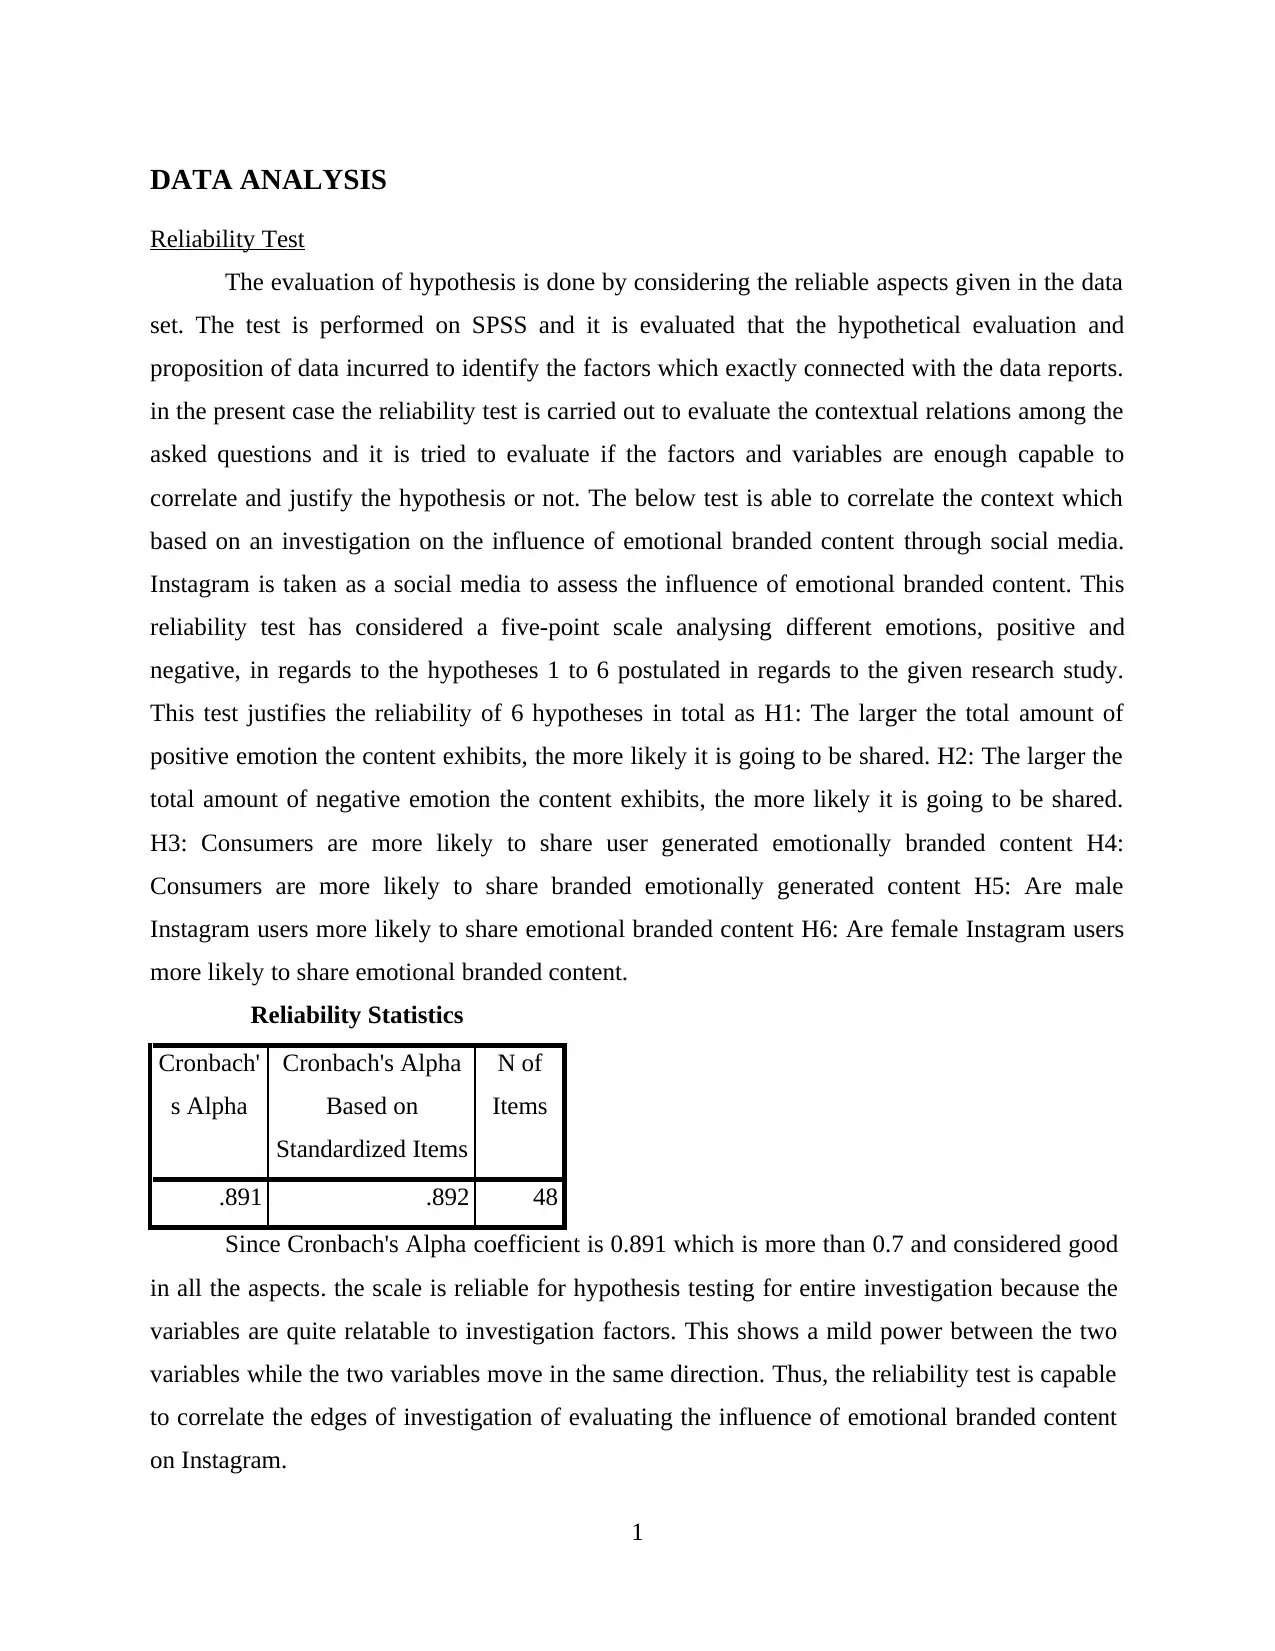
Reliability Test
The evaluation of hypothesis is done by considering the reliable aspects given in the data
set. The test is performed on SPSS and it is evaluated that the hypothetical evaluation and
proposition of data incurred to identify the factors which exactly connected with the data reports.
in the present case the reliability test is carried out to evaluate the contextual relations among the
asked questions and it is tried to evaluate if the factors and variables are enough capable to
correlate and justify the hypothesis or not. The below test is able to correlate the context which
based on an investigation on the influence of emotional branded content through social media.
Instagram is taken as a social media to assess the influence of emotional branded content. This
reliability test has considered a five-point scale analysing different emotions, positive and
negative, in regards to the hypotheses 1 to 6 postulated in regards to the given research study.
This test justifies the reliability of 6 hypotheses in total as H1: The larger the total amount of
positive emotion the content exhibits, the more likely it is going to be shared. H2: The larger the
total amount of negative emotion the content exhibits, the more likely it is going to be shared.
H3: Consumers are more likely to share user generated emotionally branded content H4:
Consumers are more likely to share branded emotionally generated content H5: Are male
Instagram users more likely to share emotional branded content H6: Are female Instagram users
more likely to share emotional branded content.
Reliability Statistics
Cronbach'
s Alpha
Cronbach's Alpha
Based on
Standardized Items
N of
Items
.891 .892 48
Since Cronbach's Alpha coefficient is 0.891 which is more than 0.7 and considered good
in all the aspects. the scale is reliable for hypothesis testing for entire investigation because the
variables are quite relatable to investigation factors. This shows a mild power between the two
variables while the two variables move in the same direction. Thus, the reliability test is capable
to correlate the edges of investigation of evaluating the influence of emotional branded content
on Instagram.
1
⊘ This is a preview!⊘
Do you want full access?
Subscribe today to unlock all pages.
Trusted by 1+ million students worldwide
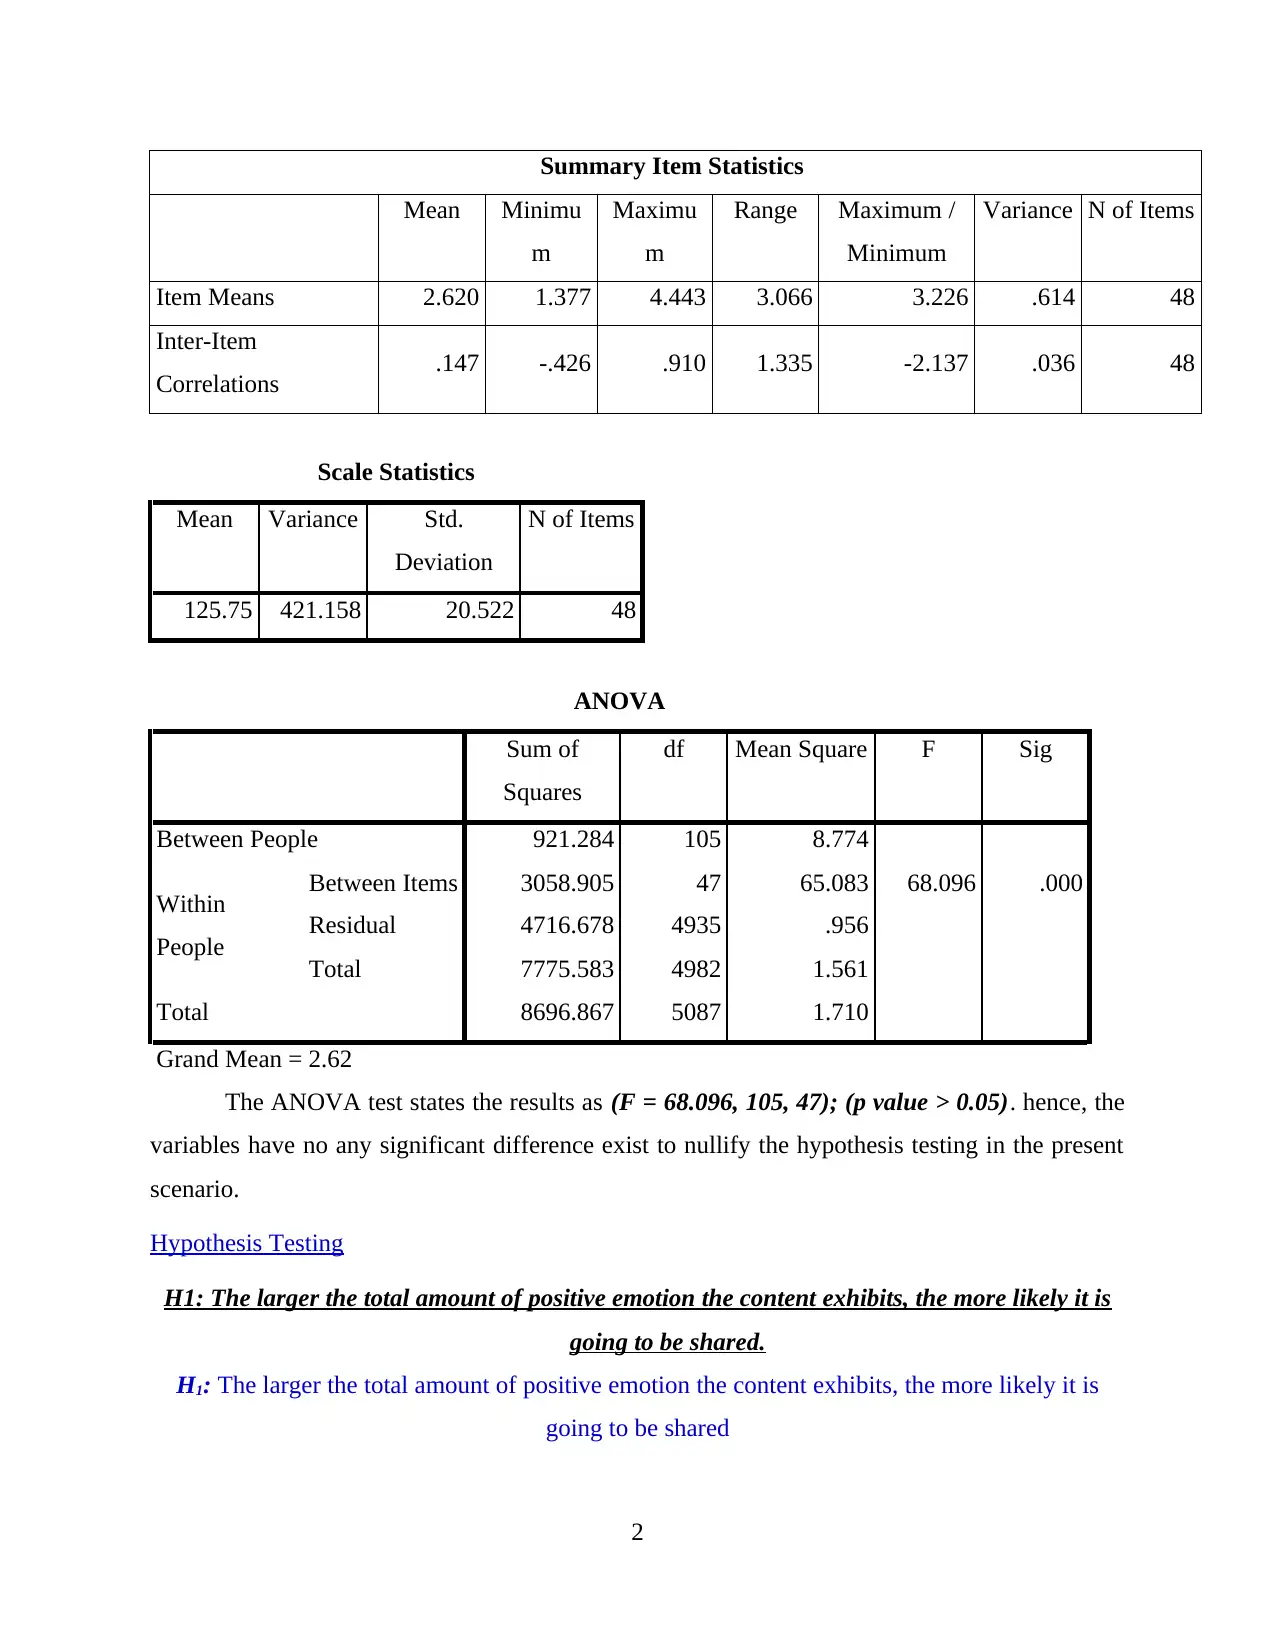
Summary Item Statistics
Mean Minimu
m
Maximu
m
Range Maximum /
Minimum
Variance N of Items
Item Means 2.620 1.377 4.443 3.066 3.226 .614 48
Inter-Item
Correlations .147 -.426 .910 1.335 -2.137 .036 48
Scale Statistics
Mean Variance Std.
Deviation
N of Items
125.75 421.158 20.522 48
ANOVA
Sum of
Squares
df Mean Square F Sig
Between People 921.284 105 8.774
Within
People
Between Items 3058.905 47 65.083 68.096 .000
Residual 4716.678 4935 .956
Total 7775.583 4982 1.561
Total 8696.867 5087 1.710
Grand Mean = 2.62
The ANOVA test states the results as (F = 68.096, 105, 47); (p value > 0.05). hence, the
variables have no any significant difference exist to nullify the hypothesis testing in the present
scenario.
Hypothesis Testing
H1: The larger the total amount of positive emotion the content exhibits, the more likely it is
going to be shared.
H1: The larger the total amount of positive emotion the content exhibits, the more likely it is
going to be shared
2
Paraphrase This Document
Need a fresh take? Get an instant paraphrase of this document with our AI Paraphraser
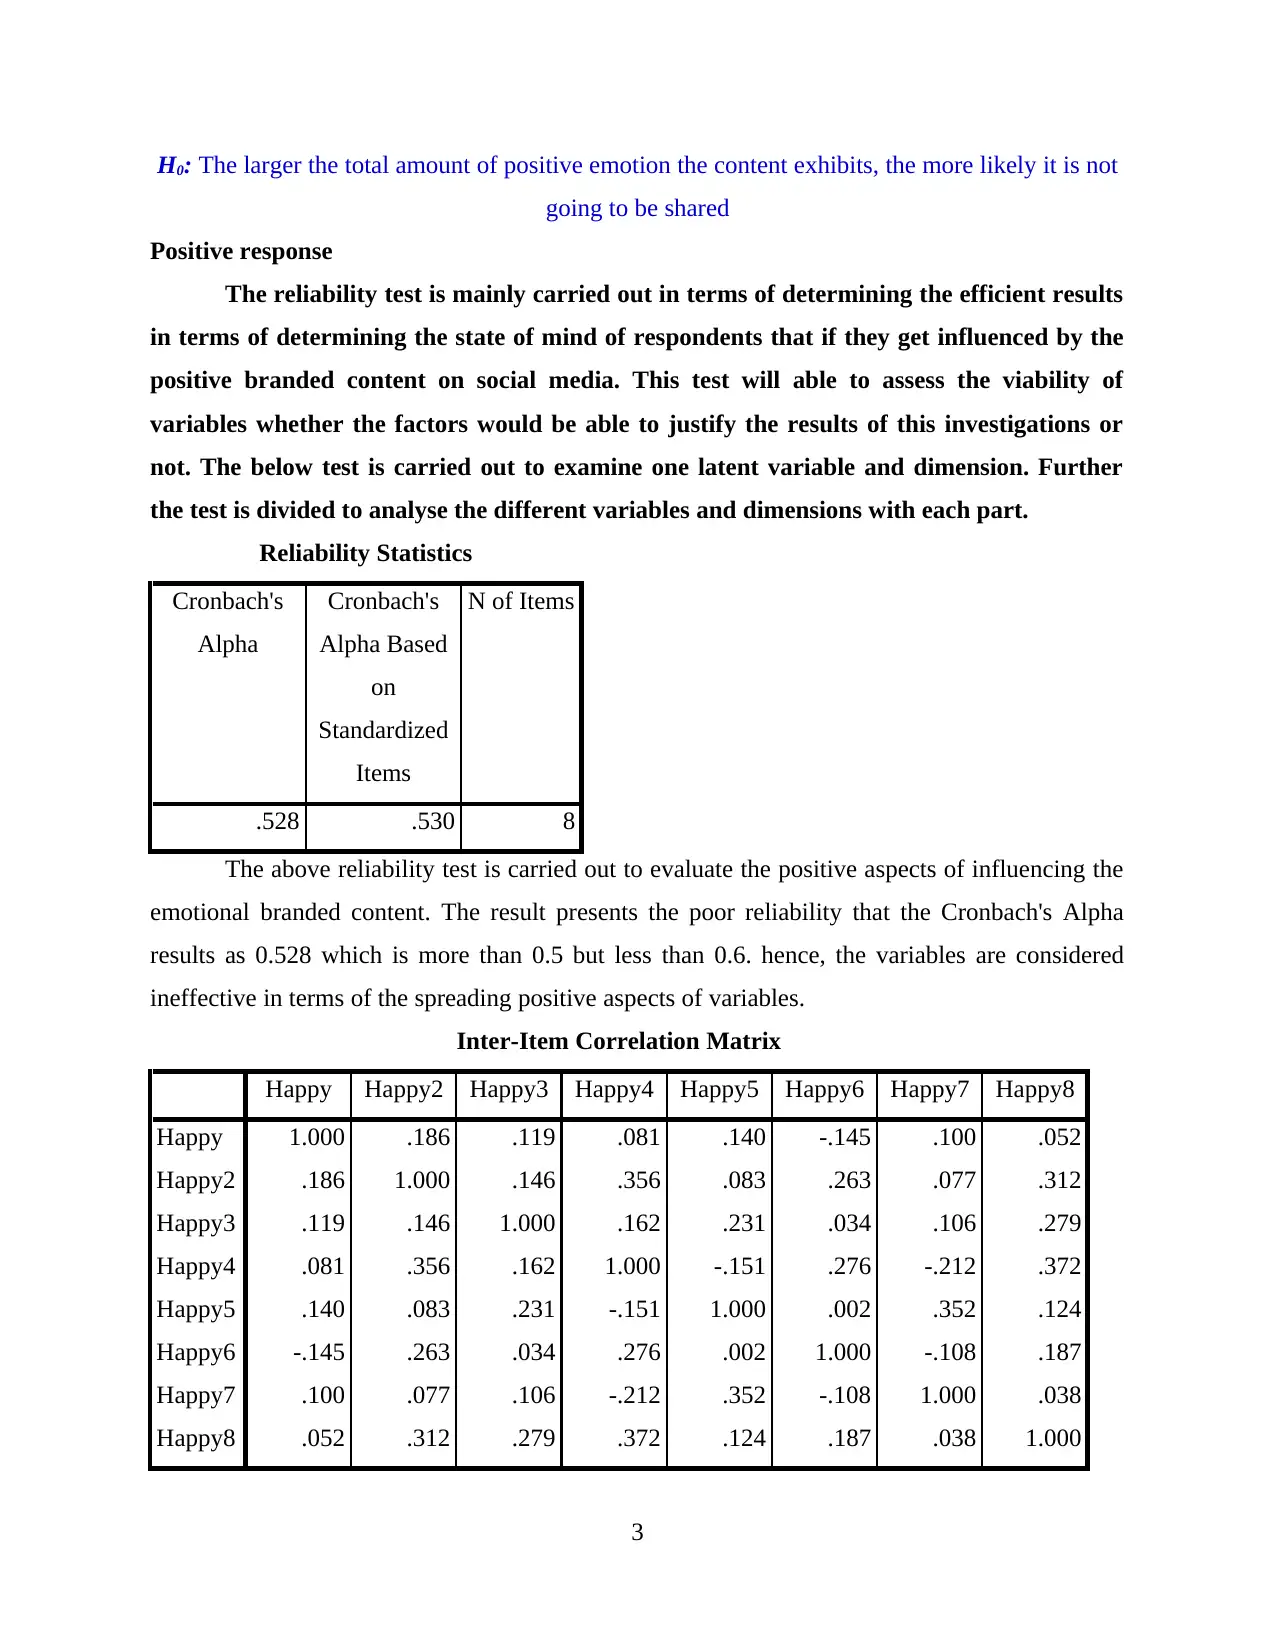
H0: The larger the total amount of positive emotion the content exhibits, the more likely it is not
going to be shared
Positive response
The reliability test is mainly carried out in terms of determining the efficient results
in terms of determining the state of mind of respondents that if they get influenced by the
positive branded content on social media. This test will able to assess the viability of
variables whether the factors would be able to justify the results of this investigations or
not. The below test is carried out to examine one latent variable and dimension. Further
the test is divided to analyse the different variables and dimensions with each part.
Reliability Statistics
Cronbach's
Alpha
Cronbach's
Alpha Based
on
Standardized
Items
N of Items
.528 .530 8
The above reliability test is carried out to evaluate the positive aspects of influencing the
emotional branded content. The result presents the poor reliability that the Cronbach's Alpha
results as 0.528 which is more than 0.5 but less than 0.6. hence, the variables are considered
ineffective in terms of the spreading positive aspects of variables.
Inter-Item Correlation Matrix
Happy Happy2 Happy3 Happy4 Happy5 Happy6 Happy7 Happy8
Happy 1.000 .186 .119 .081 .140 -.145 .100 .052
Happy2 .186 1.000 .146 .356 .083 .263 .077 .312
Happy3 .119 .146 1.000 .162 .231 .034 .106 .279
Happy4 .081 .356 .162 1.000 -.151 .276 -.212 .372
Happy5 .140 .083 .231 -.151 1.000 .002 .352 .124
Happy6 -.145 .263 .034 .276 .002 1.000 -.108 .187
Happy7 .100 .077 .106 -.212 .352 -.108 1.000 .038
Happy8 .052 .312 .279 .372 .124 .187 .038 1.000
3
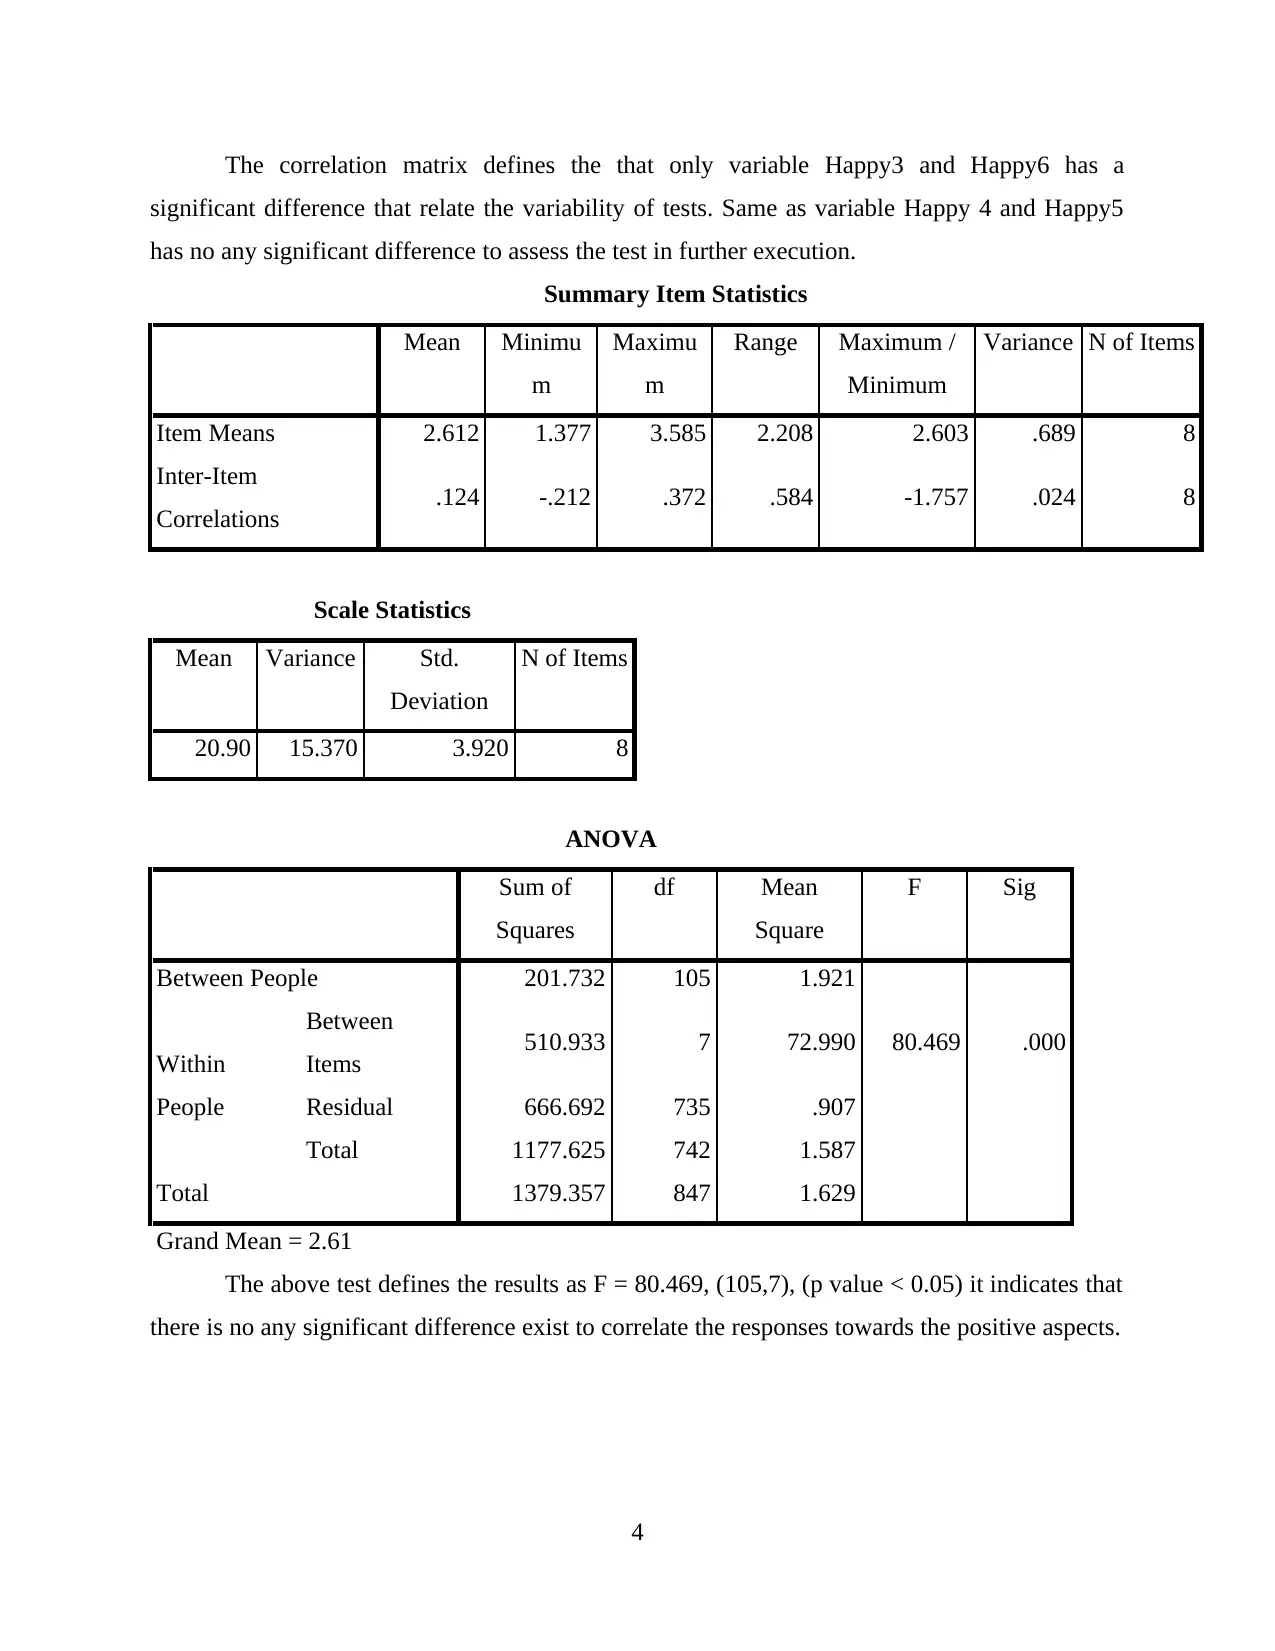
The correlation matrix defines the that only variable Happy3 and Happy6 has a
significant difference that relate the variability of tests. Same as variable Happy 4 and Happy5
has no any significant difference to assess the test in further execution.
Summary Item Statistics
Mean Minimu
m
Maximu
m
Range Maximum /
Minimum
Variance N of Items
Item Means 2.612 1.377 3.585 2.208 2.603 .689 8
Inter-Item
Correlations .124 -.212 .372 .584 -1.757 .024 8
Scale Statistics
Mean Variance Std.
Deviation
N of Items
20.90 15.370 3.920 8
ANOVA
Sum of
Squares
df Mean
Square
F Sig
Between People 201.732 105 1.921
Within
People
Between
Items 510.933 7 72.990 80.469 .000
Residual 666.692 735 .907
Total 1177.625 742 1.587
Total 1379.357 847 1.629
Grand Mean = 2.61
The above test defines the results as F = 80.469, (105,7), (p value < 0.05) it indicates that
there is no any significant difference exist to correlate the responses towards the positive aspects.
4
⊘ This is a preview!⊘
Do you want full access?
Subscribe today to unlock all pages.
Trusted by 1+ million students worldwide

H2: The larger the total amount of negative emotion the content exhibits, the more likely it is
going to be shared
H1: The larger the total amount of negative emotion the content exhibits, the more likely it is
going to be shared
H0: The larger the total amount of negative emotion the content exhibits, the more likely it is not
going to be shared
Negative response
The below reliability test is carried out to examine the tendency of respondents in terms
of sharing the negative emotional branded content. This test will help to evaluate the viability of
factors which are used to analyse the test.
Reliability Statistic
Cronbach's
Alpha
Cronbach's
Alpha Based
on
Standardized
Items
N of Items
.882 .882 32
In this case, α = .882, which shows the variables which are used to examine the
authenticity of the proposed investigation. As the results shows value of 0.9 ≥ α ≥ 0.8 which is
considered good sign that it indicates towards
ANOVA
Sum of
Squares
df Mean
Square
F Sig
Between People 201.732 105 1.921
Within
People
Between
Items 510.933 7 72.990 80.469 .000
Residual 666.692 735 .907
Total 1177.625 742 1.587
Total 1379.357 847 1.629
Grand Mean = 2.61
5
going to be shared
H1: The larger the total amount of negative emotion the content exhibits, the more likely it is
going to be shared
H0: The larger the total amount of negative emotion the content exhibits, the more likely it is not
going to be shared
Negative response
The below reliability test is carried out to examine the tendency of respondents in terms
of sharing the negative emotional branded content. This test will help to evaluate the viability of
factors which are used to analyse the test.
Reliability Statistic
Cronbach's
Alpha
Cronbach's
Alpha Based
on
Standardized
Items
N of Items
.882 .882 32
In this case, α = .882, which shows the variables which are used to examine the
authenticity of the proposed investigation. As the results shows value of 0.9 ≥ α ≥ 0.8 which is
considered good sign that it indicates towards
ANOVA
Sum of
Squares
df Mean
Square
F Sig
Between People 201.732 105 1.921
Within
People
Between
Items 510.933 7 72.990 80.469 .000
Residual 666.692 735 .907
Total 1177.625 742 1.587
Total 1379.357 847 1.629
Grand Mean = 2.61
5
Paraphrase This Document
Need a fresh take? Get an instant paraphrase of this document with our AI Paraphraser
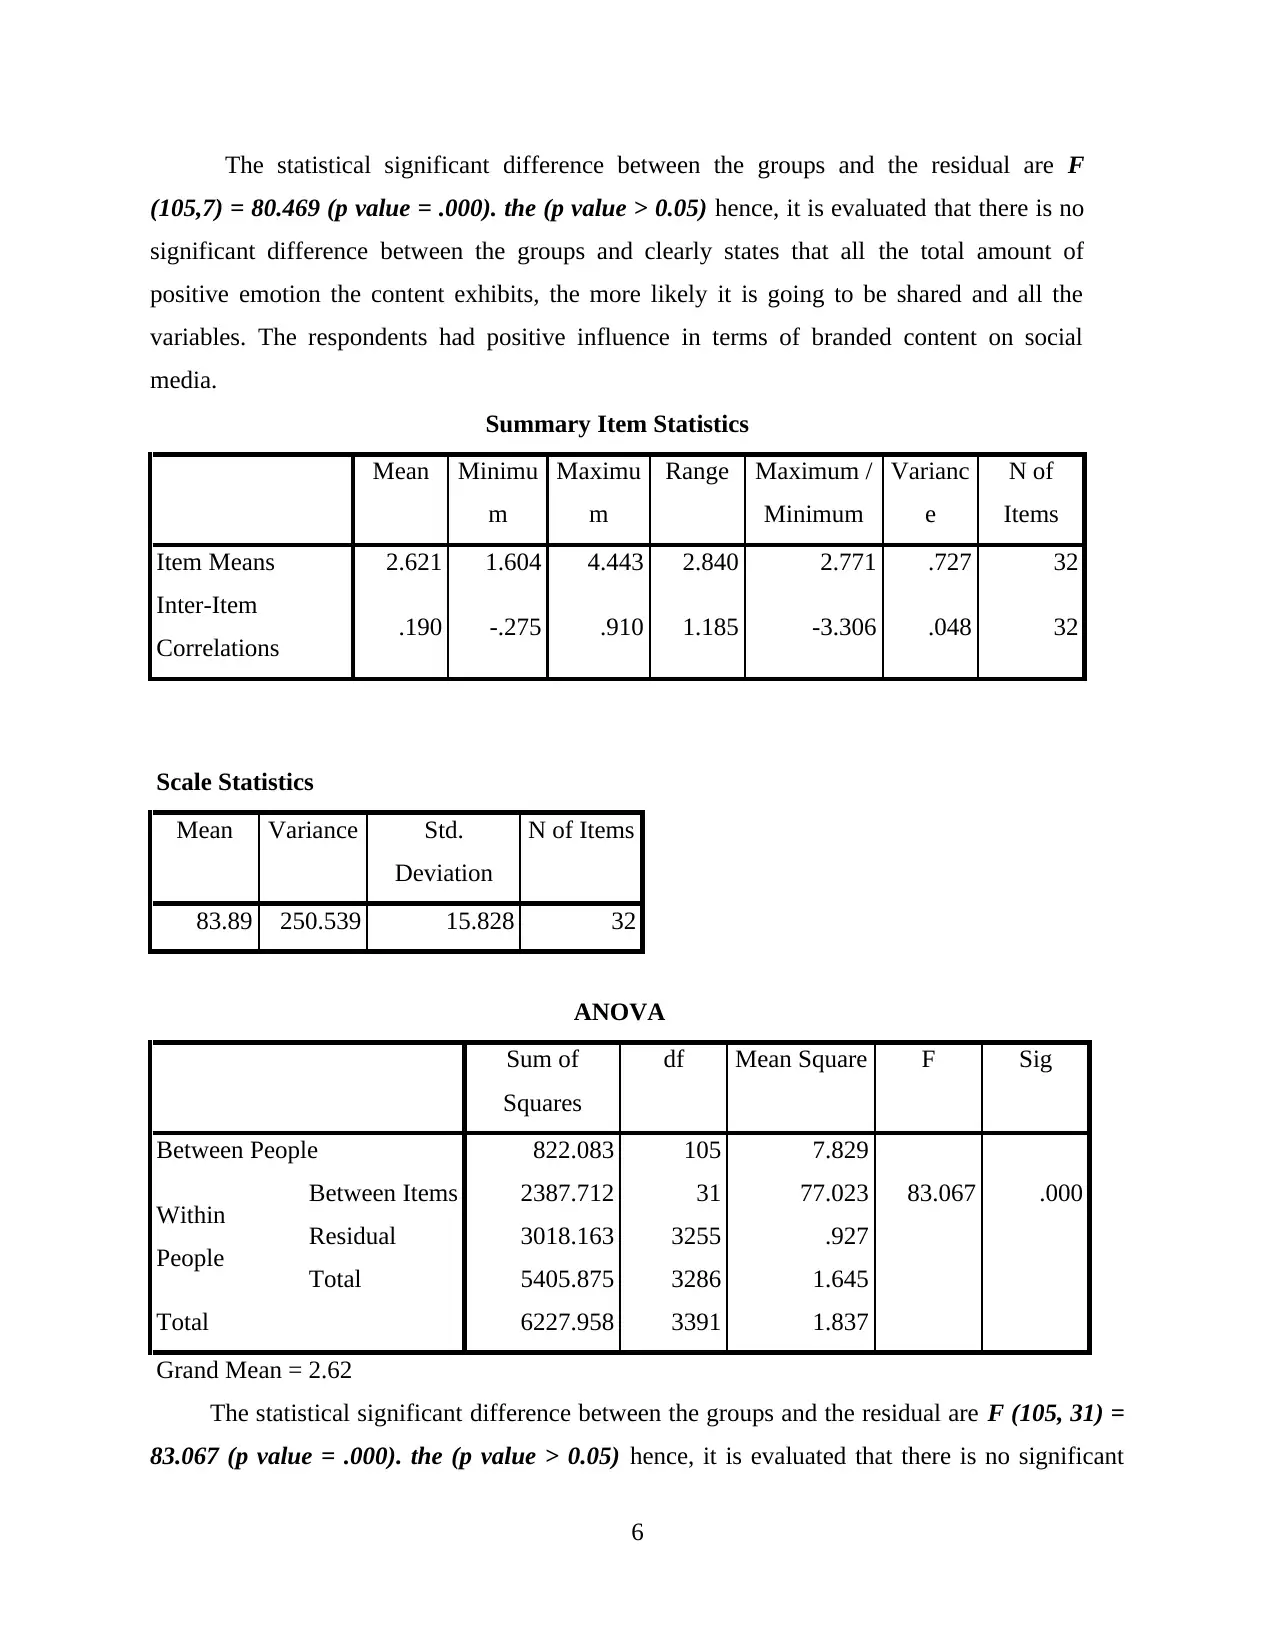
The statistical significant difference between the groups and the residual are F
(105,7) = 80.469 (p value = .000). the (p value > 0.05) hence, it is evaluated that there is no
significant difference between the groups and clearly states that all the total amount of
positive emotion the content exhibits, the more likely it is going to be shared and all the
variables. The respondents had positive influence in terms of branded content on social
media.
Summary Item Statistics
Mean Minimu
m
Maximu
m
Range Maximum /
Minimum
Varianc
e
N of
Items
Item Means 2.621 1.604 4.443 2.840 2.771 .727 32
Inter-Item
Correlations .190 -.275 .910 1.185 -3.306 .048 32
Scale Statistics
Mean Variance Std.
Deviation
N of Items
83.89 250.539 15.828 32
ANOVA
Sum of
Squares
df Mean Square F Sig
Between People 822.083 105 7.829
Within
People
Between Items 2387.712 31 77.023 83.067 .000
Residual 3018.163 3255 .927
Total 5405.875 3286 1.645
Total 6227.958 3391 1.837
Grand Mean = 2.62
The statistical significant difference between the groups and the residual are F (105, 31) =
83.067 (p value = .000). the (p value > 0.05) hence, it is evaluated that there is no significant
6
difference between the groups and clearly states that all the total amount of negative emotion the
content exhibits, the more likely it is going to be shared and all the variables. the respondents had
positive influence in terms of branded content on social media.
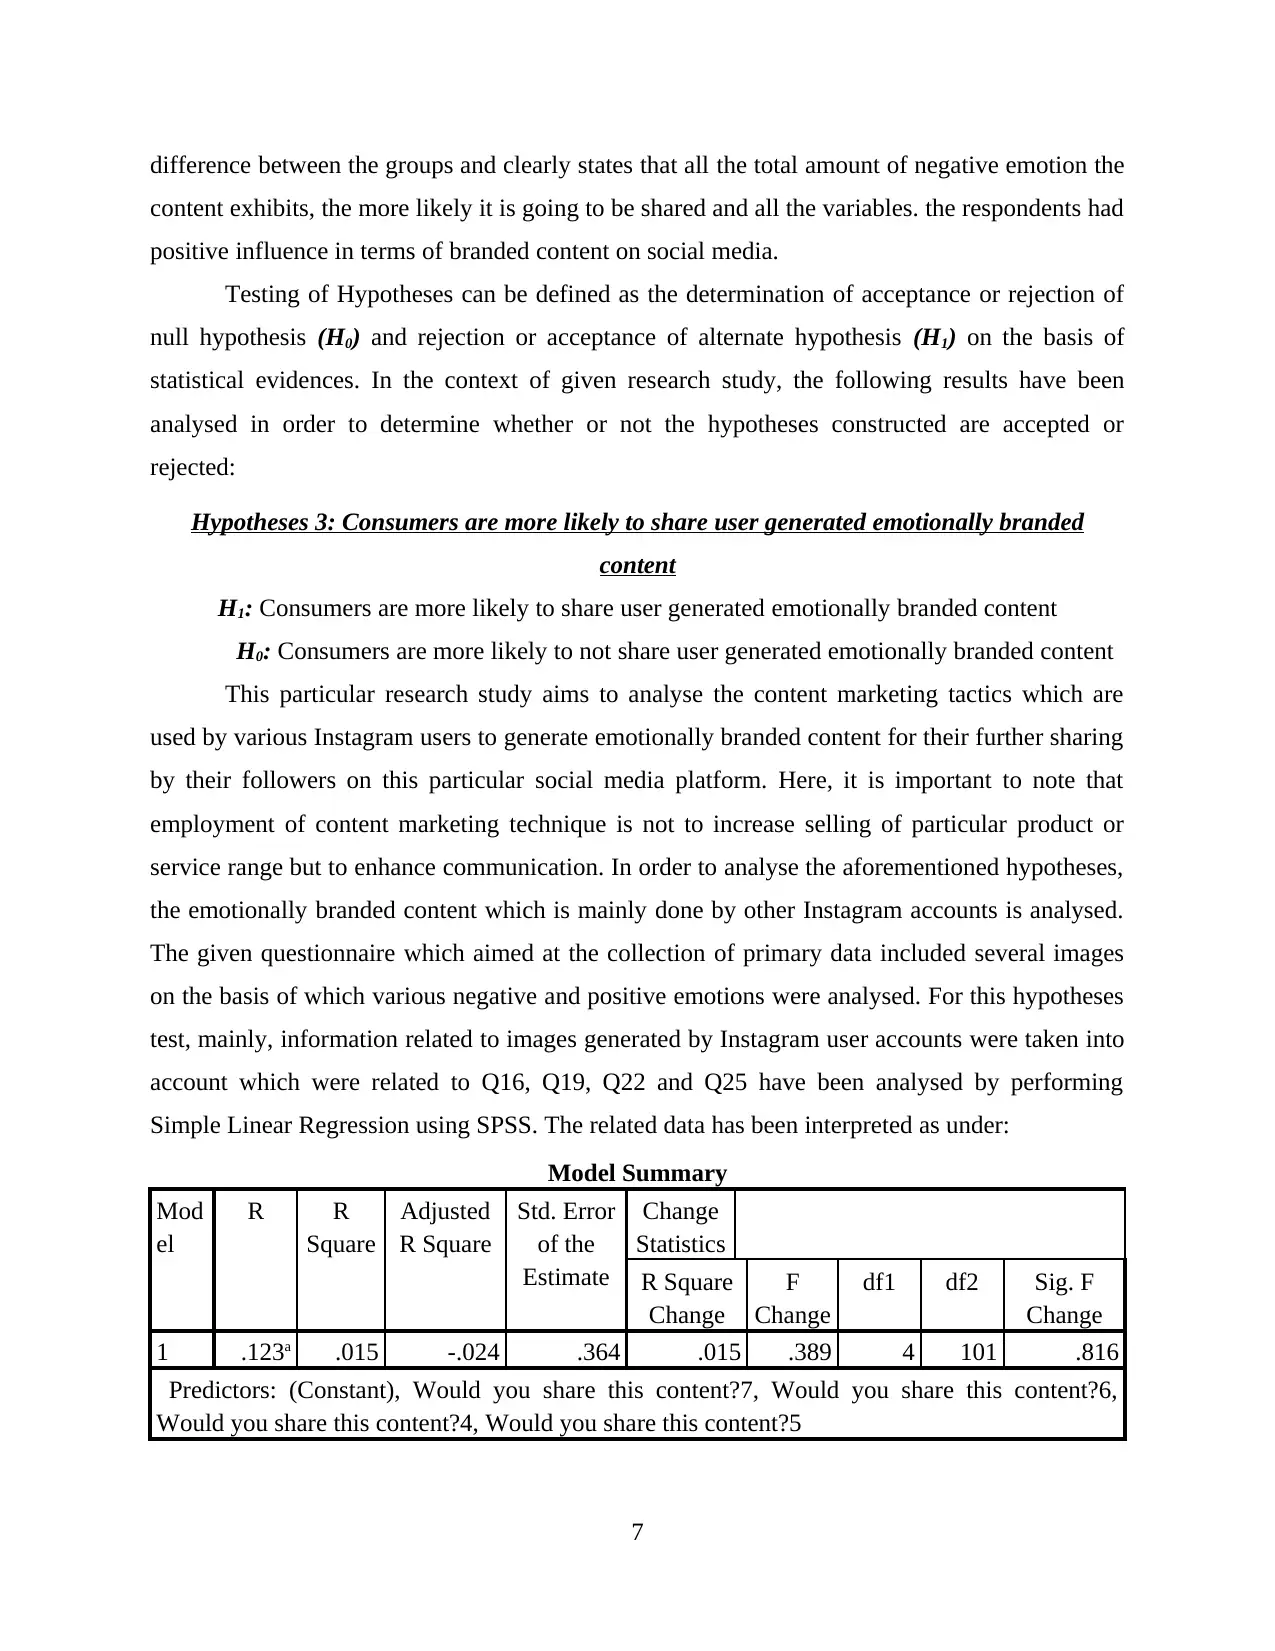
Testing of Hypotheses can be defined as the determination of acceptance or rejection of
null hypothesis (H0) and rejection or acceptance of alternate hypothesis (H1) on the basis of
statistical evidences. In the context of given research study, the following results have been
analysed in order to determine whether or not the hypotheses constructed are accepted or
rejected:
Hypotheses 3: Consumers are more likely to share user generated emotionally branded
content
H1: Consumers are more likely to share user generated emotionally branded content
H0: Consumers are more likely to not share user generated emotionally branded content
This particular research study aims to analyse the content marketing tactics which are
used by various Instagram users to generate emotionally branded content for their further sharing
by their followers on this particular social media platform. Here, it is important to note that
employment of content marketing technique is not to increase selling of particular product or
service range but to enhance communication. In order to analyse the aforementioned hypotheses,
the emotionally branded content which is mainly done by other Instagram accounts is analysed.
The given questionnaire which aimed at the collection of primary data included several images
on the basis of which various negative and positive emotions were analysed. For this hypotheses
test, mainly, information related to images generated by Instagram user accounts were taken into
account which were related to Q16, Q19, Q22 and Q25 have been analysed by performing
Simple Linear Regression using SPSS. The related data has been interpreted as under:
Model Summary
Mod
el
R R
Square
Adjusted
R Square
Std. Error
of the
Estimate
Change
Statistics
R Square
Change
F
Change
df1 df2 Sig. F
Change
1 .123a .015 -.024 .364 .015 .389 4 101 .816
Predictors: (Constant), Would you share this content?7, Would you share this content?6,
Would you share this content?4, Would you share this content?5
7
content exhibits, the more likely it is going to be shared and all the variables. the respondents had
positive influence in terms of branded content on social media.
Testing of Hypotheses can be defined as the determination of acceptance or rejection of
null hypothesis (H0) and rejection or acceptance of alternate hypothesis (H1) on the basis of
statistical evidences. In the context of given research study, the following results have been
analysed in order to determine whether or not the hypotheses constructed are accepted or
rejected:
Hypotheses 3: Consumers are more likely to share user generated emotionally branded
content
H1: Consumers are more likely to share user generated emotionally branded content
H0: Consumers are more likely to not share user generated emotionally branded content
This particular research study aims to analyse the content marketing tactics which are
used by various Instagram users to generate emotionally branded content for their further sharing
by their followers on this particular social media platform. Here, it is important to note that
employment of content marketing technique is not to increase selling of particular product or
service range but to enhance communication. In order to analyse the aforementioned hypotheses,
the emotionally branded content which is mainly done by other Instagram accounts is analysed.
The given questionnaire which aimed at the collection of primary data included several images
on the basis of which various negative and positive emotions were analysed. For this hypotheses
test, mainly, information related to images generated by Instagram user accounts were taken into
account which were related to Q16, Q19, Q22 and Q25 have been analysed by performing
Simple Linear Regression using SPSS. The related data has been interpreted as under:
Model Summary
Mod
el
R R
Square
Adjusted
R Square
Std. Error
of the
Estimate
Change
Statistics
R Square
Change
F
Change
df1 df2 Sig. F
Change
1 .123a .015 -.024 .364 .015 .389 4 101 .816
Predictors: (Constant), Would you share this content?7, Would you share this content?6,
Would you share this content?4, Would you share this content?5
7
⊘ This is a preview!⊘
Do you want full access?
Subscribe today to unlock all pages.
Trusted by 1+ million students worldwide
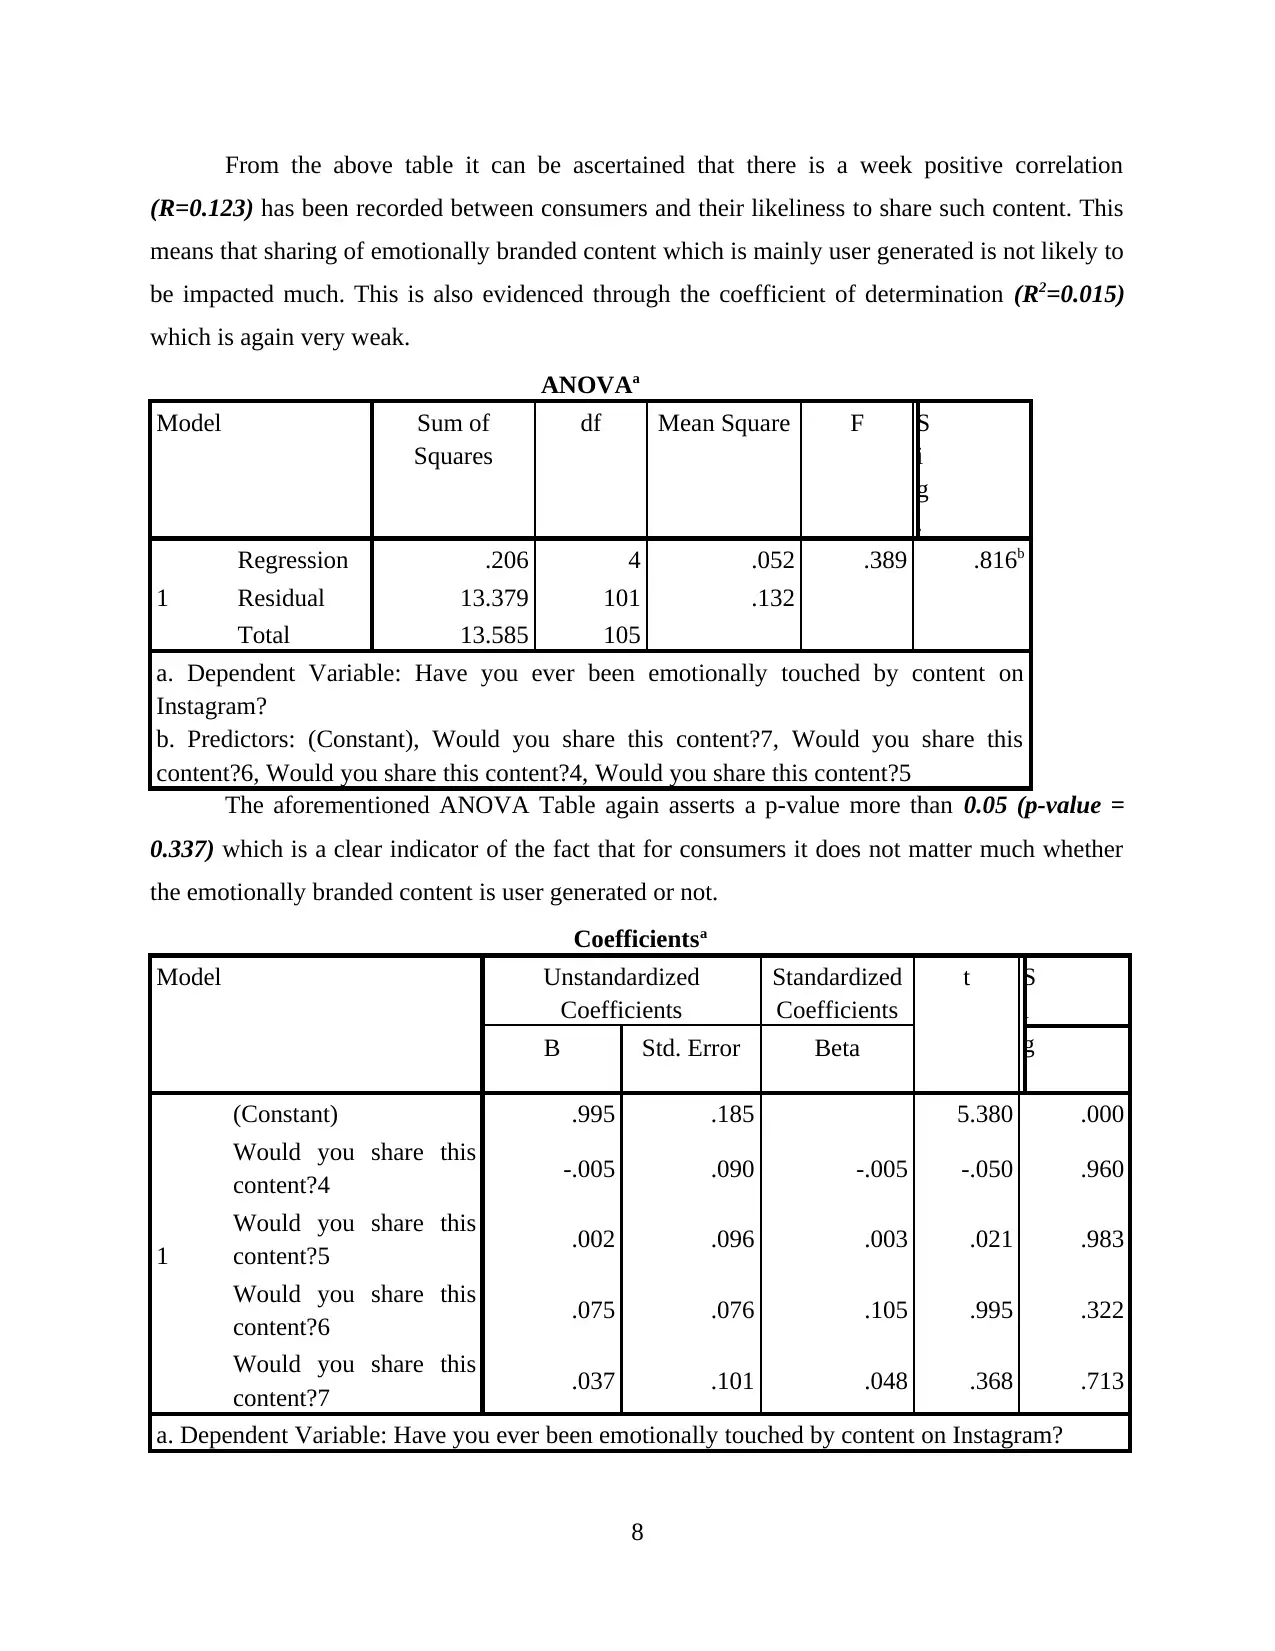
From the above table it can be ascertained that there is a week positive correlation
(R=0.123) has been recorded between consumers and their likeliness to share such content. This
means that sharing of emotionally branded content which is mainly user generated is not likely to
be impacted much. This is also evidenced through the coefficient of determination (R2=0.015)
which is again very weak.
ANOVAa
Model Sum of
Squares
df Mean Square F S
i
g
.
1
Regression .206 4 .052 .389 .816b
Residual 13.379 101 .132
Total 13.585 105
a. Dependent Variable: Have you ever been emotionally touched by content on
Instagram?
b. Predictors: (Constant), Would you share this content?7, Would you share this
content?6, Would you share this content?4, Would you share this content?5
The aforementioned ANOVA Table again asserts a p-value more than 0.05 (p-value =
0.337) which is a clear indicator of the fact that for consumers it does not matter much whether
the emotionally branded content is user generated or not.
Coefficientsa
Model Unstandardized
Coefficients
Standardized
Coefficients
t S
i
g
.
B Std. Error Beta
1
(Constant) .995 .185 5.380 .000
Would you share this
content?4 -.005 .090 -.005 -.050 .960
Would you share this
content?5 .002 .096 .003 .021 .983
Would you share this
content?6 .075 .076 .105 .995 .322
Would you share this
content?7 .037 .101 .048 .368 .713
a. Dependent Variable: Have you ever been emotionally touched by content on Instagram?
8
Paraphrase This Document
Need a fresh take? Get an instant paraphrase of this document with our AI Paraphraser
The p-values here also state that there is a significant impact contributed by the statement
“would you share this content?” is less than p-value threshold (p-value = 0.000) which is clear in
evidencing that consumers are likely to share content which emotionally touches them. However,
it does not matter that such content is generated by user does not matter as all the p-values
relating to those images which have been provided in the questionnaire, viz. Q16, Q19, Q22 and
Q25 have a p-value more than 0.05.
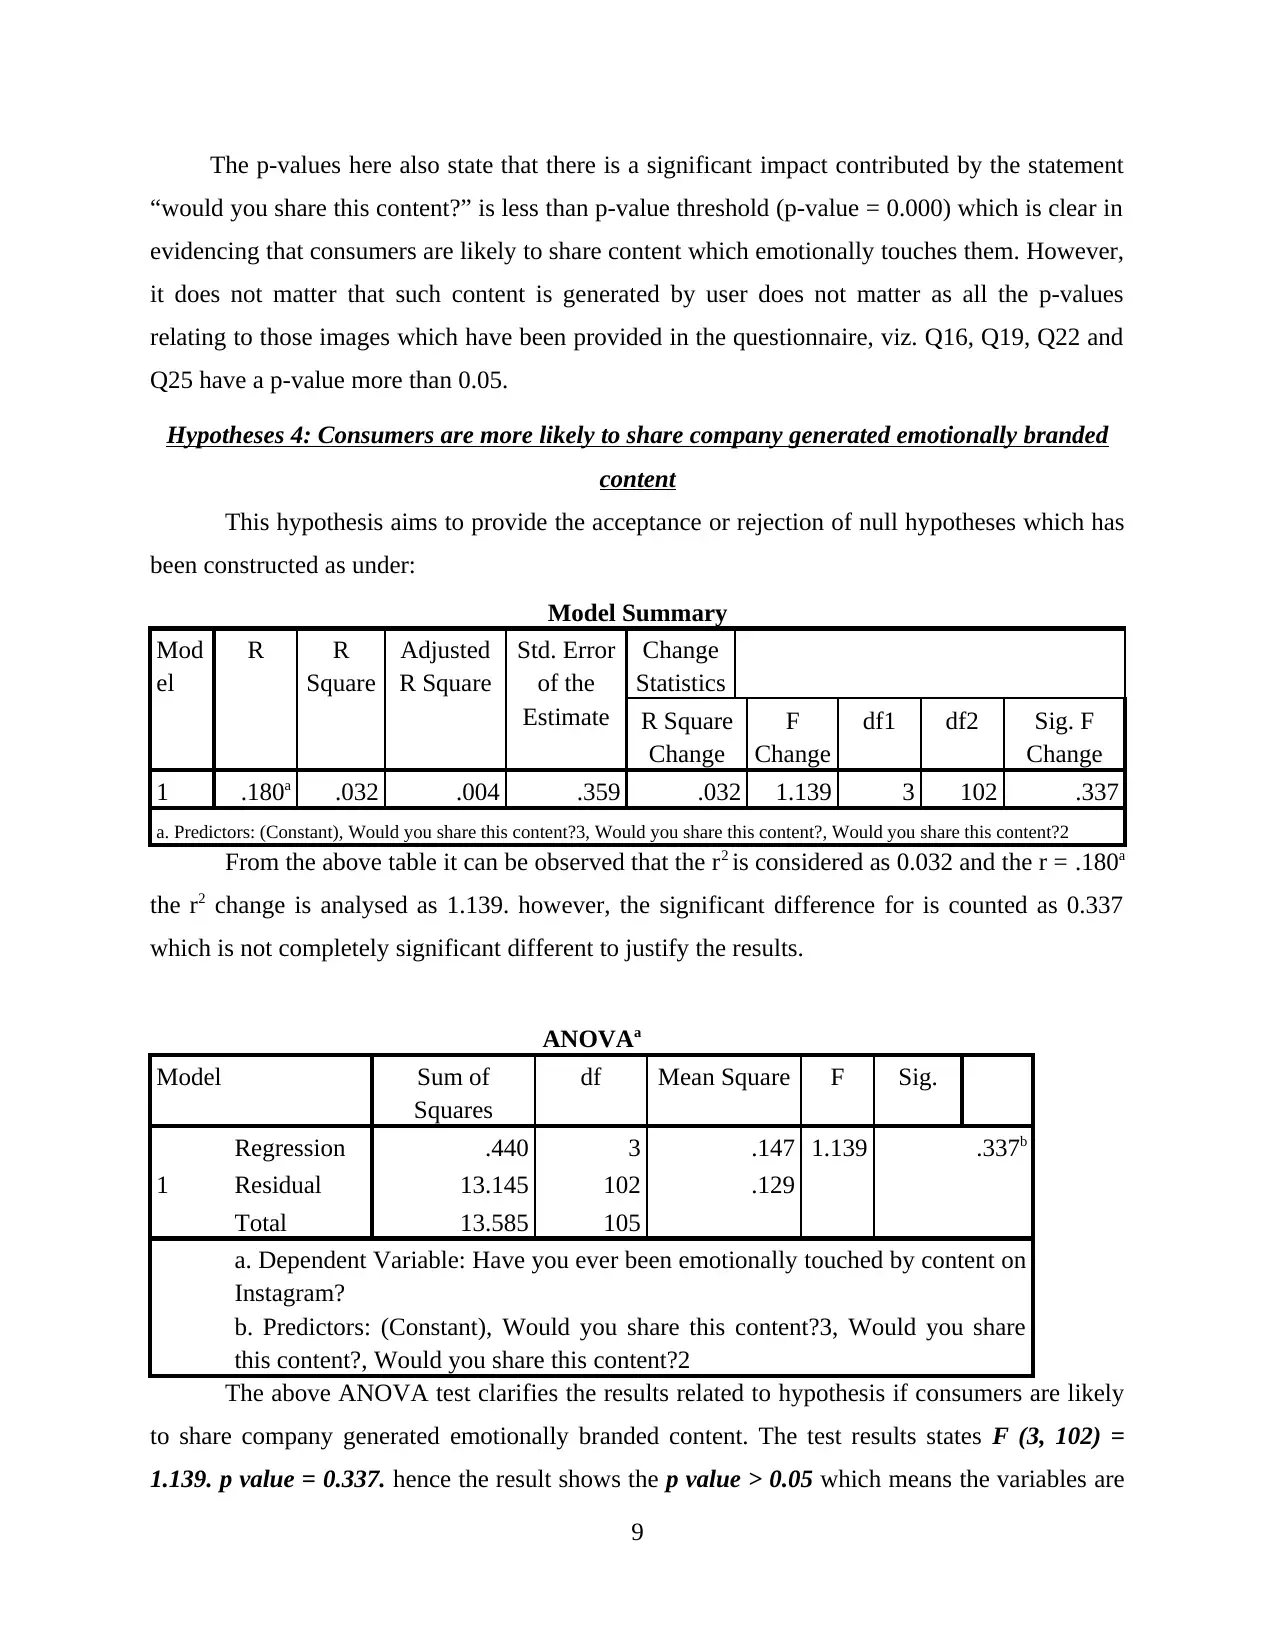
Hypotheses 4: Consumers are more likely to share company generated emotionally branded
content
This hypothesis aims to provide the acceptance or rejection of null hypotheses which has
been constructed as under:
Model Summary
Mod
el
R R
Square
Adjusted
R Square
Std. Error
of the
Estimate
Change
Statistics
R Square
Change
F
Change
df1 df2 Sig. F
Change
1 .180a .032 .004 .359 .032 1.139 3 102 .337
a. Predictors: (Constant), Would you share this content?3, Would you share this content?, Would you share this content?2
From the above table it can be observed that the r2 is considered as 0.032 and the r = .180a
the r2 change is analysed as 1.139. however, the significant difference for is counted as 0.337
which is not completely significant different to justify the results.
ANOVAa
Model Sum of
Squares
df Mean Square F Sig.
1
Regression .440 3 .147 1.139 .337b
Residual 13.145 102 .129
Total 13.585 105
a. Dependent Variable: Have you ever been emotionally touched by content on
Instagram?
b. Predictors: (Constant), Would you share this content?3, Would you share
this content?, Would you share this content?2
The above ANOVA test clarifies the results related to hypothesis if consumers are likely
to share company generated emotionally branded content. The test results states F (3, 102) =
1.139. p value = 0.337. hence the result shows the p value > 0.05 which means the variables are
9
“would you share this content?” is less than p-value threshold (p-value = 0.000) which is clear in
evidencing that consumers are likely to share content which emotionally touches them. However,
it does not matter that such content is generated by user does not matter as all the p-values
relating to those images which have been provided in the questionnaire, viz. Q16, Q19, Q22 and
Q25 have a p-value more than 0.05.
Hypotheses 4: Consumers are more likely to share company generated emotionally branded
content
This hypothesis aims to provide the acceptance or rejection of null hypotheses which has
been constructed as under:
Model Summary
Mod
el
R R
Square
Adjusted
R Square
Std. Error
of the
Estimate
Change
Statistics
R Square
Change
F
Change
df1 df2 Sig. F
Change
1 .180a .032 .004 .359 .032 1.139 3 102 .337
a. Predictors: (Constant), Would you share this content?3, Would you share this content?, Would you share this content?2
From the above table it can be observed that the r2 is considered as 0.032 and the r = .180a
the r2 change is analysed as 1.139. however, the significant difference for is counted as 0.337
which is not completely significant different to justify the results.
ANOVAa
Model Sum of
Squares
df Mean Square F Sig.
1
Regression .440 3 .147 1.139 .337b
Residual 13.145 102 .129
Total 13.585 105
a. Dependent Variable: Have you ever been emotionally touched by content on
Instagram?
b. Predictors: (Constant), Would you share this content?3, Would you share
this content?, Would you share this content?2
The above ANOVA test clarifies the results related to hypothesis if consumers are likely
to share company generated emotionally branded content. The test results states F (3, 102) =
1.139. p value = 0.337. hence the result shows the p value > 0.05 which means the variables are
9
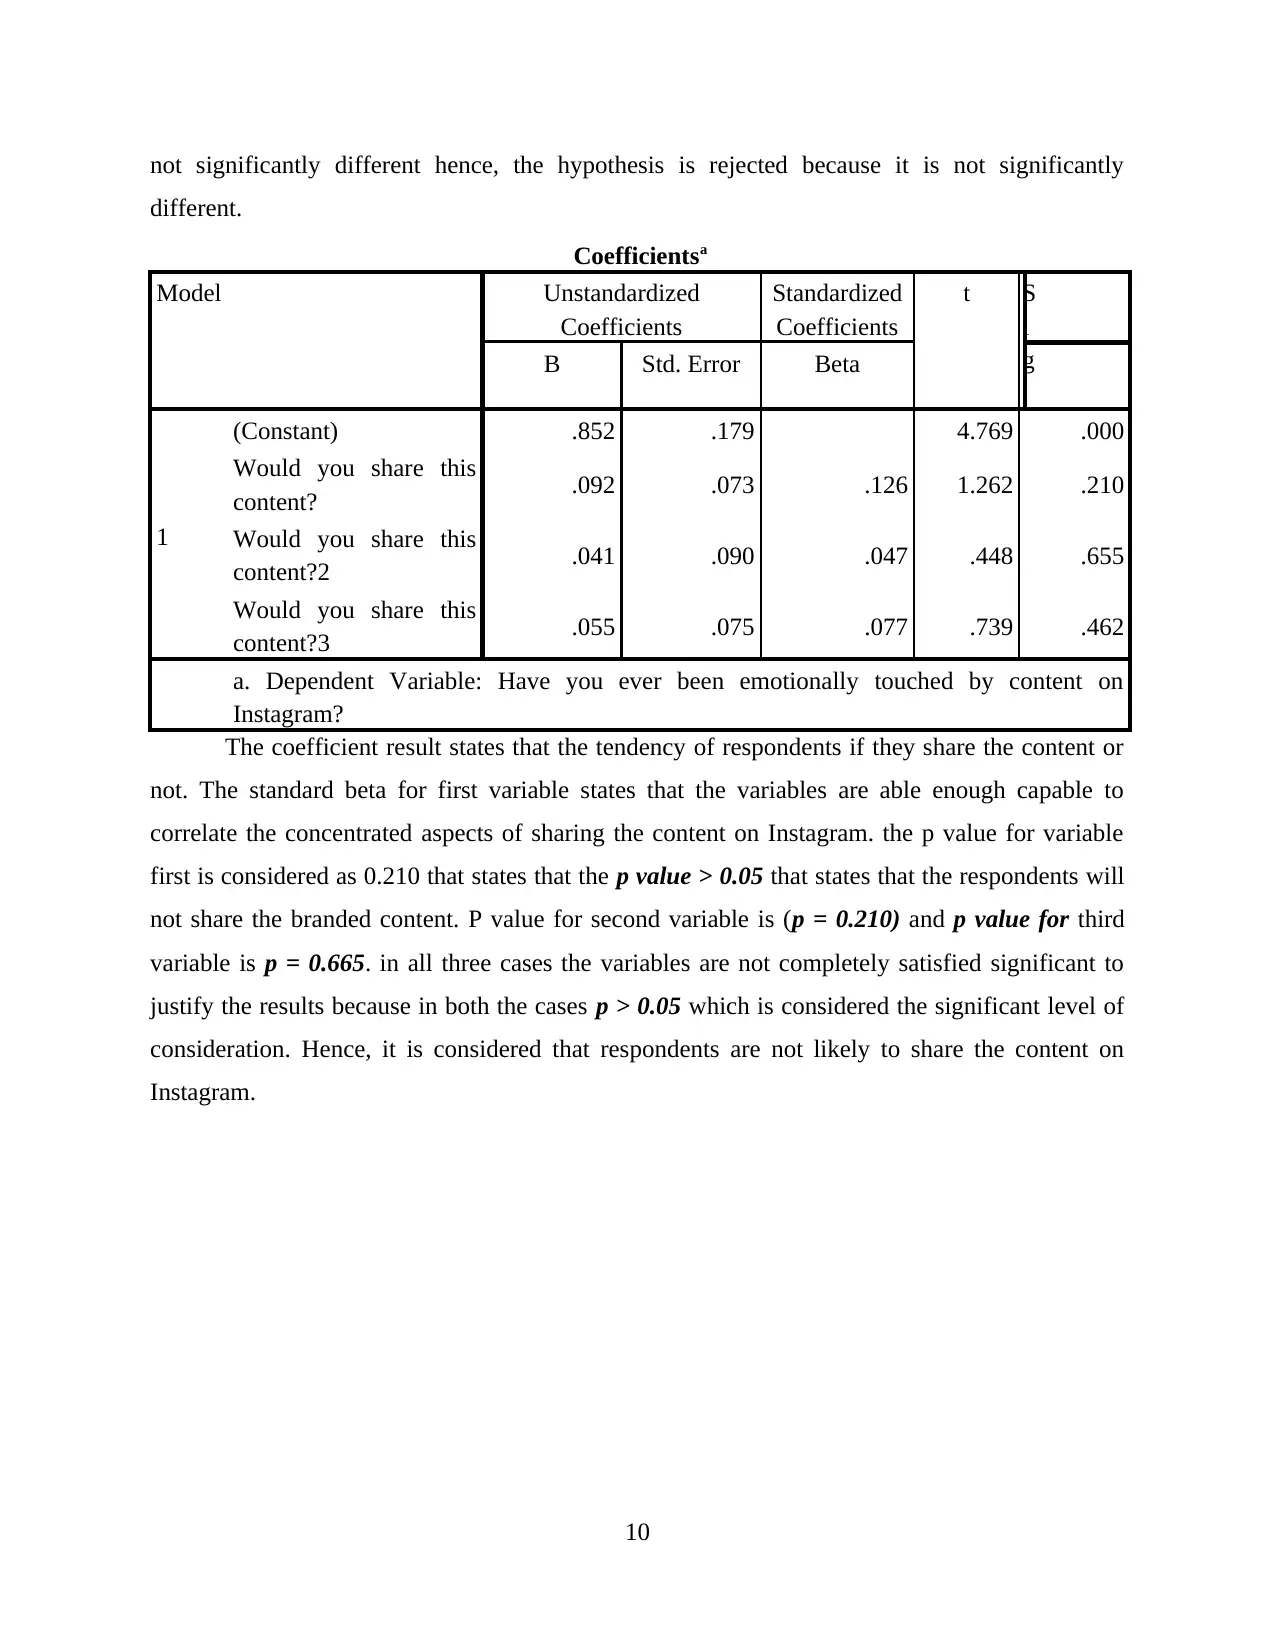
not significantly different hence, the hypothesis is rejected because it is not significantly
different.
Coefficientsa
Model Unstandardized
Coefficients
Standardized
Coefficients
t S
i
g
.
B Std. Error Beta
1
(Constant) .852 .179 4.769 .000
Would you share this
content? .092 .073 .126 1.262 .210
Would you share this
content?2 .041 .090 .047 .448 .655
Would you share this
content?3 .055 .075 .077 .739 .462
a. Dependent Variable: Have you ever been emotionally touched by content on
Instagram?
The coefficient result states that the tendency of respondents if they share the content or
not. The standard beta for first variable states that the variables are able enough capable to
correlate the concentrated aspects of sharing the content on Instagram. the p value for variable
first is considered as 0.210 that states that the p value > 0.05 that states that the respondents will
not share the branded content. P value for second variable is (p = 0.210) and p value for third
variable is p = 0.665. in all three cases the variables are not completely satisfied significant to
justify the results because in both the cases p > 0.05 which is considered the significant level of
consideration. Hence, it is considered that respondents are not likely to share the content on
Instagram.
10
⊘ This is a preview!⊘
Do you want full access?
Subscribe today to unlock all pages.
Trusted by 1+ million students worldwide
1 out of 14

Your All-in-One AI-Powered Toolkit for Academic Success.
+13062052269
info@desklib.com
Available 24*7 on WhatsApp / Email
![[object Object]](/_next/static/media/star-bottom.7253800d.svg)
Unlock your academic potential
Copyright © 2020–2026 A2Z Services. All Rights Reserved. Developed and managed by ZUCOL.