System Analysis and Design Report: Brisbane Multi-Faith Temple Project
VerifiedAdded on  2020/05/16
|25
|2595
|210
Report
AI Summary
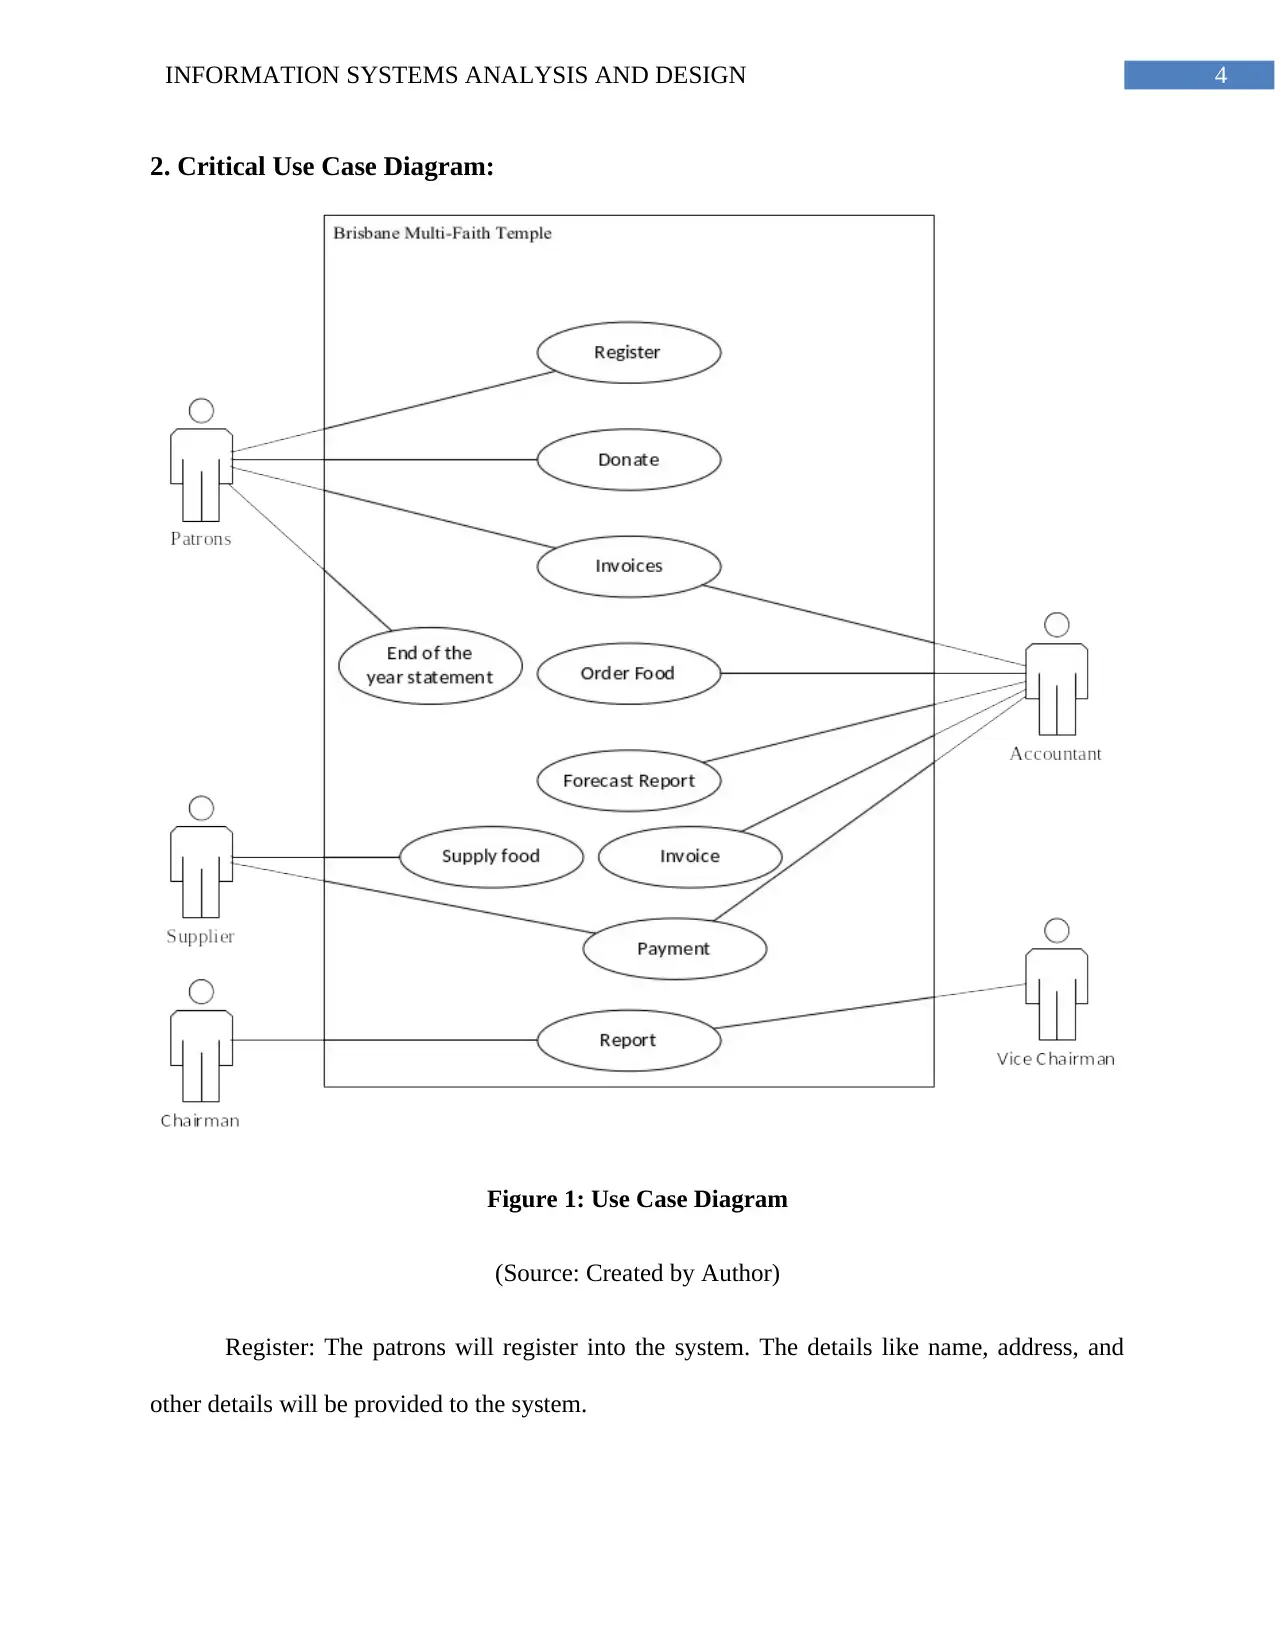
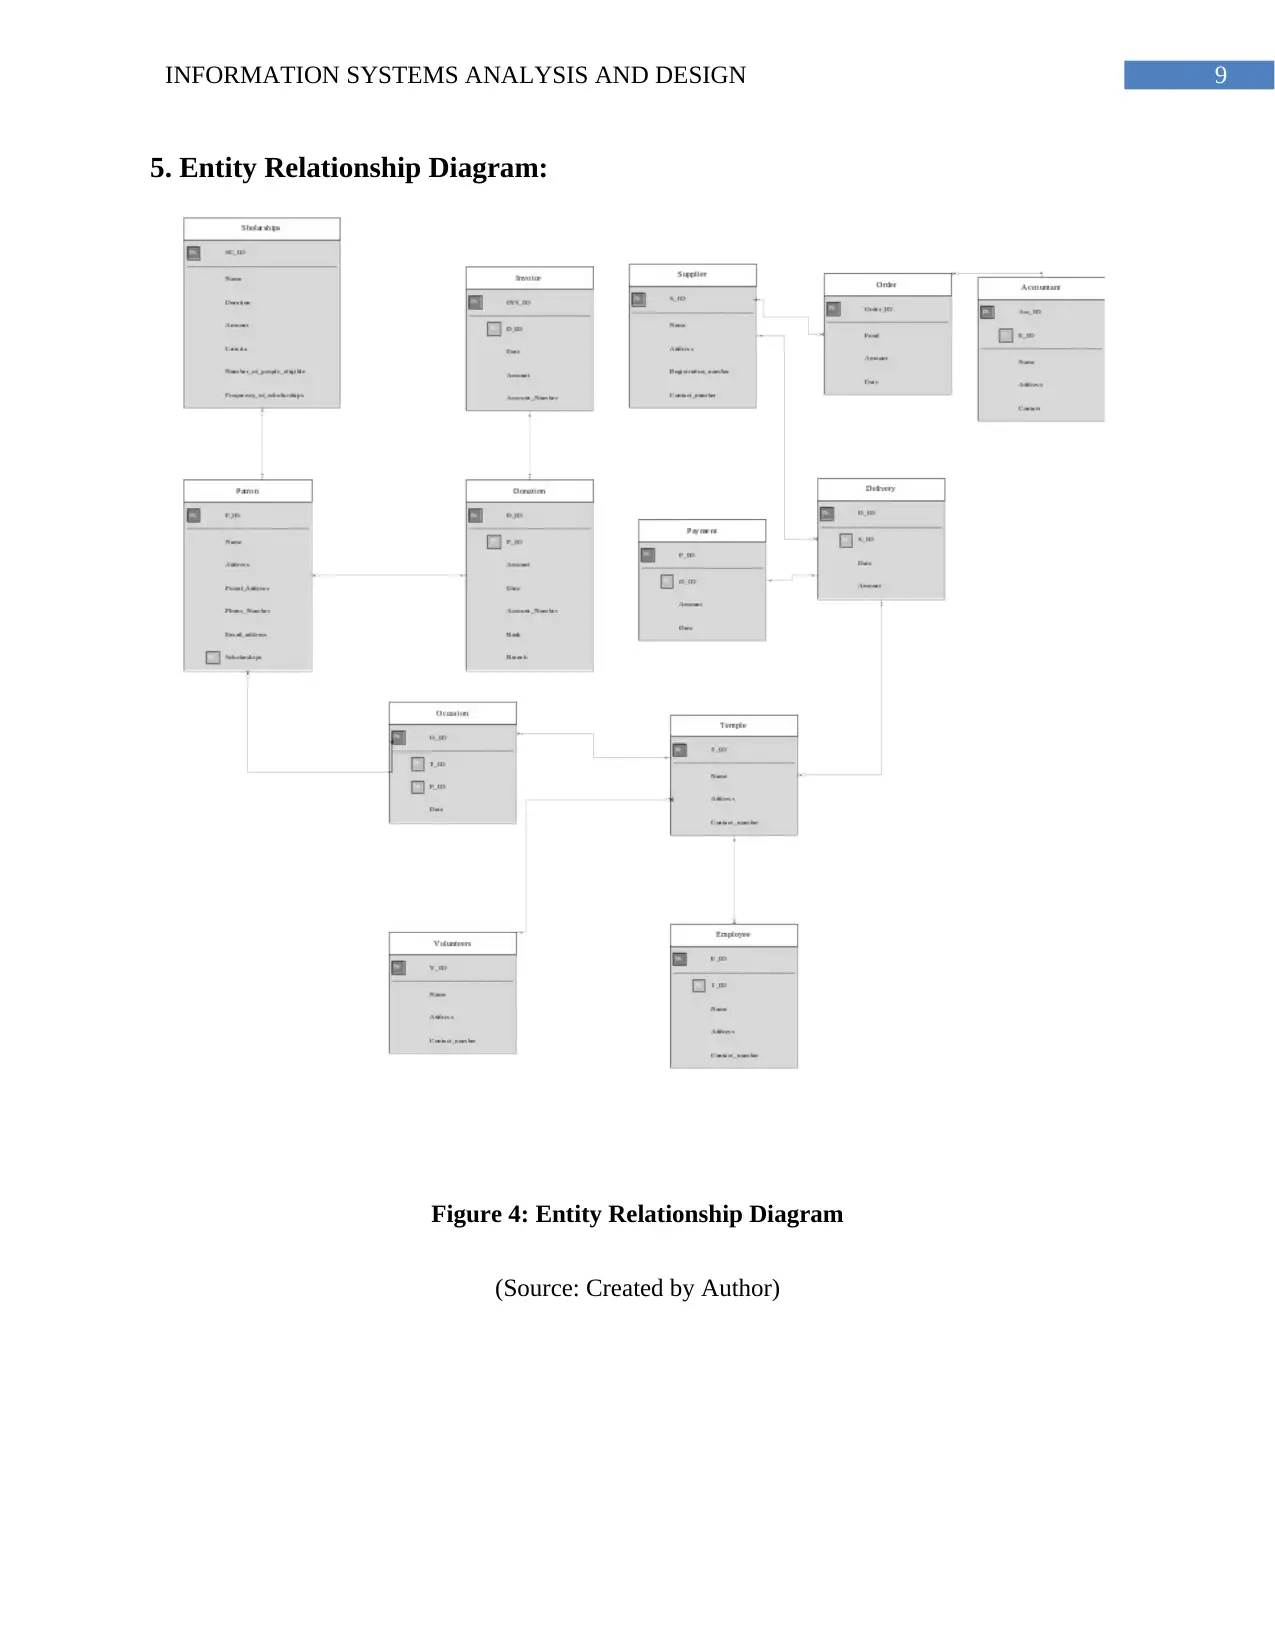
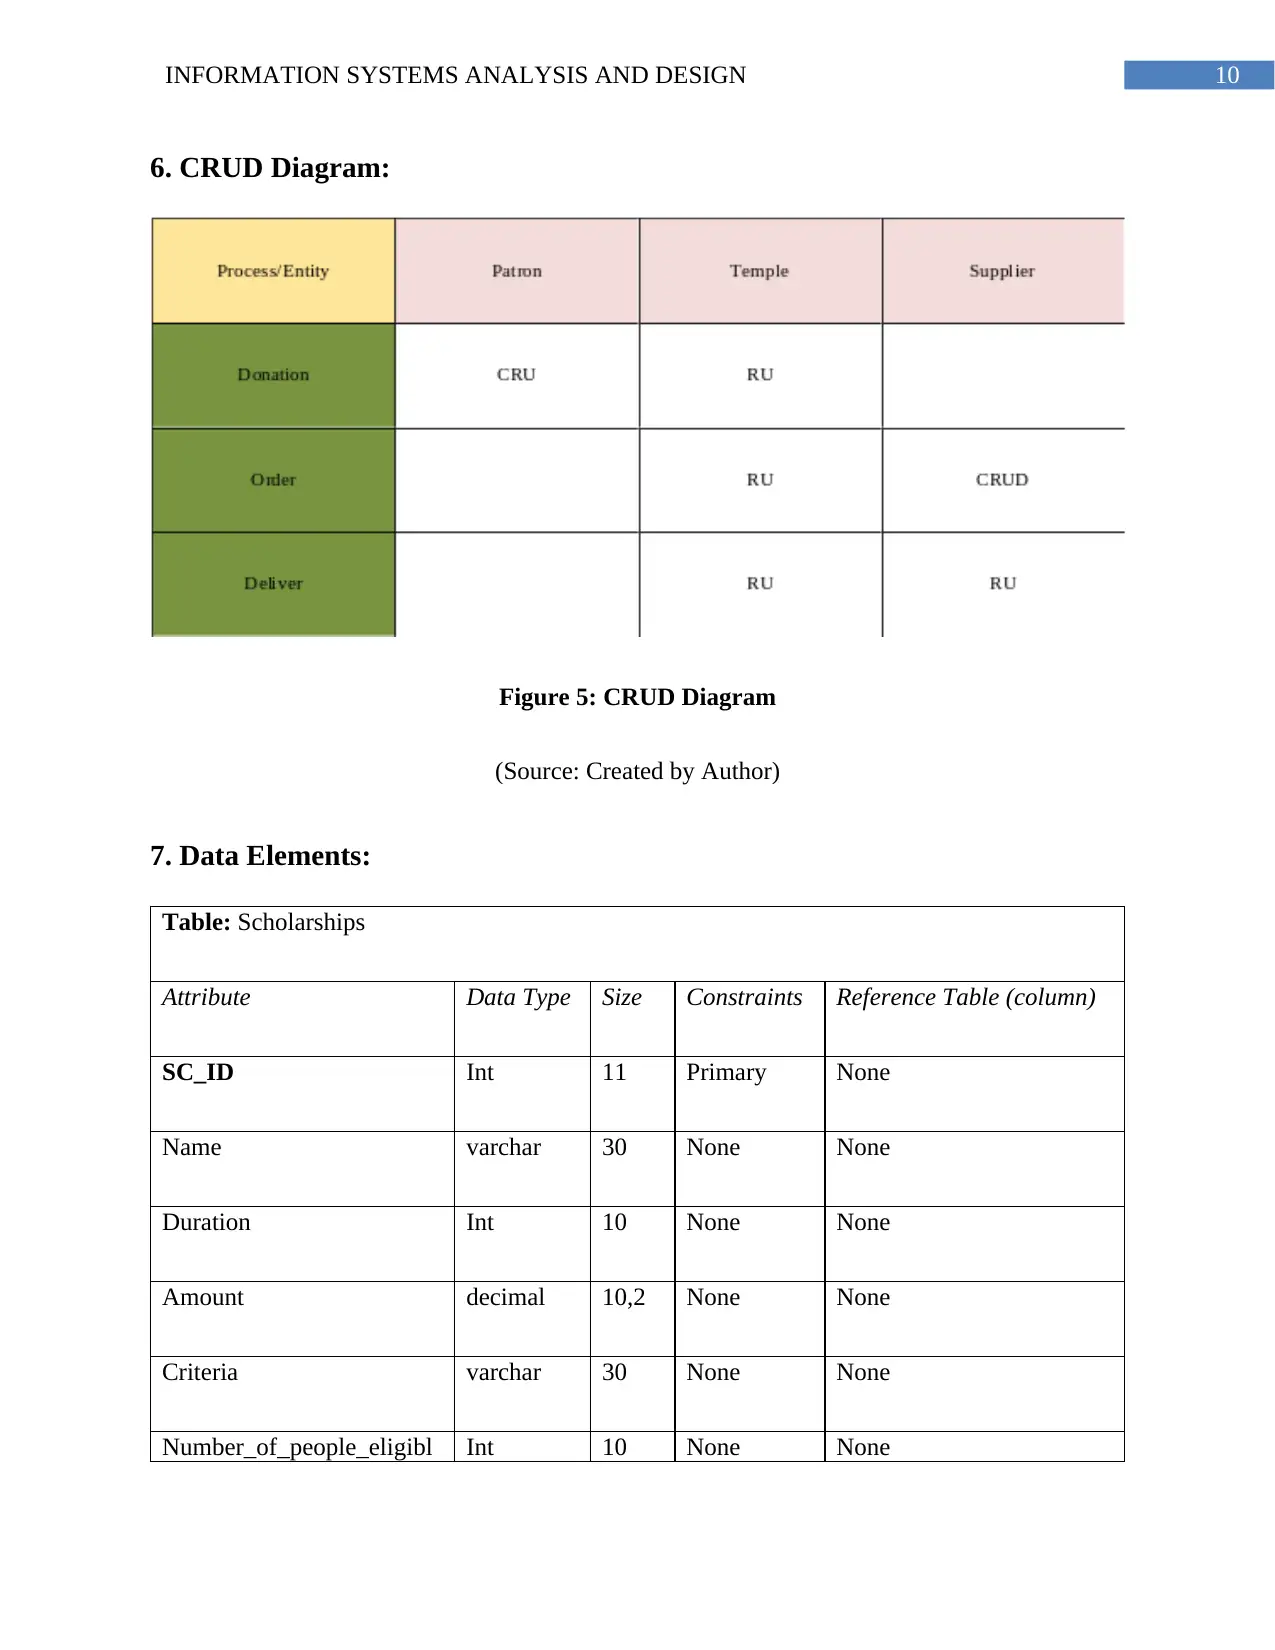
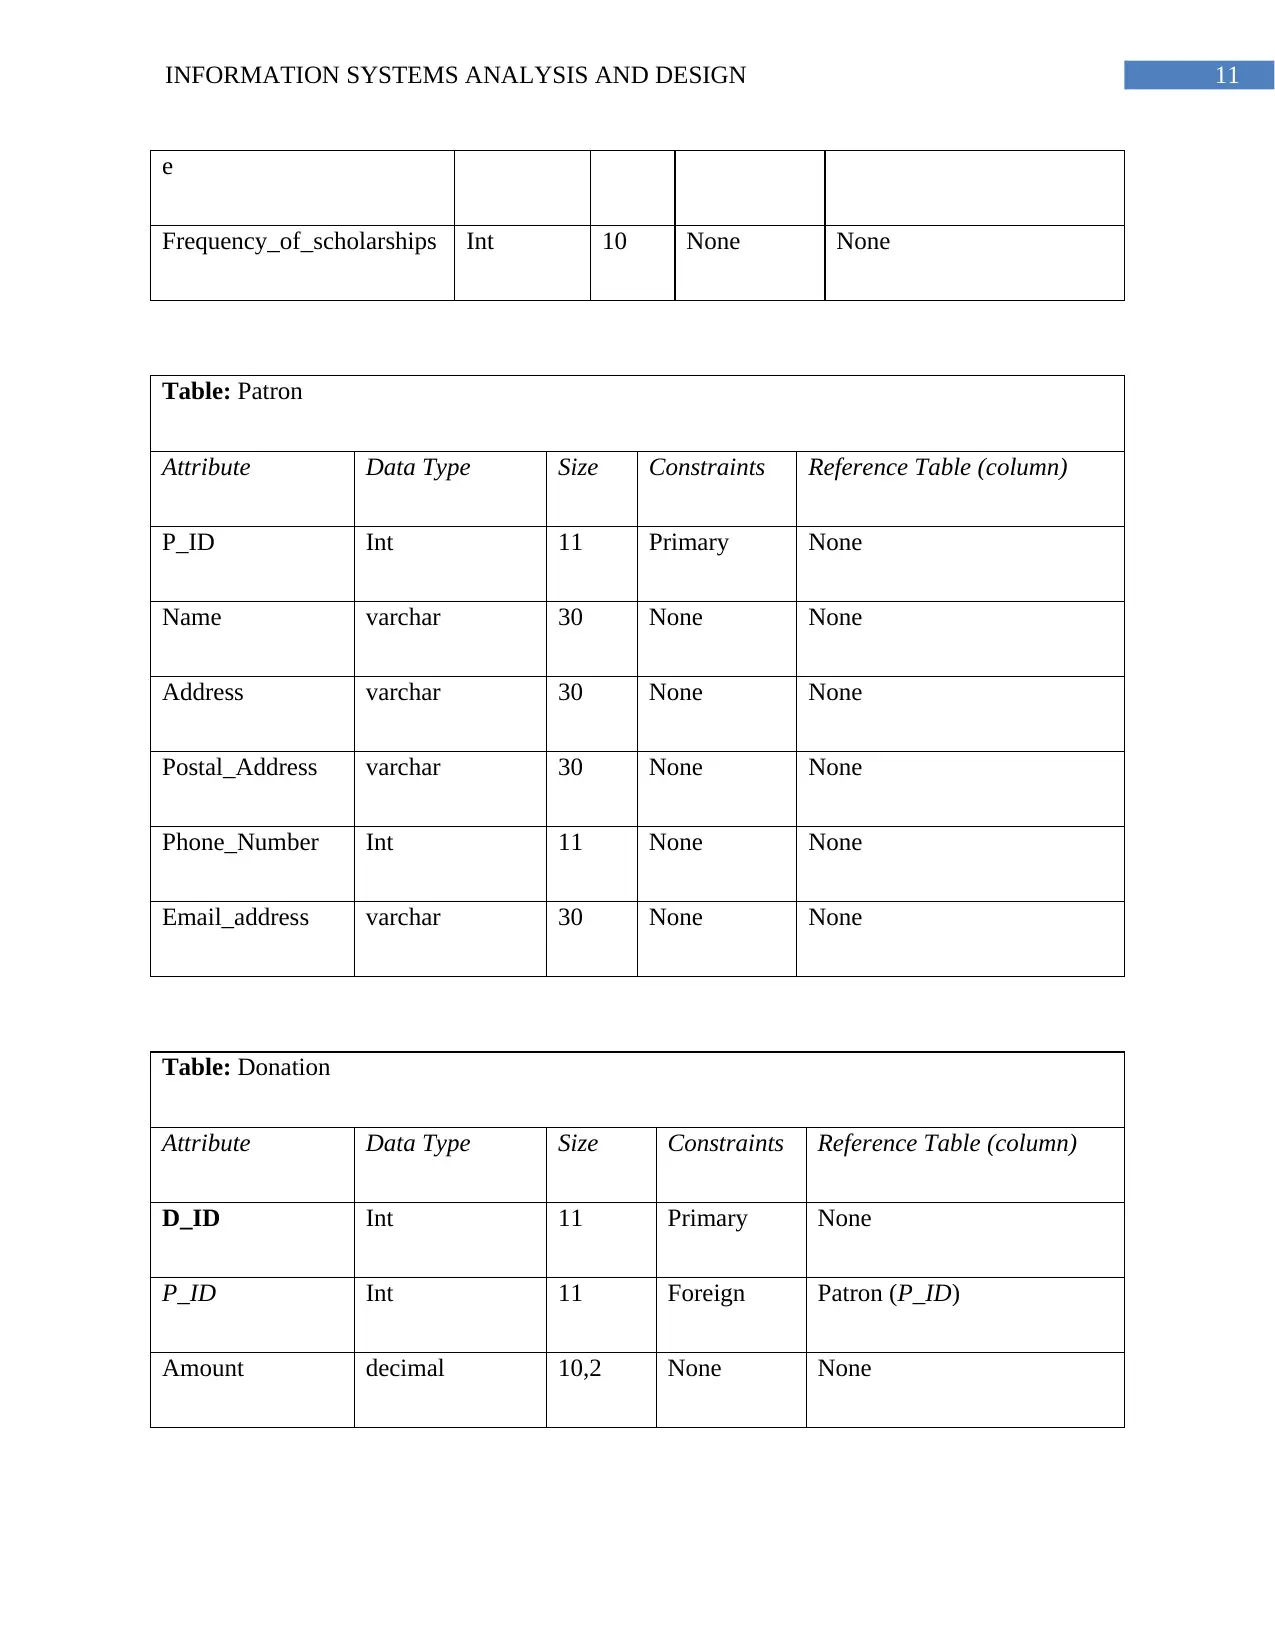
This report details the information systems analysis and design for the Brisbane Multi-Faith Temple. It begins with an introduction to the organization and its need for an improved system to manage food wastage and patron satisfaction. The report includes a use case diagram to illustrate interactions, followed by context and level-0 DFDs to depict data flow. An entity-relationship diagram (ERD) is presented to visualize database structure, alongside a CRUD diagram to show data-process relationships. Data elements are meticulously defined, and a website design and architecture section outlines objectives, aesthetics, key elements, and user interface designs including login, scholar, registration, payment gateway, accounts, home, contact us, and branches pages. The report concludes with a summary of findings and a bibliography.

Running head: INFORMATION SYSTEMS ANALYSIS AND DESIGN
Information Systems Analysis and Design
Name of the System
Name of the University
Information Systems Analysis and Design
Name of the System
Name of the University
Paraphrase This Document
Need a fresh take? Get an instant paraphrase of this document with our AI Paraphraser

1INFORMATION SYSTEMS ANALYSIS AND DESIGN
Table of Contents
1. Introduction:................................................................................................................................2
1.1 Brisbane Multi-Faith Temple Description:............................................................................2
1.2 Objective and Methodology:.................................................................................................2
1.3 Report Outline:......................................................................................................................3
2. Critical Use Case Diagram:.....................................................................................................4
3. Context Diagram:.........................................................................................................................6
4. level-0 DFD:................................................................................................................................8
5. Entity Relationship Diagram:......................................................................................................9
6. CRUD Diagram:........................................................................................................................10
7. Data Elements:...........................................................................................................................10
8. Website Design and Architecture:.............................................................................................16
8.1 Objectives:...........................................................................................................................16
8.2 Aesthetic: Visual Design:....................................................................................................17
8.3 The Key Elements:..............................................................................................................17
8.4 User Interface:.....................................................................................................................17
9. Conclusion:................................................................................................................................23
Bibliography:.................................................................................................................................25

2INFORMATION SYSTEMS ANALYSIS AND DESIGN
1. Introduction:
The information system is the part of the ICT technology that is responsible for maintain
the information in the system. The system is connected to a database that holds the business
related data. Brisbane Multi-Faith Temple is looking to develop the system so that it can manage
its food wastage and provide satisfaction to the patrons.
1.1 Brisbane Multi-Faith Temple Description:
The Brisbane Multi-Faith Temple is a charitable organization and have five temples at
present. The organization was first establish at Mount Cotton by Sam and other volunteers. Now
the organization has got so much popularity that forty two general staff working at the temple.
The organization now provide free food to approximately two thousand and five hundred people
each day. The patrons have to donate money to the temple either through e-payment through
bank transfer to the temple account or depositing fund at bank manually. In both cases, the
patrons have to collect the account details of the organization through the website. After the
donation is receive, the accountant send a receipt/invoice to the patron through e-mail or
Australia Post.
The accountant order the foods each week and the supplier send the ordered foods to the
temple. There is no process in the organization to forecast the amount of patrons present in one
temple. This causes issue while the food runs out in one location.
1.2 Objective and Methodology:
The report is developed with the objective of providing good amount of details regarding
the system design. The report provides a general idea regarding the GUI of the Brisbane Multi-
Faith Temple website. The planning and analysis of the Brisbane Multi-Faith Temple system has
⊘ This is a preview!⊘
Do you want full access?
Subscribe today to unlock all pages.

Trusted by 1+ million students worldwide

3INFORMATION SYSTEMS ANALYSIS AND DESIGN
already been done it the previous assignment. The OO design methodology has been used for
developing the design. The Crow’s Foot database notation has been used for developing the ERD
or entity relationship diagram. The web GUI has been developed using the normal web prototype
methodology.
1.3 Report Outline:
The report has first provided details of the interactions between the end-users and system.
This interaction has been shown using the use case diagram. The brief details of the use cases has
been provided. Then the context level diagram and Level-0 DFD has been designed to provide
details of the data that flows within the system. After that based on the current findings, the ERD
has been developed so that, the database related data can be shown. The CRUD diagram shows
the related between the data and processes. The Website GUI provides an understanding of how
the patrons will be using the system though an interface.
Paraphrase This Document
Need a fresh take? Get an instant paraphrase of this document with our AI Paraphraser

4INFORMATION SYSTEMS ANALYSIS AND DESIGN
2. Critical Use Case Diagram:
Figure 1: Use Case Diagram
(Source: Created by Author)
Register: The patrons will register into the system. The details like name, address, and
other details will be provided to the system.
2. Critical Use Case Diagram:
Figure 1: Use Case Diagram
(Source: Created by Author)
Register: The patrons will register into the system. The details like name, address, and
other details will be provided to the system.

5INFORMATION SYSTEMS ANALYSIS AND DESIGN
Donate: The patrons will be donating money to the organization. The patrons will be
donating money to the temple through the payment gateway in their website.
Invoices: The invoices will take some to generate. The Invoices will be generated after
the payment is received.
End of Year Statement: After the end of the financial year, the patron will receive an end
of the year statement.
Order Food: The accountant will order food to various suppliers. The suppliers will
receive order through e-mail.
Forecast Report: The accountant will see the forecast report which will hold the
information of how many people will visit the temples in the next month.
Report: The management executives like chairman and vice chairman will access reports
on business processes. These reports will be generated by the system automatically based on the
stored data and information.
⊘ This is a preview!⊘
Do you want full access?
Subscribe today to unlock all pages.

Trusted by 1+ million students worldwide

6INFORMATION SYSTEMS ANALYSIS AND DESIGN
3. Context Diagram:
Figure 2: Context Diagram
(Source: Created by Author)
3. Context Diagram:
Figure 2: Context Diagram
(Source: Created by Author)
Paraphrase This Document
Need a fresh take? Get an instant paraphrase of this document with our AI Paraphraser

7INFORMATION SYSTEMS ANALYSIS AND DESIGN
The context diagram has been represented to show the basic level data among the
external entities and the system. This diagram only shows the data flow between the system and
external entity in the lowest level. It can be assumed to be the blueprint of the data designing of
the system.
The context diagram has three main external entities such as patron, supplier and
accountant. The external entities will be inputting or requesting data form the system. The arrows
in the context diagram shows in which way the data flows. The patron will be providing all the
required details to register. The payment amount and account number will be provided to the
system through the make payment information. The patron will receive the invoice. The
accountant will provide the system the order related data and these data passed to the supplier.

8INFORMATION SYSTEMS ANALYSIS AND DESIGN
4. level-0 DFD:
Figure 3: Level-0 Data Flow Diagram
(Source: Created by Author)
The level-0 DFD is consisted of six processes. These processes are the main processes of
the system. The arrows has been shown to make understood of which way data is flowing. The
data is either saved in data store or retrieved from. Each of the process will be triggered by the
user.
⊘ This is a preview!⊘
Do you want full access?
Subscribe today to unlock all pages.

Trusted by 1+ million students worldwide

9INFORMATION SYSTEMS ANALYSIS AND DESIGN
5. Entity Relationship Diagram:
Figure 4: Entity Relationship Diagram
(Source: Created by Author)
5. Entity Relationship Diagram:
Figure 4: Entity Relationship Diagram
(Source: Created by Author)
Paraphrase This Document
Need a fresh take? Get an instant paraphrase of this document with our AI Paraphraser

10INFORMATION SYSTEMS ANALYSIS AND DESIGN
6. CRUD Diagram:
Figure 5: CRUD Diagram
(Source: Created by Author)
7. Data Elements:
Table: Scholarships
Attribute Data Type Size Constraints Reference Table (column)
SC_ID Int 11 Primary None
Name varchar 30 None None
Duration Int 10 None None
Amount decimal 10,2 None None
Criteria varchar 30 None None
Number_of_people_eligibl Int 10 None None

11INFORMATION SYSTEMS ANALYSIS AND DESIGN
e
Frequency_of_scholarships Int 10 None None
Table: Patron
Attribute Data Type Size Constraints Reference Table (column)
P_ID Int 11 Primary None
Name varchar 30 None None
Address varchar 30 None None
Postal_Address varchar 30 None None
Phone_Number Int 11 None None
Email_address varchar 30 None None
Table: Donation
Attribute Data Type Size Constraints Reference Table (column)
D_ID Int 11 Primary None
P_ID Int 11 Foreign Patron (P_ID)
Amount decimal 10,2 None None
⊘ This is a preview!⊘
Do you want full access?
Subscribe today to unlock all pages.

Trusted by 1+ million students worldwide
1 out of 25
Related Documents

Your All-in-One AI-Powered Toolkit for Academic Success.
 +13062052269
info@desklib.com
Available 24*7 on WhatsApp / Email
Unlock your academic potential
Copyright © 2020–2025 A2Z Services. All Rights Reserved. Developed and managed by ZUCOL.