Infosys Financial Analysis: Decision Making, Ratios, Theories, Risk
VerifiedAdded on 2023/06/08
|29
|5154
|315
Report
AI Summary
This report provides a comprehensive financial analysis of Infosys, an Indian multinational information technology company. It assesses the company's financing strategies, working capital management, profitability, risk management, and dividend policy. The analysis includes a discussion of risk characteristics associated with loans, market debt, convertible debts, and shares. It critically evaluates the pecking order and static trade-off theories, computes gearing ratios, and examines working capital management theories, including hedging, conservative, and aggressive approaches. The report also explains dividend irrelevance, clientele, bird-in-hand, and signaling theories, applying them to Infosys' dividend policy. Furthermore, it calculates and evaluates profitability ratios like earnings per share, assesses return in relation to risk using the Capital Asset Pricing Model, and examines the external economic environment using PEST analysis. The analysis relies on financial ratios derived from Infosys' financial statements to provide insights into the company's financial health and strategic decision-making. Desklib offers more solved assignments for students.

Financial Decision
Making
Making
Paraphrase This Document
Need a fresh take? Get an instant paraphrase of this document with our AI Paraphraser
Contents
INTRODUCTION...........................................................................................................................3
TASK...............................................................................................................................................3
Section 1.................................................................................................................................3
Discuss of the risk characteristics of followings:...................................................................3
Critically evaluation and synthesis of pecking order and static trade off theories.................4
Computation of gearing ratio..................................................................................................4
Section 2.................................................................................................................................5
Working Capital Management theories..................................................................................5
Calculation and Evaluation of ratios......................................................................................6
Section 3.................................................................................................................................6
Explanations of different theories-.........................................................................................6
Application of the chosen company to the theories................................................................7
Section 4.................................................................................................................................7
Evaluation of return in relation to risk through discussion and application of Capital Asset
Pricing Model:........................................................................................................................9
Explain the external economic environment of the organization either using PEST analysis or
an analysis of its particular business model.........................................................................10
CONCLUSION..............................................................................................................................11
REFERENCES..............................................................................................................................12
APPENDIX....................................................................................................................................13
INTRODUCTION
The report prepared as under takes in account assessment of company Infosys which is an
Indian multinational information technology organization which would provide information
technology, business consulting and outsourcing of services as well. The report helps to render
ideas such as in what ways the company would be able to finance, how will the business manage
working capital, profitability and risk and dividend policy as well. Ratios are being computed for
understanding and predicting the financial position and working of business in a competitive
environment and in what ways its deviations could be managed. The balance sheet prepared as
under would help in having a transparent view of assets being acquired and liabilities which are
to be paid and covered as well in stated time duration.
TASK
Section 1
Discuss of the risk characteristics of followings:
Loan: There is a high risk related to the credit where borrower is denied or not able to
return the loan amount. Credit risk refers to a lender may not receive their principle amount and
the interest incurred on the same amount.
Market debt: Market environment contain various risks which are related to the creditors
and debtors related to any firm. Interest rate risk is a major risk which is related to the value of
the bond that fall in secondary market due to high competition from the fresh bonds which are
more attractive (Asmara and et.al, 2018).
Convertible Debts: These are the bonds which are considered to be riskier than any fix
income investment. There is a high risk related to deadline, time period, interest and so on. They
are not offered by all companies. They are highly related to the equity market so if market is
suffering from huge declines then it influences the convertible debts or bonds.
Share: There is low level of uncertainty with low return and high risk may generate high
returns. Any other market uncertainty of any other company or government related problems or
scams can influence the whole market which decrease the prices of shares and also increase the
risk.
⊘ This is a preview!⊘
Do you want full access?
Subscribe today to unlock all pages.
Trusted by 1+ million students worldwide
Critically evaluation and synthesis of pecking order and static trade off theories
Pecking order theories: This assumption is based on obtaining savvy funding. This
assumption recommends that CEOs use bonds because they are less risky in terms of the cost of
stocks. This assumption discusses changes in the proportion of obligation value, rather than an
objective change model that relies on static compromise assumptions. The dominance hierarchy
hypothesis can be dismissed if flows with objective variation are supported.
Static trade off theory: This assumption revolves primarily around Chapter 11 and the
liability for assessing the benefit of supporting the obligation. The centre of the hierarchy
assumption is to support internal assets and, if all else fails, involve external assets. This
assumption controls the money circle of the firm by accepting a capital-independent design. The
food chain can be applied effortlessly to small associations, given that more modest companies
are designed with their needs in mind rather than their capital.
Sources of finance available in the market
1. Public Deposits: A store where a commercial company emerges directly from the
masses is called an open store. Most of the loan fees offered by public stores are higher than
other bank stores. This source of money considers any individual after filling a specific structure.
The company offers receipt store receipts as a compromise of the acknowledgment obligation. It
is useful for businesses with moderate and instantaneous monetary needs. This act of funding
sources is beneficial to both the financial backer and the organization.
2. Issue of shares: Funds obtained by issuing an offer are called offer capital. These
capitals are largely segregated into small tranches called stocks, and each offer has its ostensible
value. The guardian or holder of the offer is called a business investor. The organization
generally provides both a value offers and an offer for shares of interest, while value investors
assist the organization in raising long-term funding and share of interest, which helps in taking
proper profit measures and obtaining capital after the acquisition has been completed to lenders.
Organization case (Blouin and et.al, 2018).
Computation of gearing ratio
Debt Equity ratio: Debt / Equity
In year 2015 = 126 / 572
In year 2016 = 50 / 1144
Paraphrase This Document
Need a fresh take? Get an instant paraphrase of this document with our AI Paraphraser
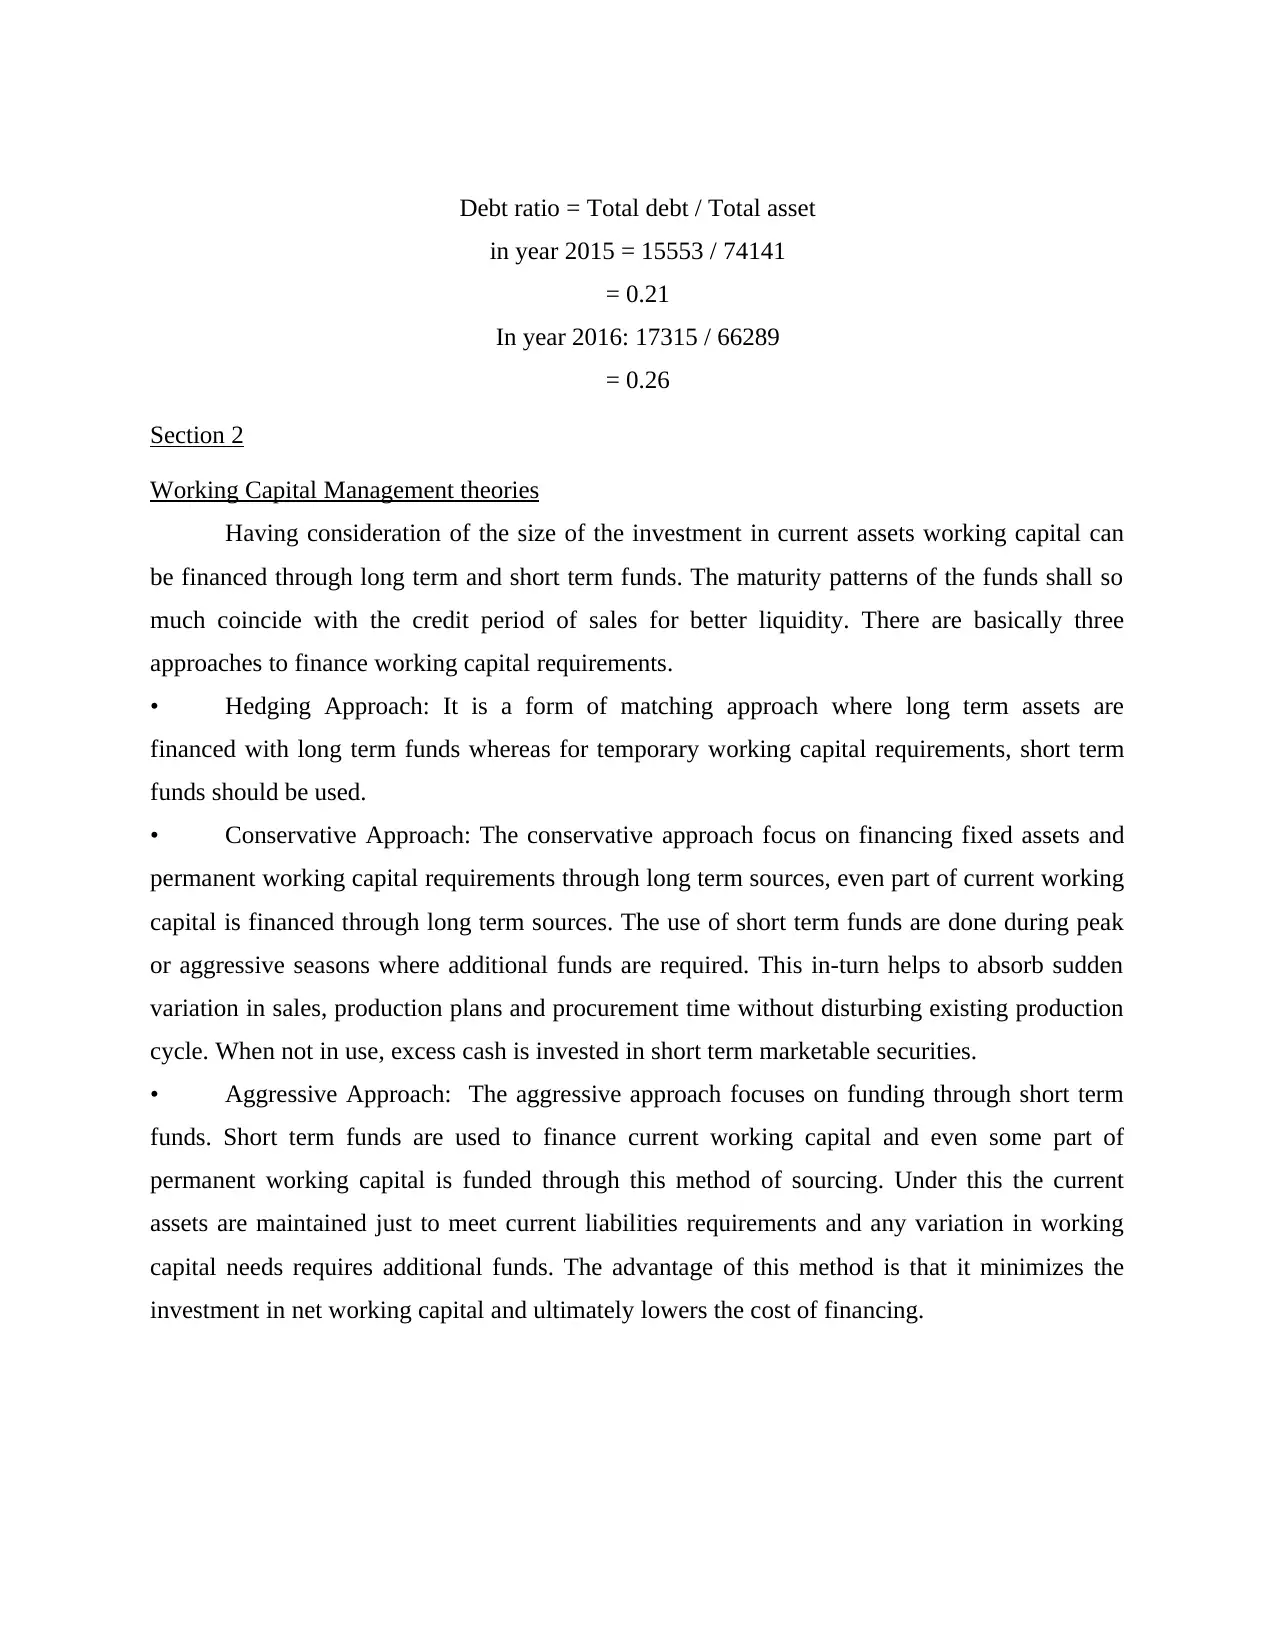
Debt ratio = Total debt / Total asset
in year 2015 = 15553 / 74141
= 0.21
In year 2016: 17315 / 66289
= 0.26
Section 2
Working Capital Management theories
Having consideration of the size of the investment in current assets working capital can
be financed through long term and short term funds. The maturity patterns of the funds shall so
much coincide with the credit period of sales for better liquidity. There are basically three
approaches to finance working capital requirements.
• Hedging Approach: It is a form of matching approach where long term assets are
financed with long term funds whereas for temporary working capital requirements, short term
funds should be used.
• Conservative Approach: The conservative approach focus on financing fixed assets and
permanent working capital requirements through long term sources, even part of current working
capital is financed through long term sources. The use of short term funds are done during peak
or aggressive seasons where additional funds are required. This in-turn helps to absorb sudden
variation in sales, production plans and procurement time without disturbing existing production
cycle. When not in use, excess cash is invested in short term marketable securities.
• Aggressive Approach: The aggressive approach focuses on funding through short term
funds. Short term funds are used to finance current working capital and even some part of
permanent working capital is funded through this method of sourcing. Under this the current
assets are maintained just to meet current liabilities requirements and any variation in working
capital needs requires additional funds. The advantage of this method is that it minimizes the
investment in net working capital and ultimately lowers the cost of financing.
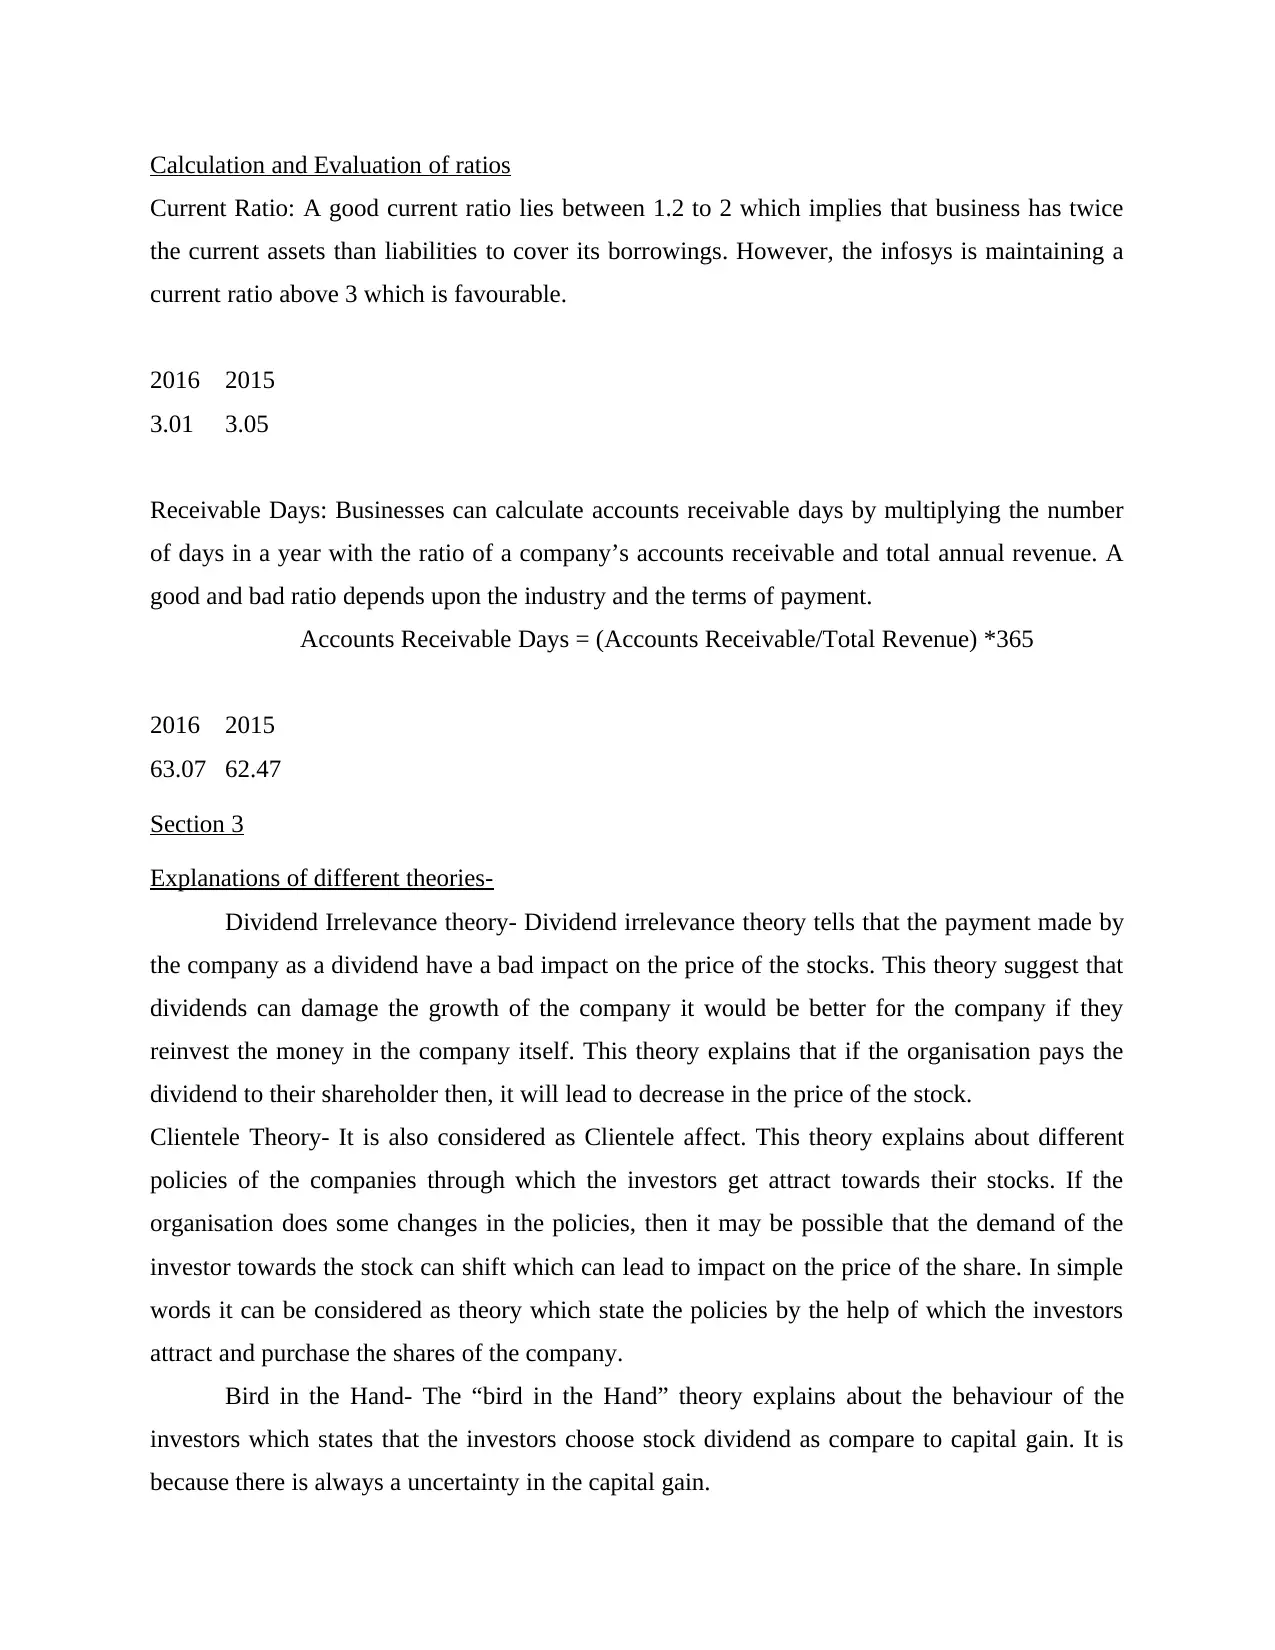
Calculation and Evaluation of ratios
Current Ratio: A good current ratio lies between 1.2 to 2 which implies that business has twice
the current assets than liabilities to cover its borrowings. However, the infosys is maintaining a
current ratio above 3 which is favourable.
2016 2015
3.01 3.05
Receivable Days: Businesses can calculate accounts receivable days by multiplying the number
of days in a year with the ratio of a company’s accounts receivable and total annual revenue. A
good and bad ratio depends upon the industry and the terms of payment.
Accounts Receivable Days = (Accounts Receivable/Total Revenue) *365
2016 2015
63.07 62.47
Section 3
Explanations of different theories-
Dividend Irrelevance theory- Dividend irrelevance theory tells that the payment made by
the company as a dividend have a bad impact on the price of the stocks. This theory suggest that
dividends can damage the growth of the company it would be better for the company if they
reinvest the money in the company itself. This theory explains that if the organisation pays the
dividend to their shareholder then, it will lead to decrease in the price of the stock.
Clientele Theory- It is also considered as Clientele affect. This theory explains about different
policies of the companies through which the investors get attract towards their stocks. If the
organisation does some changes in the policies, then it may be possible that the demand of the
investor towards the stock can shift which can lead to impact on the price of the share. In simple
words it can be considered as theory which state the policies by the help of which the investors
attract and purchase the shares of the company.
Bird in the Hand- The “bird in the Hand” theory explains about the behaviour of the
investors which states that the investors choose stock dividend as compare to capital gain. It is
because there is always a uncertainty in the capital gain.
⊘ This is a preview!⊘
Do you want full access?
Subscribe today to unlock all pages.
Trusted by 1+ million students worldwide
Signalling theories- This theory believes that the outside investors have no complete
information about the financials of the organisation. This theory explains that organisation
financials decisions like increasing in dividend is a kind of indication by the company of their
future growth.
Application of the chosen company to the theories
As described above dividend irrelevance theory presents the viewpoint that stock prices
of the company will get influenced if the company pay dividend regularly to its shareholders.
This theory holds that dividend pay-out by the company does not add any value to the company's
share prices even the prices decrease after such payoff. But Infosys does not consider this theory
and still believes in paying regular dividend twice in a financial year. Company pays
systematically dividends to its shareholders to ensure them that company's earning capabilities
are strong and vital and company can survive even in rigorous competitive environment
(Cordero and et.al, 2022). While dividend irrelevance theory talks about dividend, clientele
theory describes the effect on share price by changes in business policies followed by the
company. This policy presents the view point that different policies attracts the different
investors of the company and with the changes in these policies there can be a significant change
in the clientele of the company. Infosys believes to hold their clientele by following the business
policies for long term as well as have a smooth orientation towards change which are indeed for
the company.
While dividend irrelevance theory holds the investors indifferent in point of their returns,
bird in hand theory states that investors prefer high dividend paying off shares to gain high
capital gain which causes for rise in the company's share prices. This theory perfectly fit for the
chosen company as it is a dividend paying stocks and this will create a plus point for the
company to attracts more investors. Dividend signalling theory has been contested on a greater
level by many investors but few of them still follow this theory.
Section 4
Calculation and evaluation of Suitable profitability ratios:
Profitability shows the earning capacity of the organisation and these could be reflected on
the basis of Financial ratios. These ratios explain the deviation in financial facts which are being
arrived by comparing the financials of the company for more than one year. These are various
formulas to derive the profit earning capacity of the entity such as gross profit ratio, net profit
Paraphrase This Document
Need a fresh take? Get an instant paraphrase of this document with our AI Paraphraser
ratio, return on investment, return on net worth, earning per share, book value per share and so
on. After calculation of the above formulae the assessment will become easier for the same. The
calculation for the profitability ratio are being mentioned below:
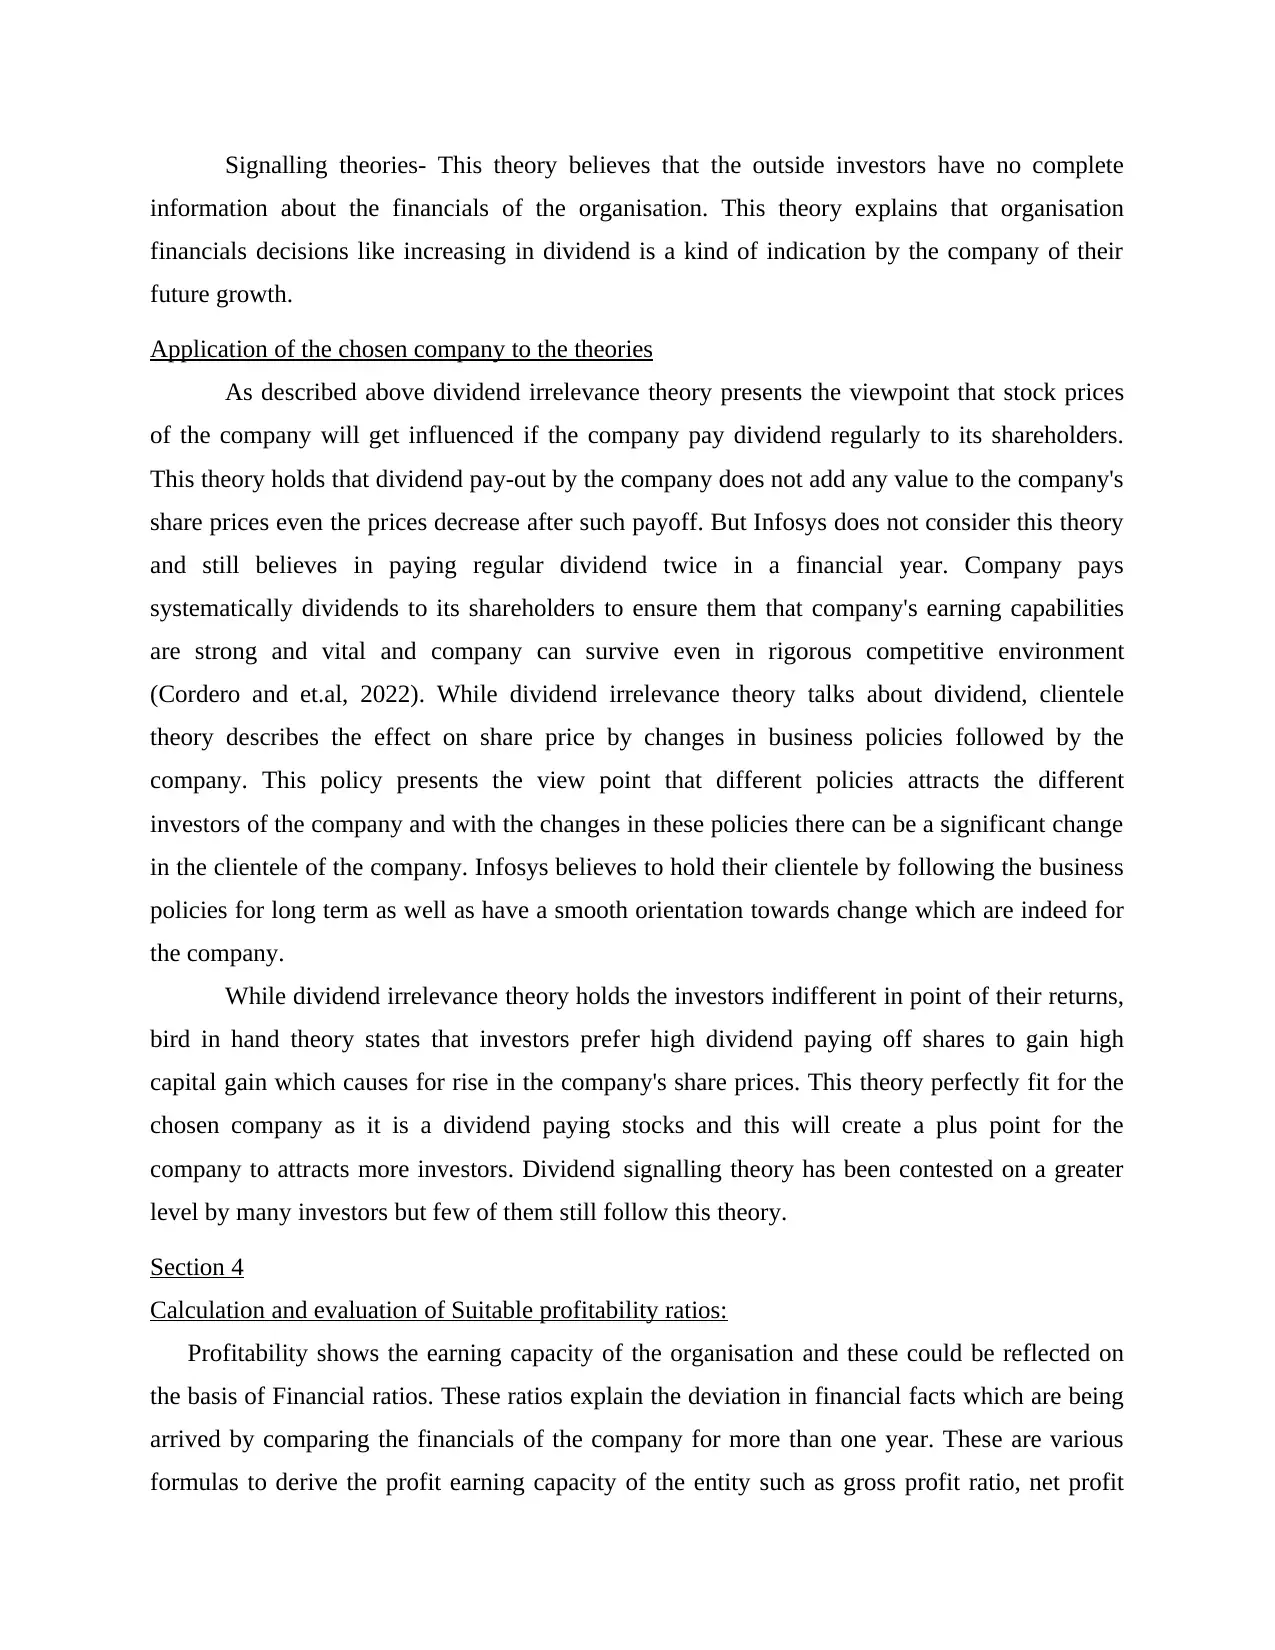
Earnings per share:
It reflects the earning that has been earned by the shareholders against the shares they
have purchased from the company. The formula for calculating the same has been listed
below:
Earnings Available to Equity share holder / Weighted Average Shares
With respect to Infosys the figures are being mentioned below:
Mar ' 09 Mar ' 08 Mar ' 07 Mar ' 06 Mar ' 05
108.08 78.06 65.42 90.65 68.38
Interpretation: The above figures shows that the earing of company has a consistent
improvement especially during the year 2009 that gives the interpretation that funds that
are being invested by the shareholders are collectively utilised towards the goals that are
being set out by the business.
Money income per share:
This formula indicates the flow of income within the organisation throughout the
accounting period. It is important measure for determining the growth of company as
negative cash flows are indicators of negative liquidity for the organisation. The formula
for calculating the same is being mentioned below:
(Networking money flow-movement devaluation of immovable resources amortization of
immaterial resources amortization delayed charges-interest expenditure and price of
floating assets in money + asset revenue in money)
/ Total Equity)
For Infosys, the alteration of the CEP fraction for 5 years is:
Mar- Mar- Mar- Mar- Mar-
on. After calculation of the above formulae the assessment will become easier for the same. The
calculation for the profitability ratio are being mentioned below:
Earnings per share:
It reflects the earning that has been earned by the shareholders against the shares they
have purchased from the company. The formula for calculating the same has been listed
below:
Earnings Available to Equity share holder / Weighted Average Shares
With respect to Infosys the figures are being mentioned below:
Mar ' 09 Mar ' 08 Mar ' 07 Mar ' 06 Mar ' 05
108.08 78.06 65.42 90.65 68.38
Interpretation: The above figures shows that the earing of company has a consistent
improvement especially during the year 2009 that gives the interpretation that funds that
are being invested by the shareholders are collectively utilised towards the goals that are
being set out by the business.
Money income per share:
This formula indicates the flow of income within the organisation throughout the
accounting period. It is important measure for determining the growth of company as
negative cash flows are indicators of negative liquidity for the organisation. The formula
for calculating the same is being mentioned below:
(Networking money flow-movement devaluation of immovable resources amortization of
immaterial resources amortization delayed charges-interest expenditure and price of
floating assets in money + asset revenue in money)
/ Total Equity)
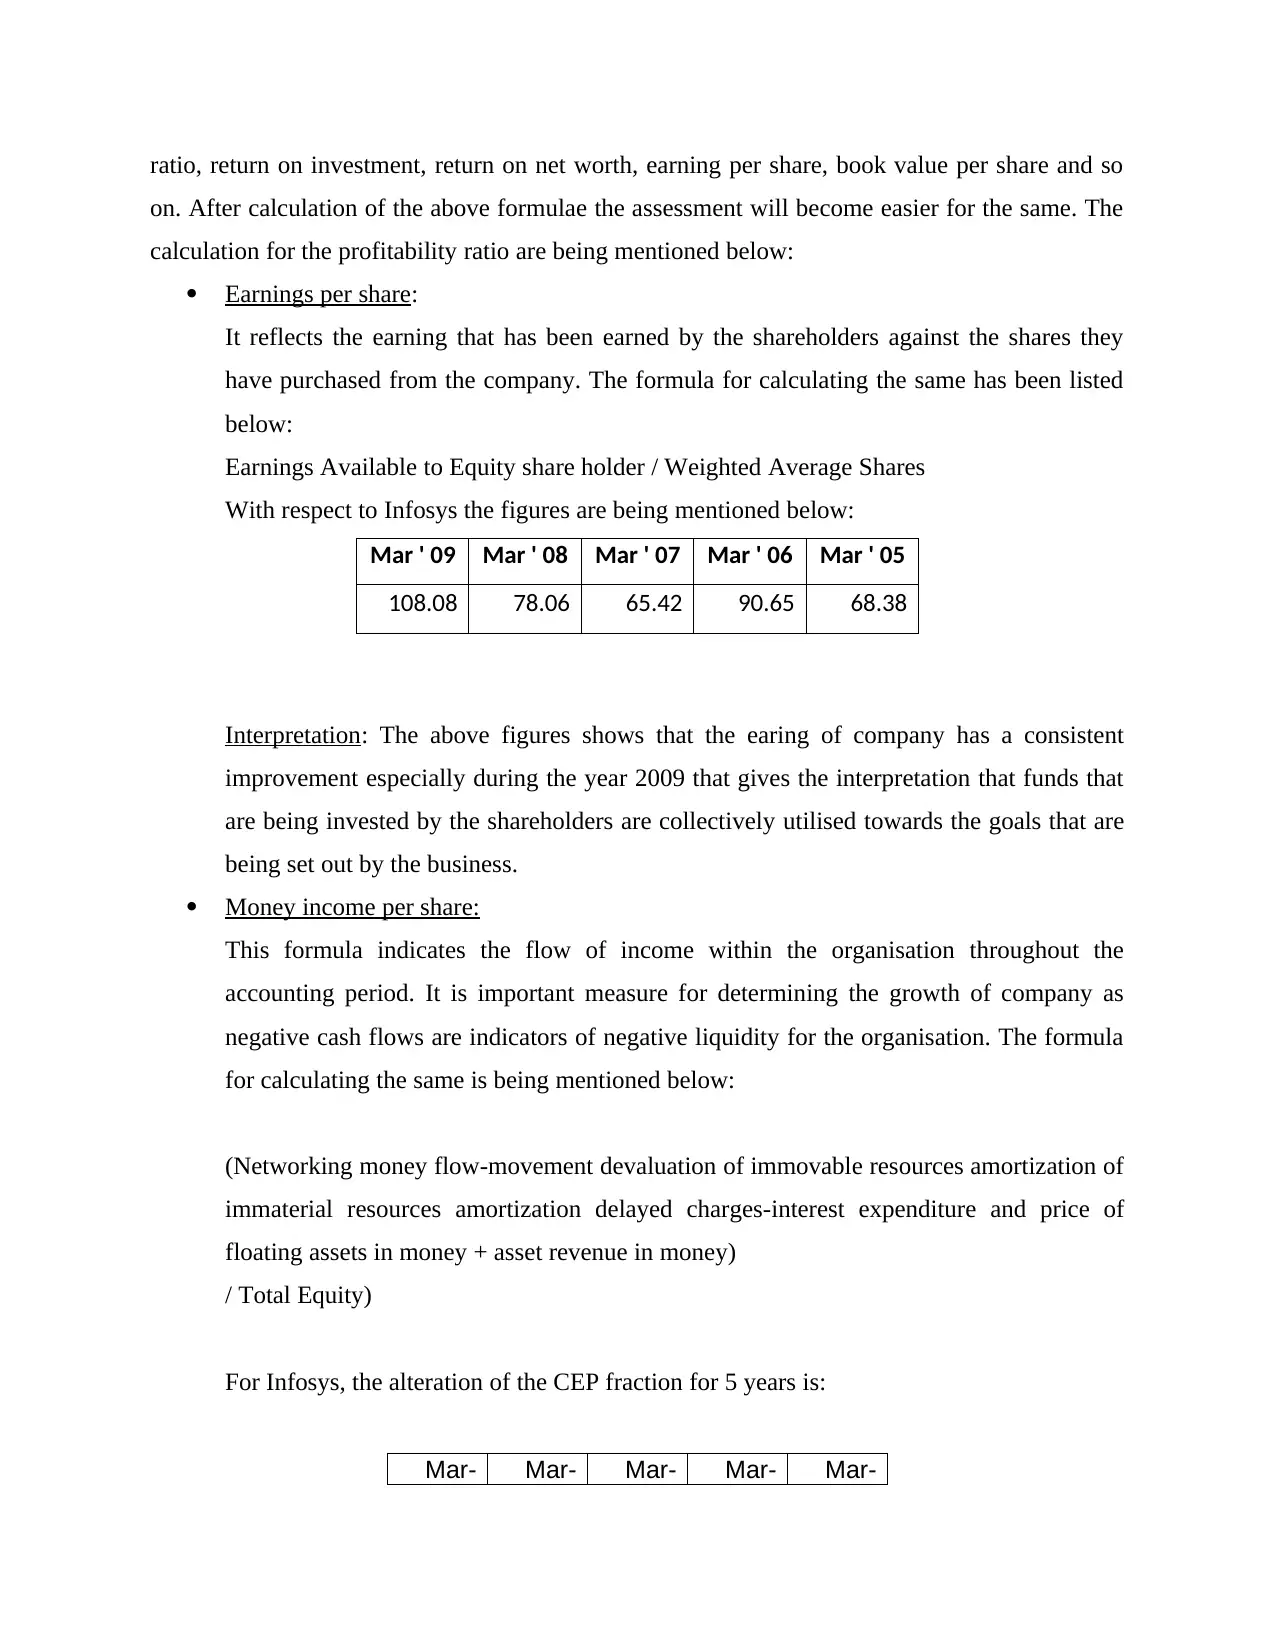
For Infosys, the alteration of the CEP fraction for 5 years is:
Mar- Mar- Mar- Mar- Mar-
09 08 07 06 05
113.86 87.69 74.34 102.54 80.44
Interpretation: This directly interpret that the performance of business gets improved over
5-year period that clearly indicates growth in business processes in the near future.
Bonus per share:
This clearly indicates the bonus that has been paid by the company to its shareholder
during the accounting period. This formula reflects the benefits that has been earned by
the shareholders in addition to their investment and also shows the overall profit raising
standard for the corporate (Davidson, R., 2020).
The formula for calculating the same are being mentioned under:
(Bonus Paid to shareholder / Number of Shares Outstanding)
Mar-09 Mar-08 Mar-07 Mar-06 Mar-05
24.15 44.35 17.66 49.89 16.2
Interpretation: The above figures shows that the company has fluctuation in terms of
distribution of profits to their stakeholders which requires special attention by the
management as this approach not be helpful for them to retain them for the longer period
of time.
Evaluation of return in relation to risk through discussion and application of Capital Asset
Pricing Model:
CAPM stands for Capital asset pricing model that helps to assess the risk in order for
every asset. It is useful for calculation of cost of equity. It is calculated by considering Beta,
market risk for each security von and risk free rate of return.
The formula applicable for Capital asset pricing model for computing Beta is:
= Rf + B (Rm – Rf)
⊘ This is a preview!⊘
Do you want full access?
Subscribe today to unlock all pages.
Trusted by 1+ million students worldwide
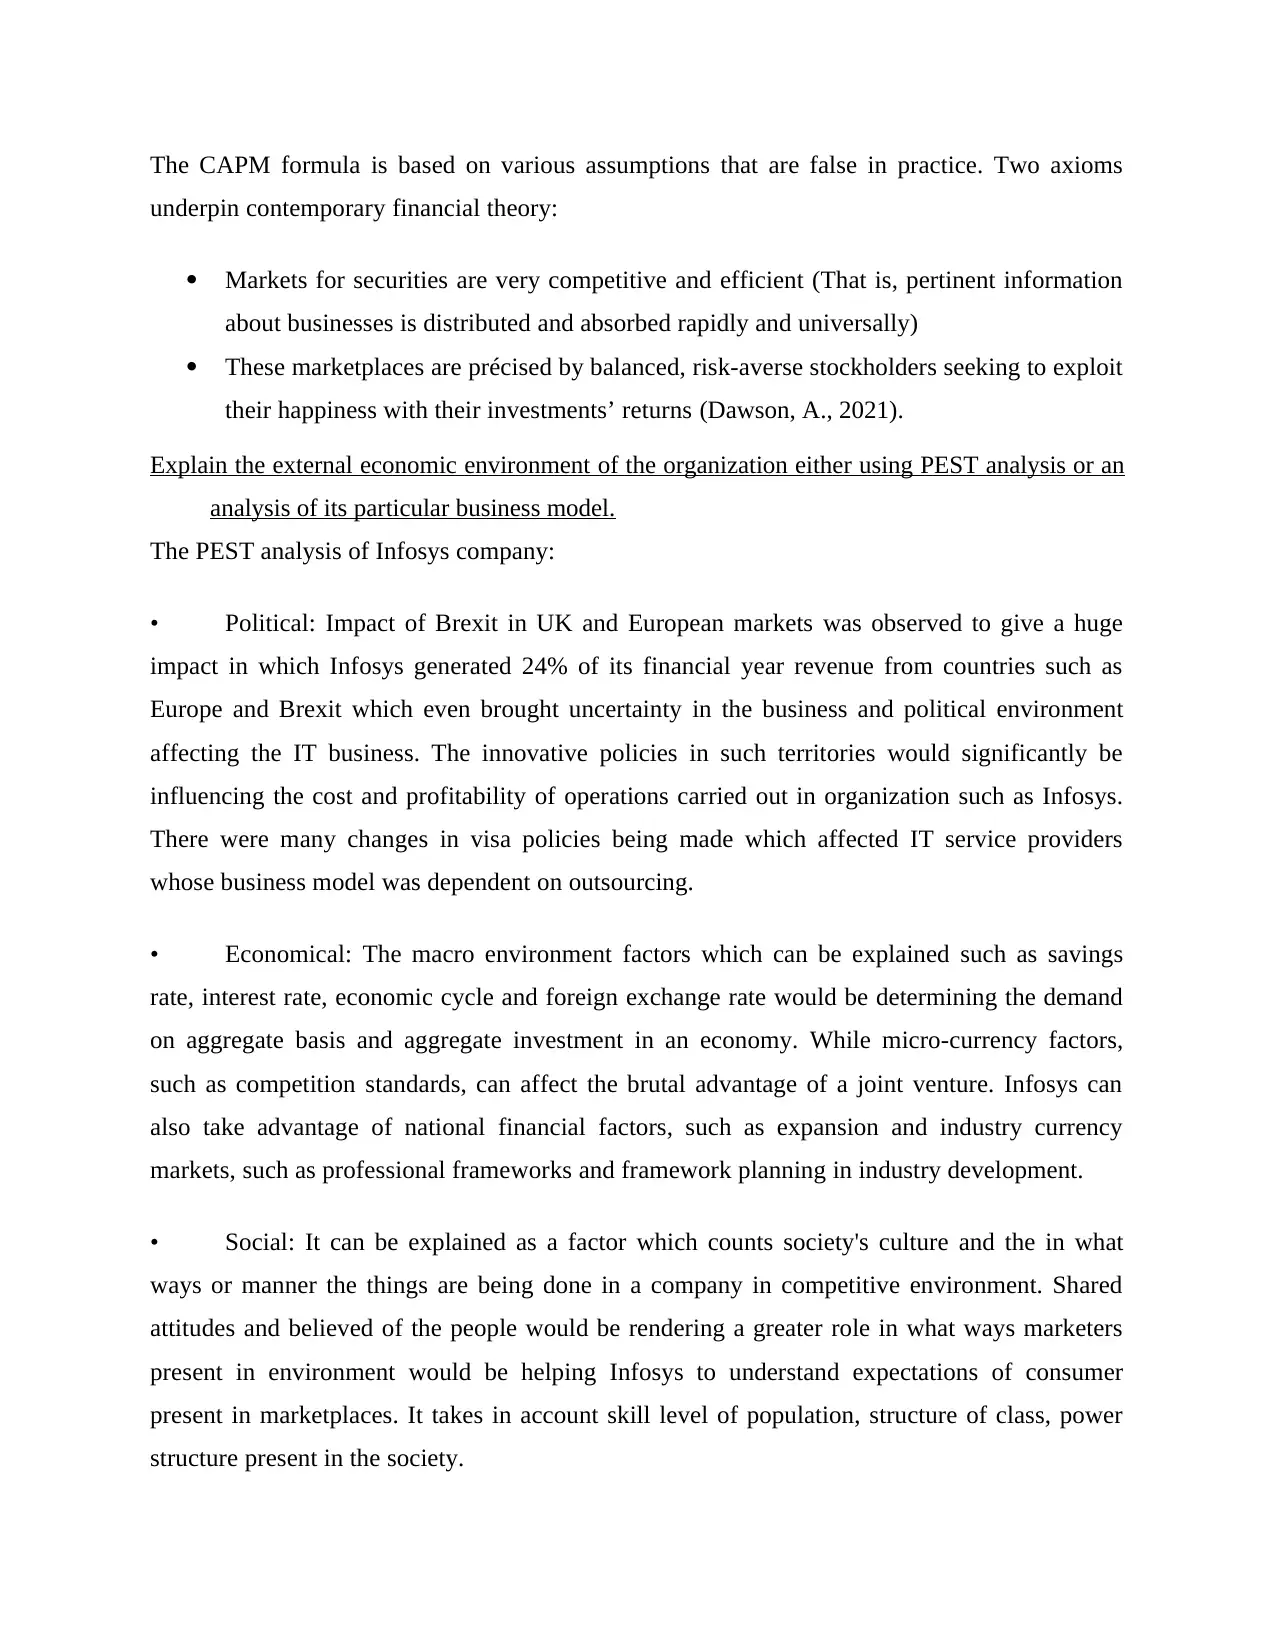
The CAPM formula is based on various assumptions that are false in practice. Two axioms
underpin contemporary financial theory:
Markets for securities are very competitive and efficient (That is, pertinent information
about businesses is distributed and absorbed rapidly and universally)
These marketplaces are précised by balanced, risk-averse stockholders seeking to exploit
their happiness with their investments’ returns (Dawson, A., 2021).
Explain the external economic environment of the organization either using PEST analysis or an
analysis of its particular business model.
The PEST analysis of Infosys company:
• Political: Impact of Brexit in UK and European markets was observed to give a huge
impact in which Infosys generated 24% of its financial year revenue from countries such as
Europe and Brexit which even brought uncertainty in the business and political environment
affecting the IT business. The innovative policies in such territories would significantly be
influencing the cost and profitability of operations carried out in organization such as Infosys.
There were many changes in visa policies being made which affected IT service providers
whose business model was dependent on outsourcing.
• Economical: The macro environment factors which can be explained such as savings
rate, interest rate, economic cycle and foreign exchange rate would be determining the demand
on aggregate basis and aggregate investment in an economy. While micro-currency factors,
such as competition standards, can affect the brutal advantage of a joint venture. Infosys can
also take advantage of national financial factors, such as expansion and industry currency
markets, such as professional frameworks and framework planning in industry development.
• Social: It can be explained as a factor which counts society's culture and the in what
ways or manner the things are being done in a company in competitive environment. Shared
attitudes and believed of the people would be rendering a greater role in what ways marketers
present in environment would be helping Infosys to understand expectations of consumer
present in marketplaces. It takes in account skill level of population, structure of class, power
structure present in the society.
Paraphrase This Document
Need a fresh take? Get an instant paraphrase of this document with our AI Paraphraser
• Technological: Technology can be explained as a factor which is fast growing and
developing across the board in various industries. Transportation industry has also been
observed to set an effective example in such cases. Technology helps the company to keep its
work effective and efficient as well which would contribute in making the work error free and
minimize the cost and risk prevailing in the business environment as well.
CONCLUSION
The report prepared as above helps the company to understand the profitability and liquidity
state of business in an environment and also help it to predict what would be the progress of
organization in the economy. It would render an idea as where the company is lacking and
lagging behind. The report would also play a crucial and vital role in explaining the funds being
utilized and the money being invested by a business in certain areas. It also explains in what
ways the measures would help the company to manage effectiveness and efficiency in the firm.
The report reflects the sources which would help to manage finance from different areas and
methods proving to be helpful for the business in long run.
REFERENCES
Books and Journals
Asmara and et.al, 2018. The effect of audit tenure and firm size on financial reporting
delays. European Research Studies Journal. 21(Special 2). pp.414-422.
Blouin and et.al, 2018. The impact of online financial disclosure and donations in
nonprofits. Journal of Nonprofit & Public Sector Marketing. 30(3). pp.251-266.
Cordero and et.al, 2022. Financial education and student financial literacy: A cross-country
analysis using PISA 2012 data. The Social Science Journal. 59(1). pp.15-33.
Davidson, R., 2020. Cyber-physical production networks, artificial intelligence-based decision-
making algorithms, and big data-driven innovation in Industry 4.0-based manufacturing
systems. Economics, Management, and Financial Markets. 15(3). pp.16-22.
Dawson, A., 2021. Robotic wireless sensor networks, big data-driven decision-making processes,
and cyber-physical system-based real-time monitoring in sustainable product lifecycle
management. Economics, Management, and Financial Markets. 16(2). pp.95-105.
Fu, J., 2020. Ability or opportunity to act: What shapes financial well-being?. World
Development. 128. p.104843.
Hacioglu and et.al, 2021. Financial Ecosystem and Strategy in the Digital Era: Global
Approaches and New Opportunities. Springer Nature.
Lienhoop, N., 2018. Acceptance of wind energy and the role of financial and procedural
participation: An investigation with focus groups and choice experiments. Energy
Policy, 118, pp.97-105.
Mirica, C.O., 2019. The behavioral economics of decision making: explaining consumer choice
in terms of neural events. Economics, Management, and Financial Markets. 14(1).
pp.16-22.
Mohtashami and et.al, 2020. Z-ERM DEA integrated approach for evaluation of banks &
financial institutes in stock exchange. Expert Systems with Applications. 147. p.113218.
Popescu and et.al, 2020. Real-time sensor networks, advanced robotics, and product decision-
making information systems in data-driven sustainable smart
manufacturing. Economics, Management and Financial Markets. 15(4). pp.29-38.
Salignac and et.al, 2020. Conceptualizing financial wellbeing: An ecological life-course
approach. Journal of Happiness Studies. 21(5). pp.1581-1602.
⊘ This is a preview!⊘
Do you want full access?
Subscribe today to unlock all pages.
Trusted by 1+ million students worldwide
1 out of 29
Related Documents


Your All-in-One AI-Powered Toolkit for Academic Success.
+13062052269
info@desklib.com
Available 24*7 on WhatsApp / Email
![[object Object]](/_next/static/media/star-bottom.7253800d.svg)
Unlock your academic potential
Copyright © 2020–2026 A2Z Services. All Rights Reserved. Developed and managed by ZUCOL.