INFS 2036 - Facebook Dashboard Project Proposal, UniSA (SP2 2019)
VerifiedAdded on 2023/04/17
|13
|2308
|58
Project
AI Summary
This project proposal outlines the development of a business intelligence dashboard for Facebook, addressing the CEO's need for improved transparency and performance monitoring. The proposal includes an overview of Facebook, defines key questions to be answered by the dashboard, identifies relevant data sources like Facebook Insights from the State Library of South Australia, and explores sample dashboards. It highlights key priorities such as page likes, post reach, and engagement, and discusses potential challenges and issues in dashboard implementation. The ultimate goal is to create a dashboard that facilitates effective decision-making and provides a visual representation of Facebook's overall performance, helping the organization transition from merely measuring performance to actively managing it. Desklib provides a platform for students to access similar solved assignments and study resources.
University of South Australia
Business Intelligence
INFS 2036
Study Period 2 2019
Part 1 Project Proposal
1
Business Intelligence
INFS 2036
Study Period 2 2019
Part 1 Project Proposal
1
Paraphrase This Document
Need a fresh take? Get an instant paraphrase of this document with our AI Paraphraser
Executive Summary
The main aims of this project is to prepare a project proposal for Facebook CEO. The
Project proposal is intends to develop a dashboard for the Facebook's company. This proposal
intends to follow the perspective of business intelligence system. The dashboard helps the
organizations to focus on their goals and ensures their business to run effectively. This
proposal includes the overview of the Facebook, prepares the questions to be answered by the
Dashboard, collects the data about the Facebook insights, searches the sample dashboards on
the websites and finally, identifies the potential challenges and issues for the Facebook
organization.
2
Table of Contents
1. Introduction...................................................................................................................................4
1.1 Background of Organization..................................................................................................4
1.2 Objectives..............................................................................................................................5
2. Overview of Selected Key Priority................................................................................................5
3. Questions to be answered by Dashboard.......................................................................................7
4. Data and Data Sources...................................................................................................................8
5. Sample Dashboard.........................................................................................................................9
6. Potential Challenges and Issues...................................................................................................11
7. Conclusion...................................................................................................................................11
References...........................................................................................................................................13
3
⊘ This is a preview!⊘
Do you want full access?
Subscribe today to unlock all pages.
Trusted by 1+ million students worldwide
1. Introduction
This project prepares a project proposal related to Facebook. The Project proposal is
focus on developing a dashboard for the Facebook. This project proposal is a real world
business analytics, because the development of dashboard is based on the perspectives of
Business intelligence. Thus, this proposal intends to follow the perspective of business
intelligence system. Basically, business intelligence is a massive industry and business
intelligence system implementation for the Facebook organization has spread across a broad
spectrum. The dashboards are often times the focal point of mechanisms that build up a data
source and produces visual composition to the end users. The dashboard helps the
organizations to focus on their goals and ensures their businesses to be effective enough. This
Proposal includes the following areas,
Overview of the Facebook.
Preparing the questions to be answered by the dashboard.
Collecting the data about the Facebook insights
Searching the sample dashboard on websites.
Identifying the potential challenges and issues for the Facebook organization.
1.1 Background of Organization
Social media is a powerful tool which is used to connect the business audience. Most
famous and effective social media is Facebook. The Facebook is a social network, as it uses
the terms like social utility. It is more useful and functional than just a connection tool. It
offers the users a variety of ways to publicly or privately share the data about their business
or personal life. It also provides the businesses to connect with the existing and potential
customers to create a business page which the user can like to show their appreciation for
posting questions or to learn about the business. Luckily, Facebook has a powerful and free
analytical tool like Facebook insights. Facebook insights are used to allow the user to easily
measure the performance of organization business page. The Facebook insights track the
page views, likes, reach and more. Facebook is used to provide the following features,
Building the brand awareness.
Getting followers to take an action.
Communicating with the customers.
4
Paraphrase This Document
Need a fresh take? Get an instant paraphrase of this document with our AI Paraphraser
Facebook will help the user to understand who you’re most engaged audience is and how
they are interacting with our organization page. The Facebook page insights are used to
provides the organization with loads of information about our audience. It will tell user for
instance which posts have the most engagement form your audience and what times your
audience is on Facebook.
This project is to create the project proposal for Facebook which is formalized user ideas
to the owner of the Facebook organization. So, we are first to understand the CEO
expectations and recognize that they need help in social media management but are unable to
describe why they need it or what their goals are for using social media. This proposed
section would include current sales metrics and an analysis of why the current strategy does
not work. The CEO of the Facebook Company faces two big problems; the first one is
transparency and information from management to the board. And, other problems to worry
about the social network are not growing as fast as expected.
Since the beginning of the year, Facebook has weathered as massive data privacy scandal
and the company has been vilified for allowing the fake news to remain in its news feed
feature. And, the organization investments in security would affect its performance.
The project proposal for Facebook is used to resolve the above-mentioned problems to
develop the dashboard which is used to display the overall performance for Facebook. And it
gives an effective decision to solve the problems. It also used to visualize the current strategy
performance of Facebook.
1.2 Objectives
The goal of this project is to prepare the project proposal for Facebook. The Project
proposal develops a dashboard. The preparation of the project proposal for Facebook which
includes the following,
• Organization overview
• Prepare the questions to be answered by Dashboard.
• Data collection based on organization.
• Search the sample dashboard on Websites.
• Identify the potential challenges and issues for Facebook organization.
5
2. Overview of Selected Key Priority
The key priority for Facebook as the world biggest social network readies its financial
update on the final months. It looking to rebound from the horrific year marked by a series of
scandals over the data privacy and protection and it concerns that it had been manipulated by
the foreign interest for political purposes. The key priority of Facebook is Facebook Insights.
It is used to provide an understanding of Facebook page metrics. To explore the key areas of
Facebook analytics measure, the Facebook insights will help the user to understand how and
why each metrics are important to overall social media strategy. The Key priority of
Facebook includes the following aspects,
Overview
The Facebook insights overview section is used to provide a big picture view of
everything that happens on the user page. This section tracks the most important three
measurements such as,
• Page likes
• Post reach
• Engagement – Visits and Posts
Page Likes
The page likes section is used to break down the total number of likes use page has received.
It has three key metrics such as,
• Total likes - This metric is used to give total number of page likes over a 28 day
period.
• Net Likes - This metric is used to gives the total number of new likes on user page.
• Where these likes happened - This metric is used to give information about where
each new likes come from such as from visiting user page directly, or mobile, or
desktop and or page suggestion.
Post Reach
The post reach section is used to provide the overview of how many people saw the
content from the user page and how they interacted with it. It has four key metrics such as
(Buffer Marketing Library, 2019),
• Post reach
• Total reach
• Hide, unlike, report as spam
• Likes, shares and comments
6
⊘ This is a preview!⊘
Do you want full access?
Subscribe today to unlock all pages.
Trusted by 1+ million students worldwide
Visits
This section is used to see how many people are coming to use page and where they are
coming from. It has two metrics such as:
• Page and Tab visits
• External Referrers
Posts
The Posts section is used to provide a powerful range of metrics that allows you to review
and respond to the type of content resonates most with your audience. The post section is
classified into three metrics,
• When your fans are online.
• Post type
• Top posts from pages you watch.
The key priorities are used for development of dashboard which is used to provide an
effective analysis of the Facebook Company. It gives the significant factors for Facebook and
their factors are used to provide the overall organization performance. These are used for the
creation of a dashboard for Facebook (Rankranger.com, 2019).
3. Questions to be answered by Dashboard
Basically, business intelligence is a massive industry. The implementation of a business
intelligence system has spread across a broad spectrum for the selected organization. The
dashboards are often times the focal point of mechanisms that build up a data source and
produce a visual composition to the end users (Idashboards.com, 2019). The dashboard is
helping organizations focus on their goals and ensure their business are effective. The
dashboard has created the insight with the opportunity to better judge performance and it
predicts results early on. The dashboards are used to help an organization transition from
simply measuring the performance to managing it. It meant to drive business processes and
nurture the correct environment and it easily enabling the organization to measure, manage
and monitor the business performance accurately. The development of dashboard has
following aspects such as (Yoast, 2019)
Communicate strategy
Increase visibility
Foster Coordination
7
Paraphrase This Document
Need a fresh take? Get an instant paraphrase of this document with our AI Paraphraser
Increase Motivation
Deliver the actionable information
When the above mentioned actions are performed correctly, Facebook is able to
nurture the environment that provides greater insight needs for the optimal organizational
performance. Based on the organization needs, the below questions will be answered by the
Dashboard.
• Is Facebook a social media lifestyle engagement platform?
• Is Facebook a digital advertising platform?
• Is Facebook a News “Media” platform?
• How many numbers of impressions of user Page post?
• How many number of stories generated about your Page post by people who have
liked your Page?
• How many numbers of people who saw your Page post?
These questions are based on face a book insight that is organization related Facebook
page data.
4. Data and Data Sources
The creation of a dashboard requires data sources for the chosen organization. Here, we
have collected the Facebook insight data from state library of South Australia. This data
contains the post level insights from 1st April 2012 to 31 March 2013. This data set includes
the statistics on how many people talked about the post with their friends, how many people
posts reached, how many people engaged with each post and more. The data set is illustrated
below (Hootsuite Social Media Management, 2019).
8
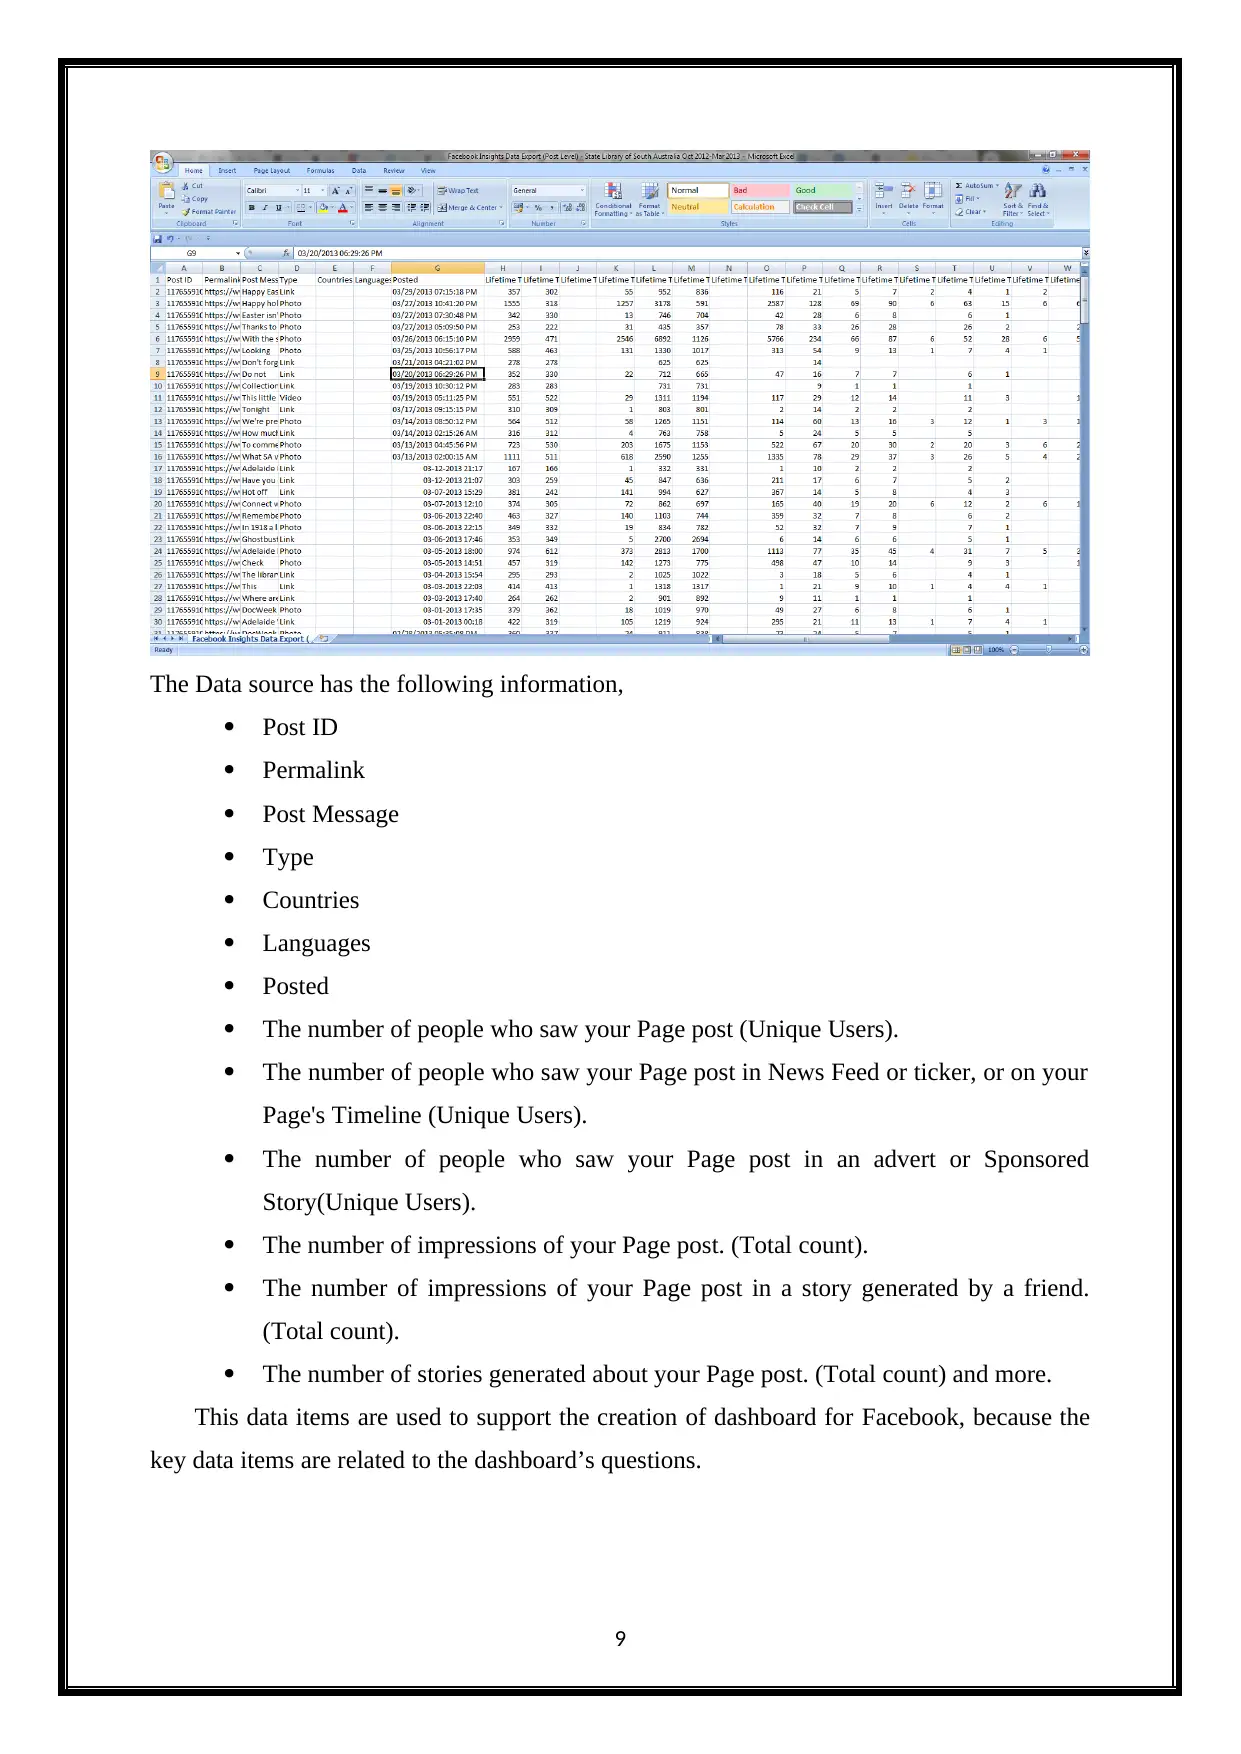
The Data source has the following information,
Post ID
Permalink
Post Message
Type
Countries
Languages
Posted
The number of people who saw your Page post (Unique Users).
The number of people who saw your Page post in News Feed or ticker, or on your
Page's Timeline (Unique Users).
The number of people who saw your Page post in an advert or Sponsored
Story(Unique Users).
The number of impressions of your Page post. (Total count).
The number of impressions of your Page post in a story generated by a friend.
(Total count).
The number of stories generated about your Page post. (Total count) and more.
This data items are used to support the creation of dashboard for Facebook, because the
key data items are related to the dashboard’s questions.
9
⊘ This is a preview!⊘
Do you want full access?
Subscribe today to unlock all pages.
Trusted by 1+ million students worldwide
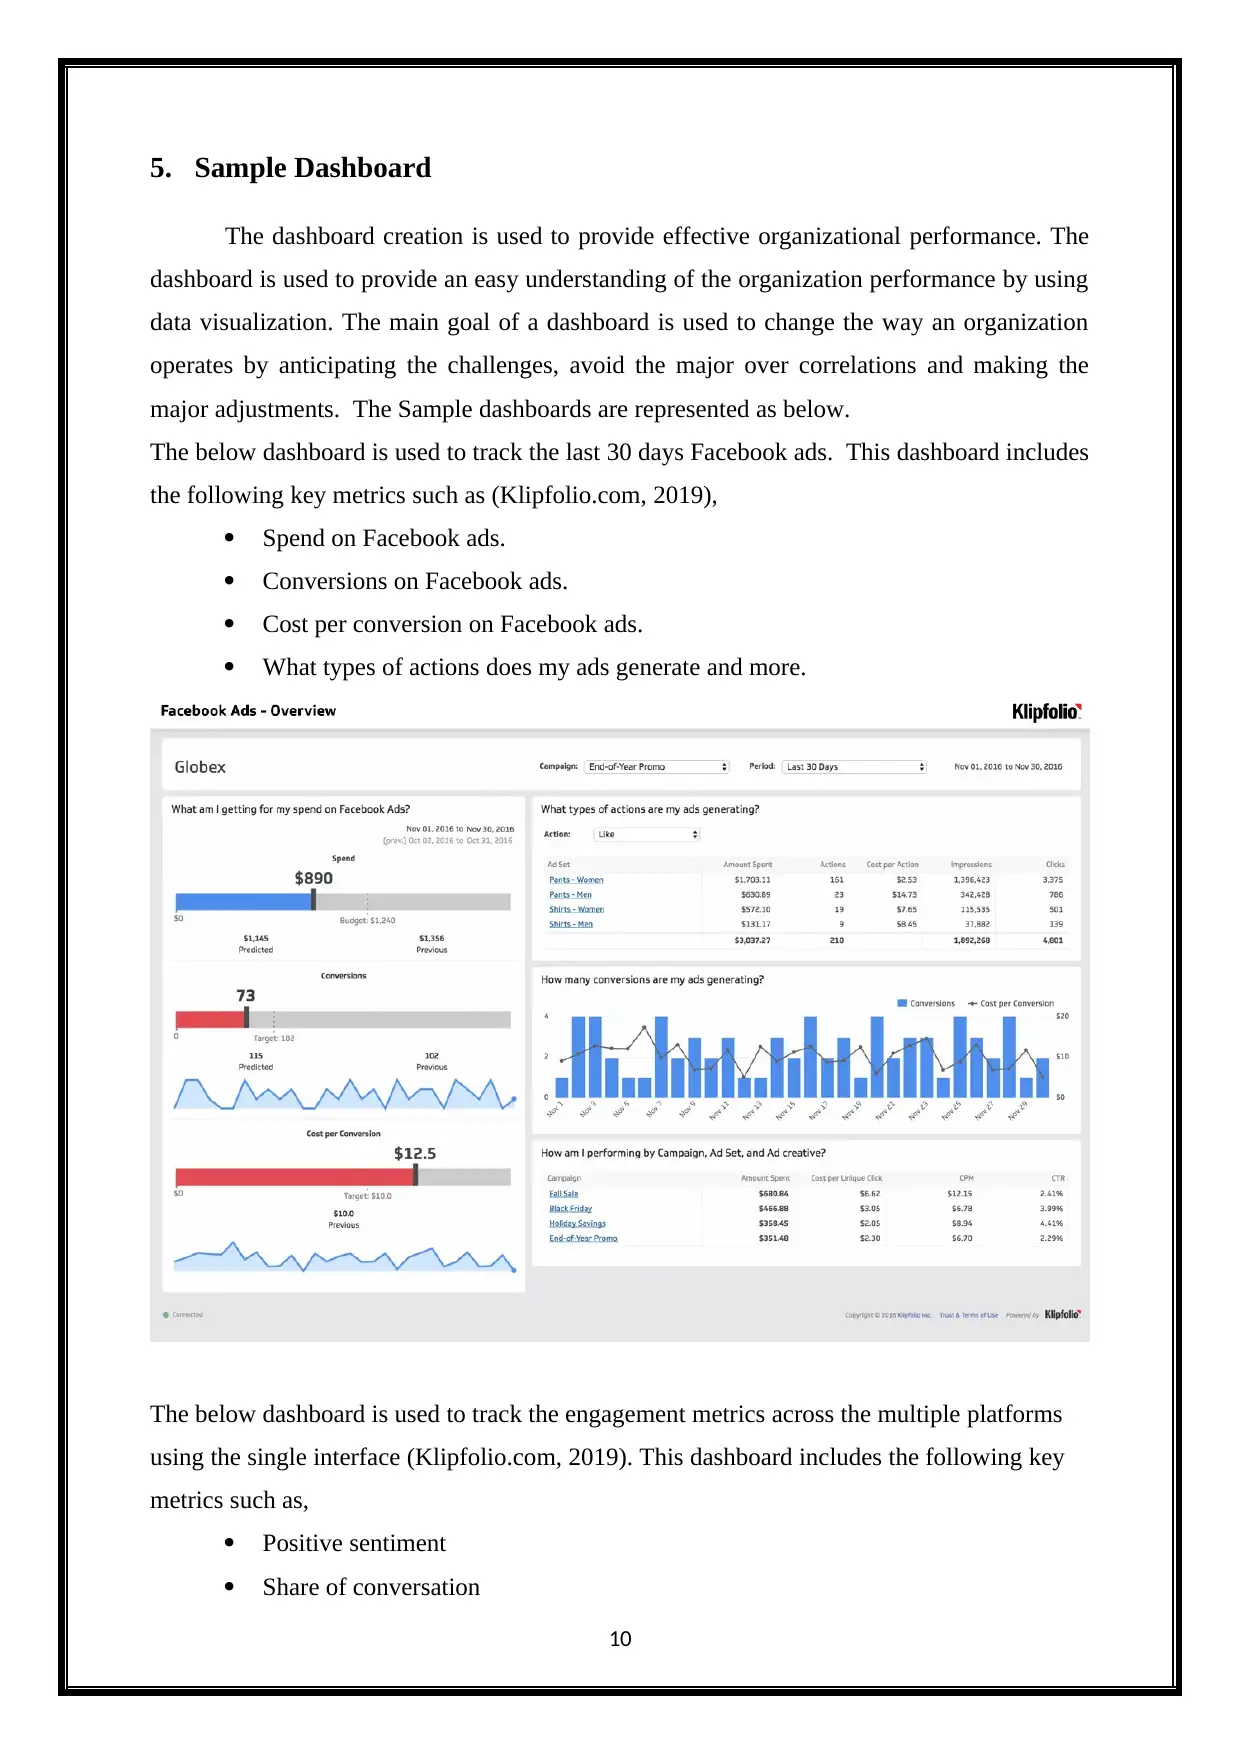
5. Sample Dashboard
The dashboard creation is used to provide effective organizational performance. The
dashboard is used to provide an easy understanding of the organization performance by using
data visualization. The main goal of a dashboard is used to change the way an organization
operates by anticipating the challenges, avoid the major over correlations and making the
major adjustments. The Sample dashboards are represented as below.
The below dashboard is used to track the last 30 days Facebook ads. This dashboard includes
the following key metrics such as (Klipfolio.com, 2019),
Spend on Facebook ads.
Conversions on Facebook ads.
Cost per conversion on Facebook ads.
What types of actions does my ads generate and more.
The below dashboard is used to track the engagement metrics across the multiple platforms
using the single interface (Klipfolio.com, 2019). This dashboard includes the following key
metrics such as,
Positive sentiment
Share of conversation
10
Paraphrase This Document
Need a fresh take? Get an instant paraphrase of this document with our AI Paraphraser
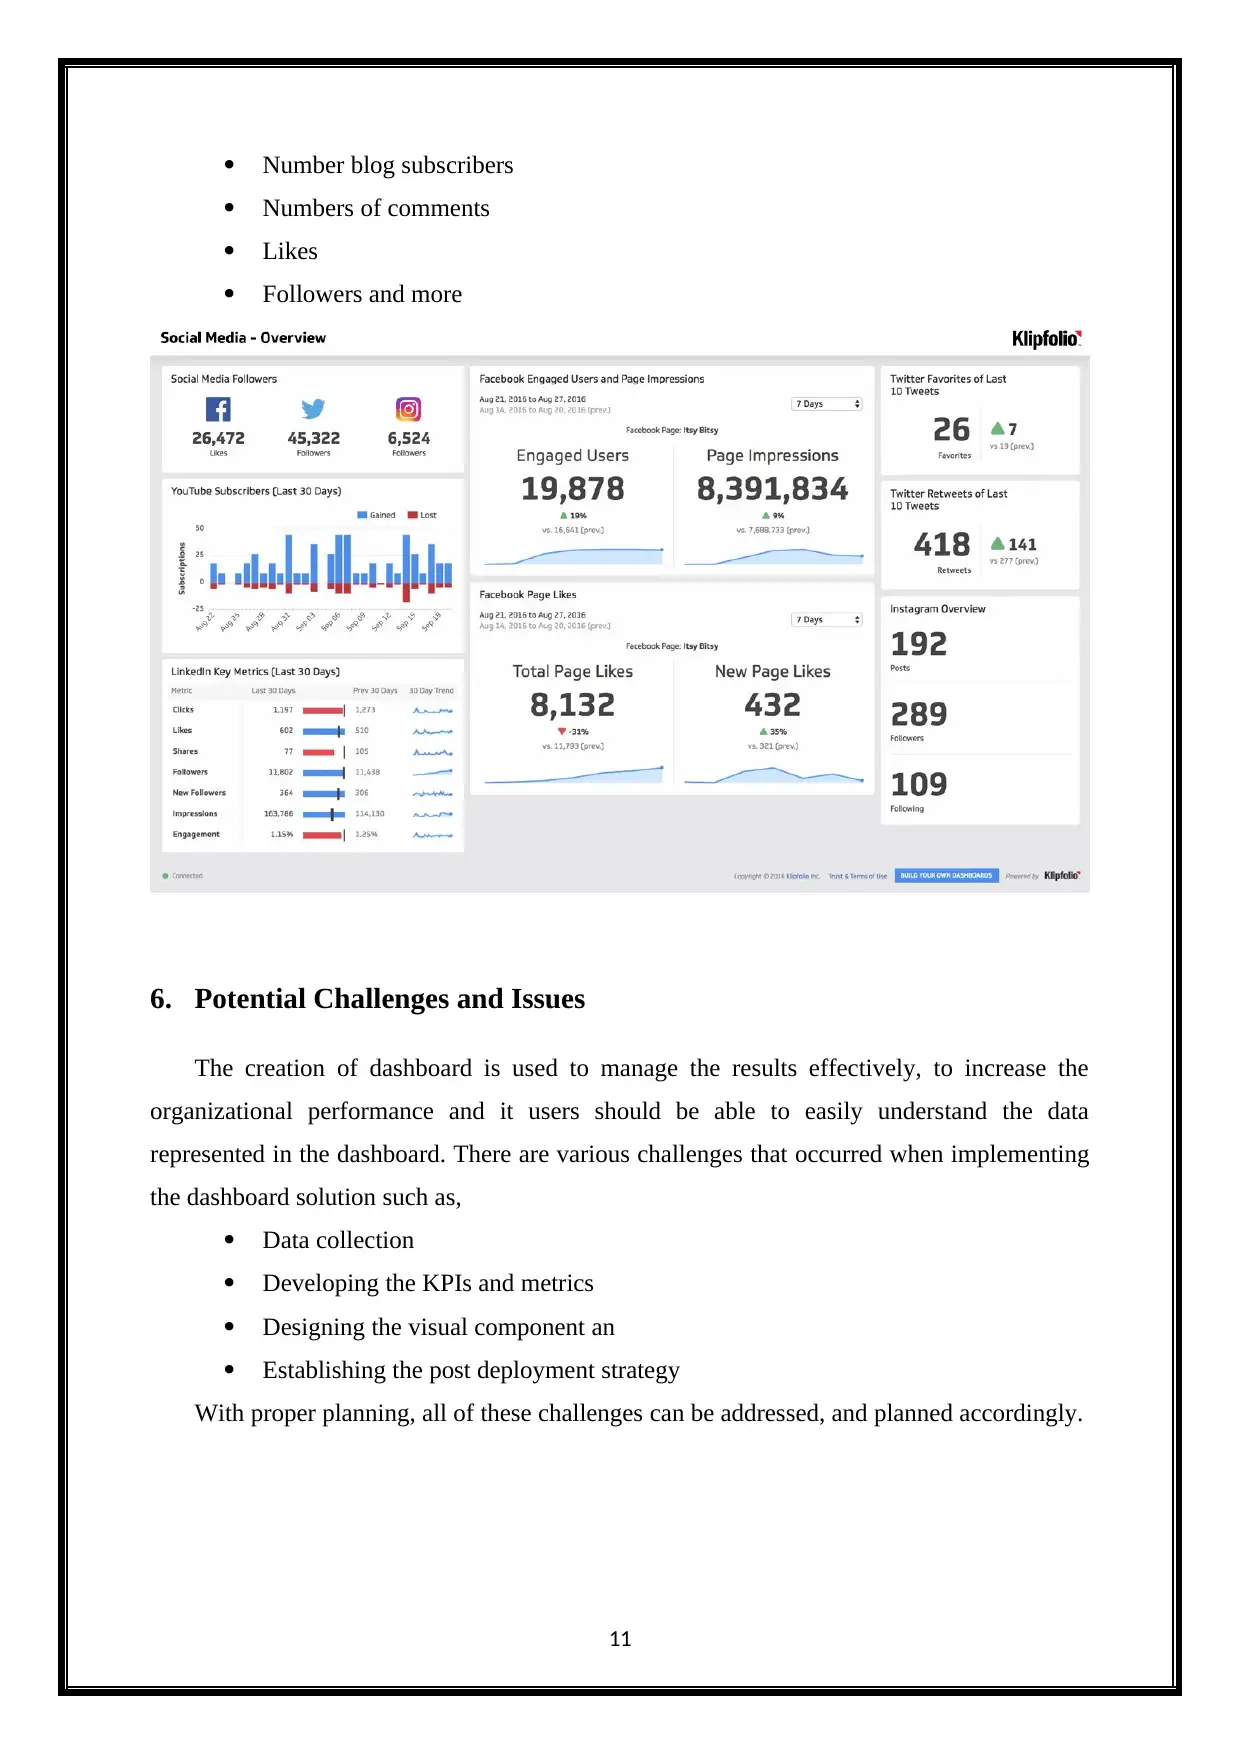
Number blog subscribers
Numbers of comments
Likes
Followers and more
6. Potential Challenges and Issues
The creation of dashboard is used to manage the results effectively, to increase the
organizational performance and it users should be able to easily understand the data
represented in the dashboard. There are various challenges that occurred when implementing
the dashboard solution such as,
Data collection
Developing the KPIs and metrics
Designing the visual component an
Establishing the post deployment strategy
With proper planning, all of these challenges can be addressed, and planned accordingly.
11
7. Conclusion
This project was successfully prepared the project proposal for selected organization
which is related to Facebook. This proposal has effectively developed the dashboard for
Facebook. The development of a dashboard is helping organizations focus on their goals and
ensure their business are effective. This Proposal provides the following information such as
Overview of the Facebook, prepares the questions to be answered by Dashboard, Collect the
data about the Facebook insights, Search the sample dashboard on Websites and finally,
identifies the potential challenges and issues for the Facebook organization.
At last, the organization should think about the plan of action and keep goals in mind
before designing their dashboards. The dashboard is always best to show them throughout the
organization process.
12
⊘ This is a preview!⊘
Do you want full access?
Subscribe today to unlock all pages.
Trusted by 1+ million students worldwide
1 out of 13
Related Documents


Your All-in-One AI-Powered Toolkit for Academic Success.
+13062052269
info@desklib.com
Available 24*7 on WhatsApp / Email
![[object Object]](/_next/static/media/star-bottom.7253800d.svg)
Unlock your academic potential
Copyright © 2020–2026 A2Z Services. All Rights Reserved. Developed and managed by ZUCOL.