Comprehensive Financial Statement and Investment Analysis of ING Bank
VerifiedAdded on 2023/05/31
|10
|2208
|254
Report
AI Summary
This report provides a comprehensive financial analysis of ING Bank, examining its core business activities, including retail, commercial, and investment banking, as well as asset management and insurance services. The report highlights major changes in the company's financial performance, such as increased net profits, a high return on equity, and a strong CET 1 ratio. It also discusses the company's strategic initiatives, including investments in financial technology start-ups and the implementation of online wealth management services. The report includes a detailed ratio analysis of the company for 2016 and 2017, covering liquidity, debt management, and profitability ratios. Furthermore, it presents the consolidated statement of financial position and profit or loss, providing an overview of the company's financial performance. The analysis concludes with an overall assessment of ING Bank's financial health and future prospects, including its plans for expansion and investment in new markets and technologies.
Financial Statement
and Investment
Analysis Assignment
and Investment
Analysis Assignment
Paraphrase This Document
Need a fresh take? Get an instant paraphrase of this document with our AI Paraphraser
1
By student name
Professor
University
Date: 25 April 2018.
1 | P a g e
By student name
Professor
University
Date: 25 April 2018.
1 | P a g e
2
Contents
Background and Abstract............................................................................................................................3
Introduction: Core business and different segments...................................................................................3
Discussion and Analysis...............................................................................................................................3
Major changes in the financial performance...........................................................................................3
Ratio Analysis of the company.................................................................................................................4
Conclusion...................................................................................................................................................5
Financial Analysis and overall assessment...............................................................................................5
References...................................................................................................................................................9
2 | P a g e
⊘ This is a preview!⊘
Do you want full access?
Subscribe today to unlock all pages.
Trusted by 1+ million students worldwide
3
Background and Abstract
A report has been prepared on the one of the banks called ING Bank. The report highlights the core
business activity of the company and the different segments in which the company is involved. It also
mentions the major changes that have took place in the company over the past years as shown in the
chairman’s message and the review by the managing director. Key financial ratios have also been
computed for the last 2 years, 2017 and 2016 and finally the overall assessment of the company and the
prospects in future have also been highlighted.
Introduction: Core business and different segments
The ING group is a Dutch multinational banking financial services offering company based out of
Amsterdam. It is one of the pioneer companies in banking industry and has its stretch over a number of
countries all around the word. The core business activities of the company includes direct and retail
banking, commercial banking and investment banking as well. It also deals in asset management
activities and insurance services as well (Belton, 2017). The company has served more than 37.4 million
customers in over 40 nations over the world and is a part of Euro Stoxx 50 stock market index. The
primary purpose of the company is empower people to be step ahead in both lives as well as business.
The company has been operating in some of the major economies like those of United States, India,
China, United Kingdom, Spain, Brazil, Hungary, Malaysia, Luxembourg, Monaco, Netherlands, Columbia,
etc. The company has the largest market share in the retail banking which scales up to 40%, followed by
direct banking and commercial banking (Trieu, 2017).
Discussion and Analysis
Major changes in the financial performance
The company has been focusing on the international expansion and capital injection for the last couple
of years through mergers and acquisition. As per the message of the Chairman of the company and the
managing director, the group’s net profits have increased by more than 5% over the past year, the
group’s return on equity was 10.2% which is much higher than the normal industry trend. The Fully
loaded CET 1 ratio ING Group was 14.7% which is one of the major achievements in the history of the
company as it shows minimal risk for the company (Mubako & O'Donnell, 2018). Amongst the major
financial changes, the company came up with innovation techniques to compete with giants like Google
and Amazon. The company also announced venturing and investing in the start-ups as well. For the
same, 300 Million Euro was being planned to invest in the financial technology based start-ups. In the
Global Bank Awards 2017, it was awarded the best bank in the world. The company also started with the
online wealth management services in Germany where the customer would not have to be concerned
regarding the asset allocation and the product selection (Sithole, Chandler, Abeysekera, & Paas, 2017).
Amongst the non-financial measures, the company started with the Think Forward Leadership
Experience to train 5000+ managers. All these measures have fuelled up growth for the company and
has increased the performance of the company over the past years. Many such measures are still there
in the pipeline (Choy, 2018).
3 | P a g e
Paraphrase This Document
Need a fresh take? Get an instant paraphrase of this document with our AI Paraphraser
4
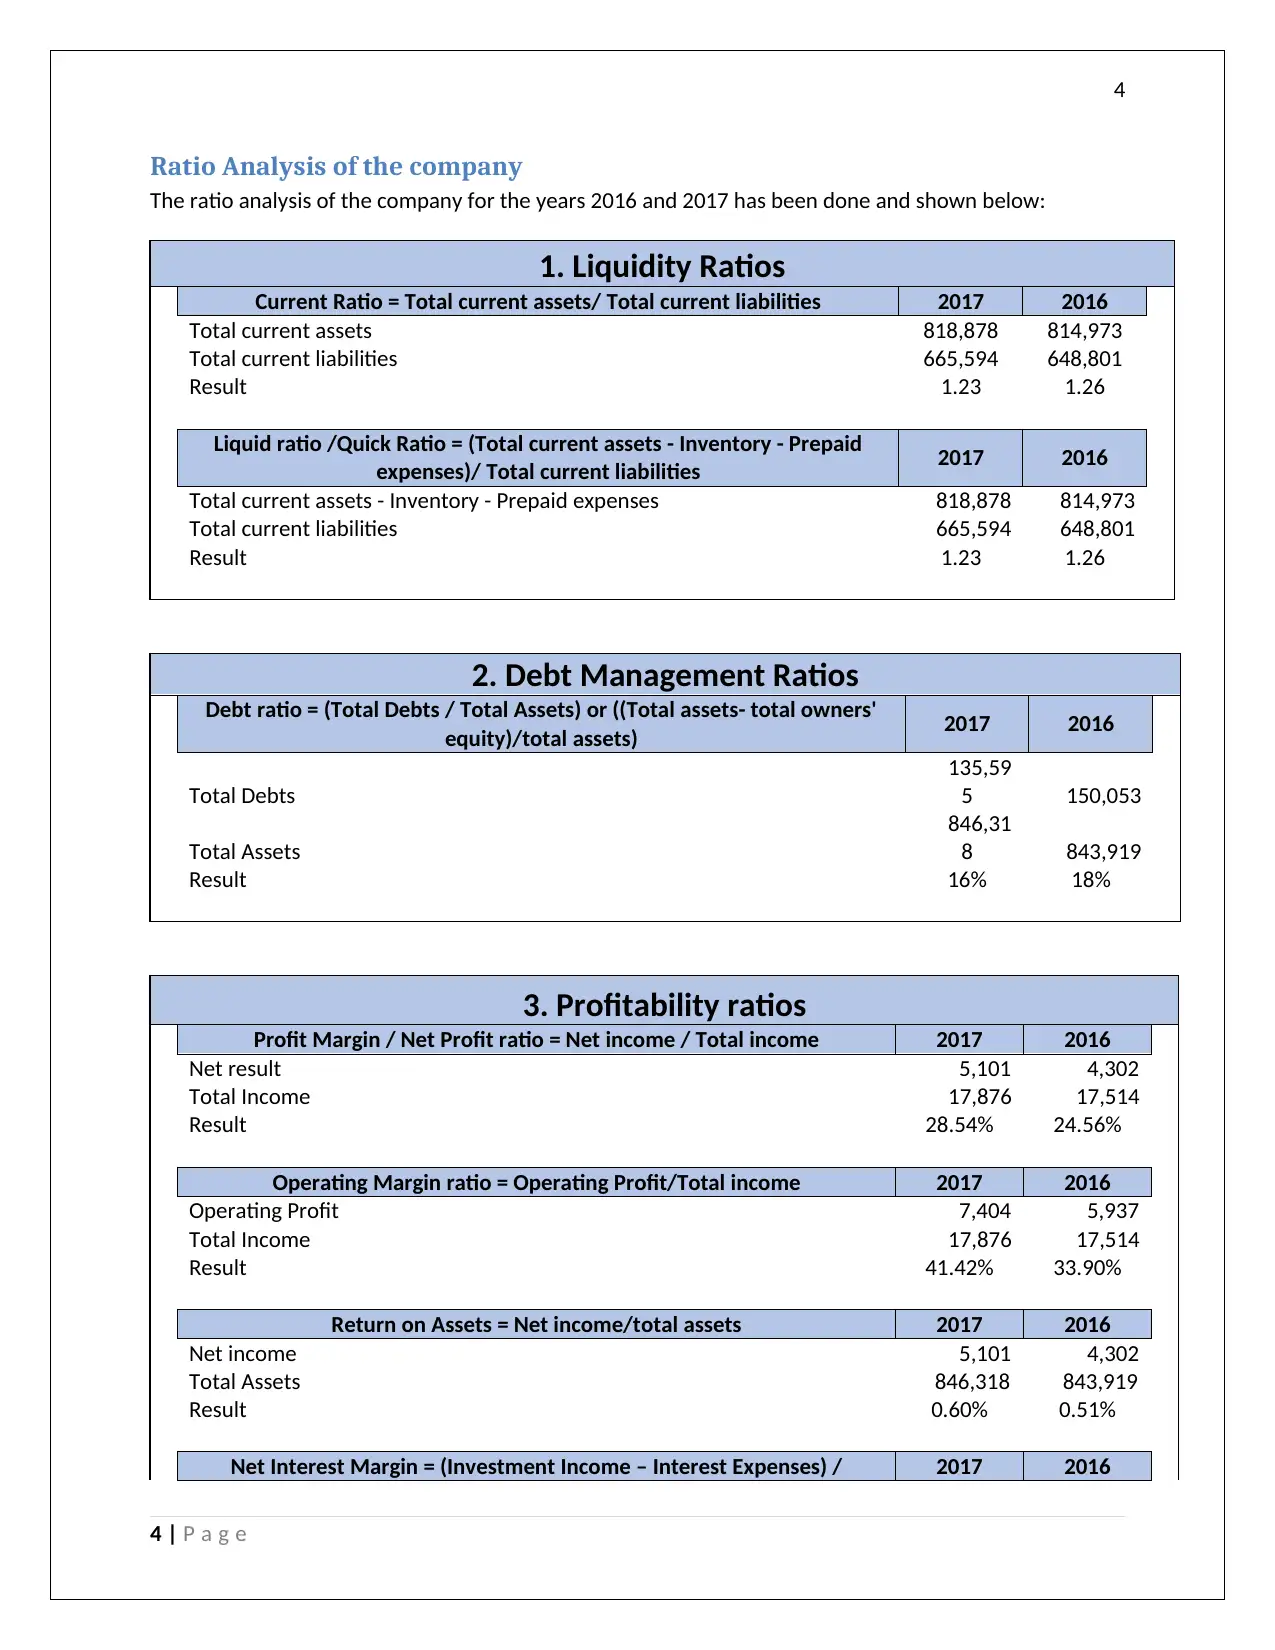
Ratio Analysis of the company
The ratio analysis of the company for the years 2016 and 2017 has been done and shown below:
1. Liquidity Ratios
Current Ratio = Total current assets/ Total current liabilities 2017 2016
Total current assets 818,878 814,973
Total current liabilities 665,594 648,801
Result 1.23 1.26
Liquid ratio /Quick Ratio = (Total current assets - Inventory - Prepaid
expenses)/ Total current liabilities 2017 2016
Total current assets - Inventory - Prepaid expenses 818,878 814,973
Total current liabilities 665,594 648,801
Result 1.23 1.26
2. Debt Management Ratios
Debt ratio = (Total Debts / Total Assets) or ((Total assets- total owners'
equity)/total assets) 2017 2016
Total Debts
135,59
5 150,053
Total Assets
846,31
8 843,919
Result 16% 18%
3. Profitability ratios
Profit Margin / Net Profit ratio = Net income / Total income 2017 2016
Net result 5,101 4,302
Total Income 17,876 17,514
Result 28.54% 24.56%
Operating Margin ratio = Operating Profit/Total income 2017 2016
Operating Profit 7,404 5,937
Total Income 17,876 17,514
Result 41.42% 33.90%
Return on Assets = Net income/total assets 2017 2016
Net income 5,101 4,302
Total Assets 846,318 843,919
Result 0.60% 0.51%
Net Interest Margin = (Investment Income – Interest Expenses) / 2017 2016
4 | P a g e
5
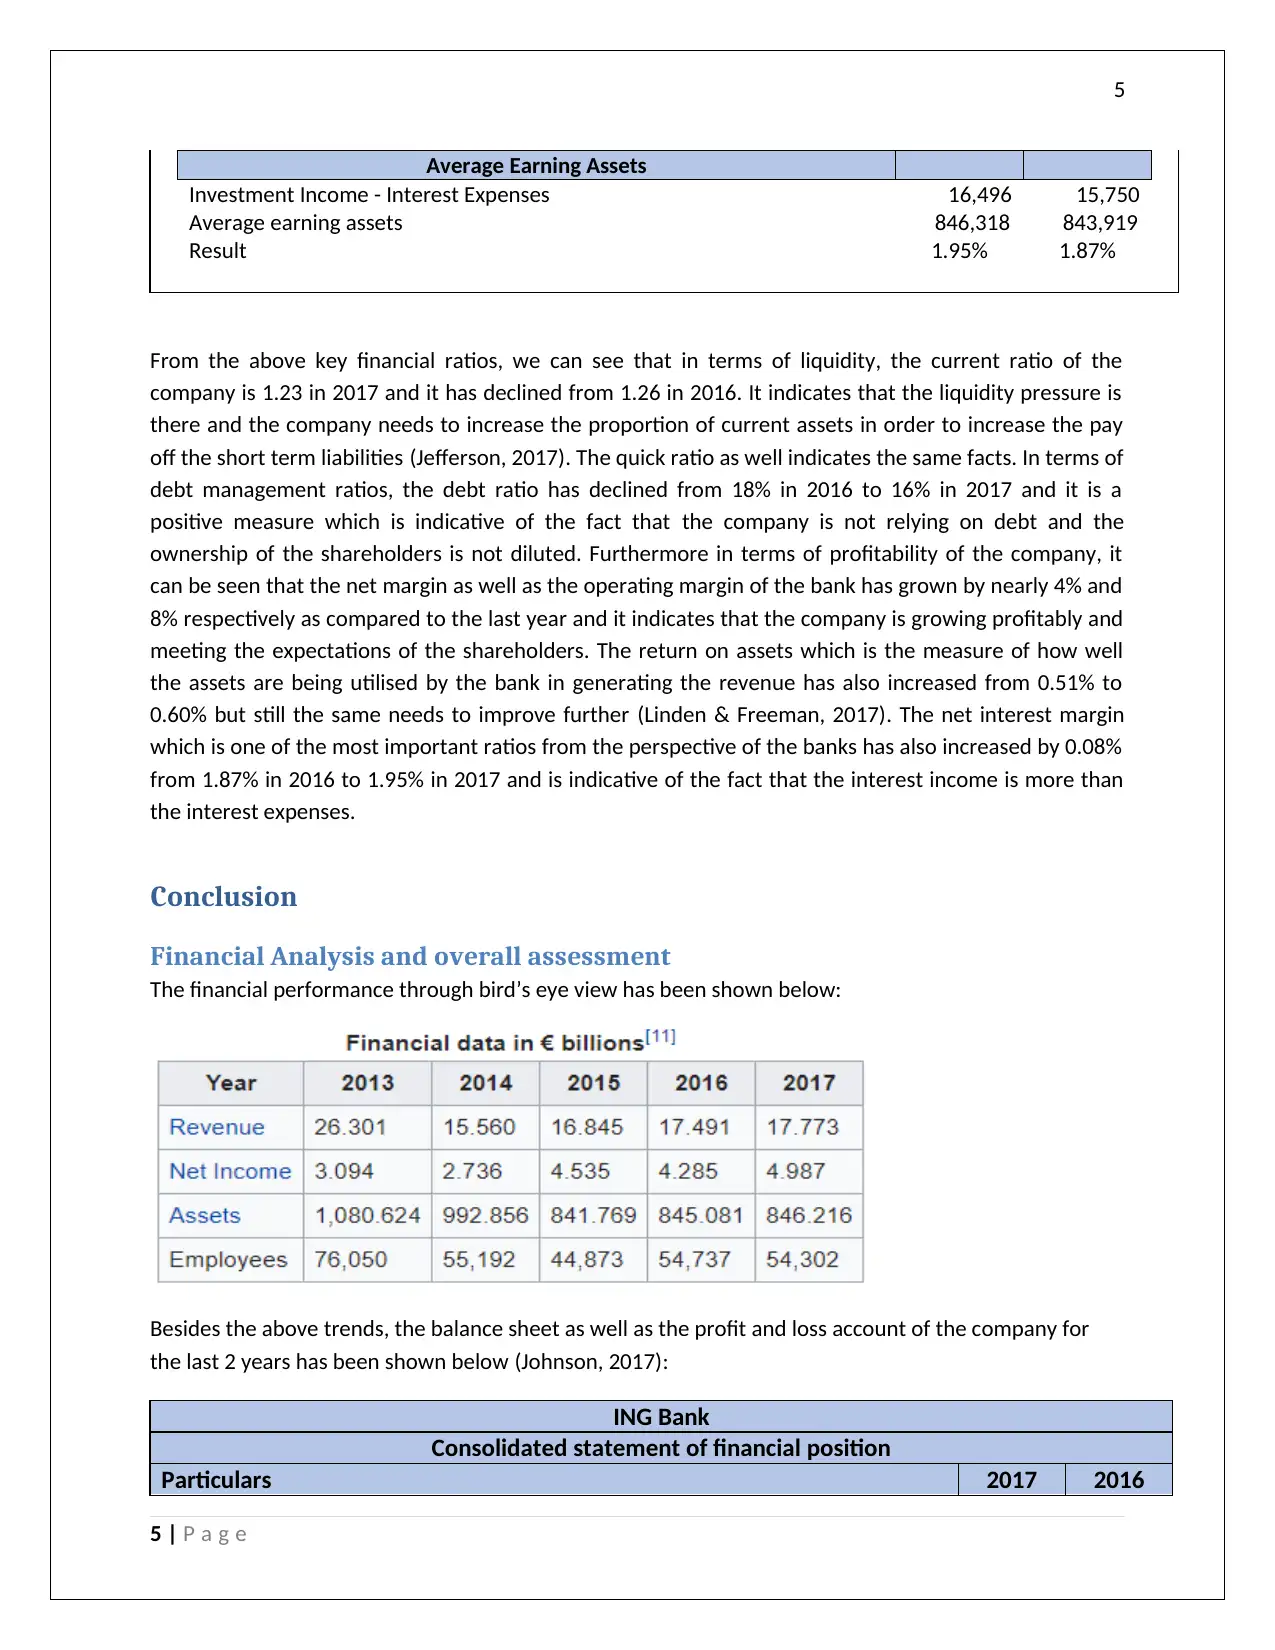
Average Earning Assets
Investment Income - Interest Expenses 16,496 15,750
Average earning assets 846,318 843,919
Result 1.95% 1.87%
From the above key financial ratios, we can see that in terms of liquidity, the current ratio of the
company is 1.23 in 2017 and it has declined from 1.26 in 2016. It indicates that the liquidity pressure is
there and the company needs to increase the proportion of current assets in order to increase the pay
off the short term liabilities (Jefferson, 2017). The quick ratio as well indicates the same facts. In terms of
debt management ratios, the debt ratio has declined from 18% in 2016 to 16% in 2017 and it is a
positive measure which is indicative of the fact that the company is not relying on debt and the
ownership of the shareholders is not diluted. Furthermore in terms of profitability of the company, it
can be seen that the net margin as well as the operating margin of the bank has grown by nearly 4% and
8% respectively as compared to the last year and it indicates that the company is growing profitably and
meeting the expectations of the shareholders. The return on assets which is the measure of how well
the assets are being utilised by the bank in generating the revenue has also increased from 0.51% to
0.60% but still the same needs to improve further (Linden & Freeman, 2017). The net interest margin
which is one of the most important ratios from the perspective of the banks has also increased by 0.08%
from 1.87% in 2016 to 1.95% in 2017 and is indicative of the fact that the interest income is more than
the interest expenses.
Conclusion
Financial Analysis and overall assessment
The financial performance through bird’s eye view has been shown below:
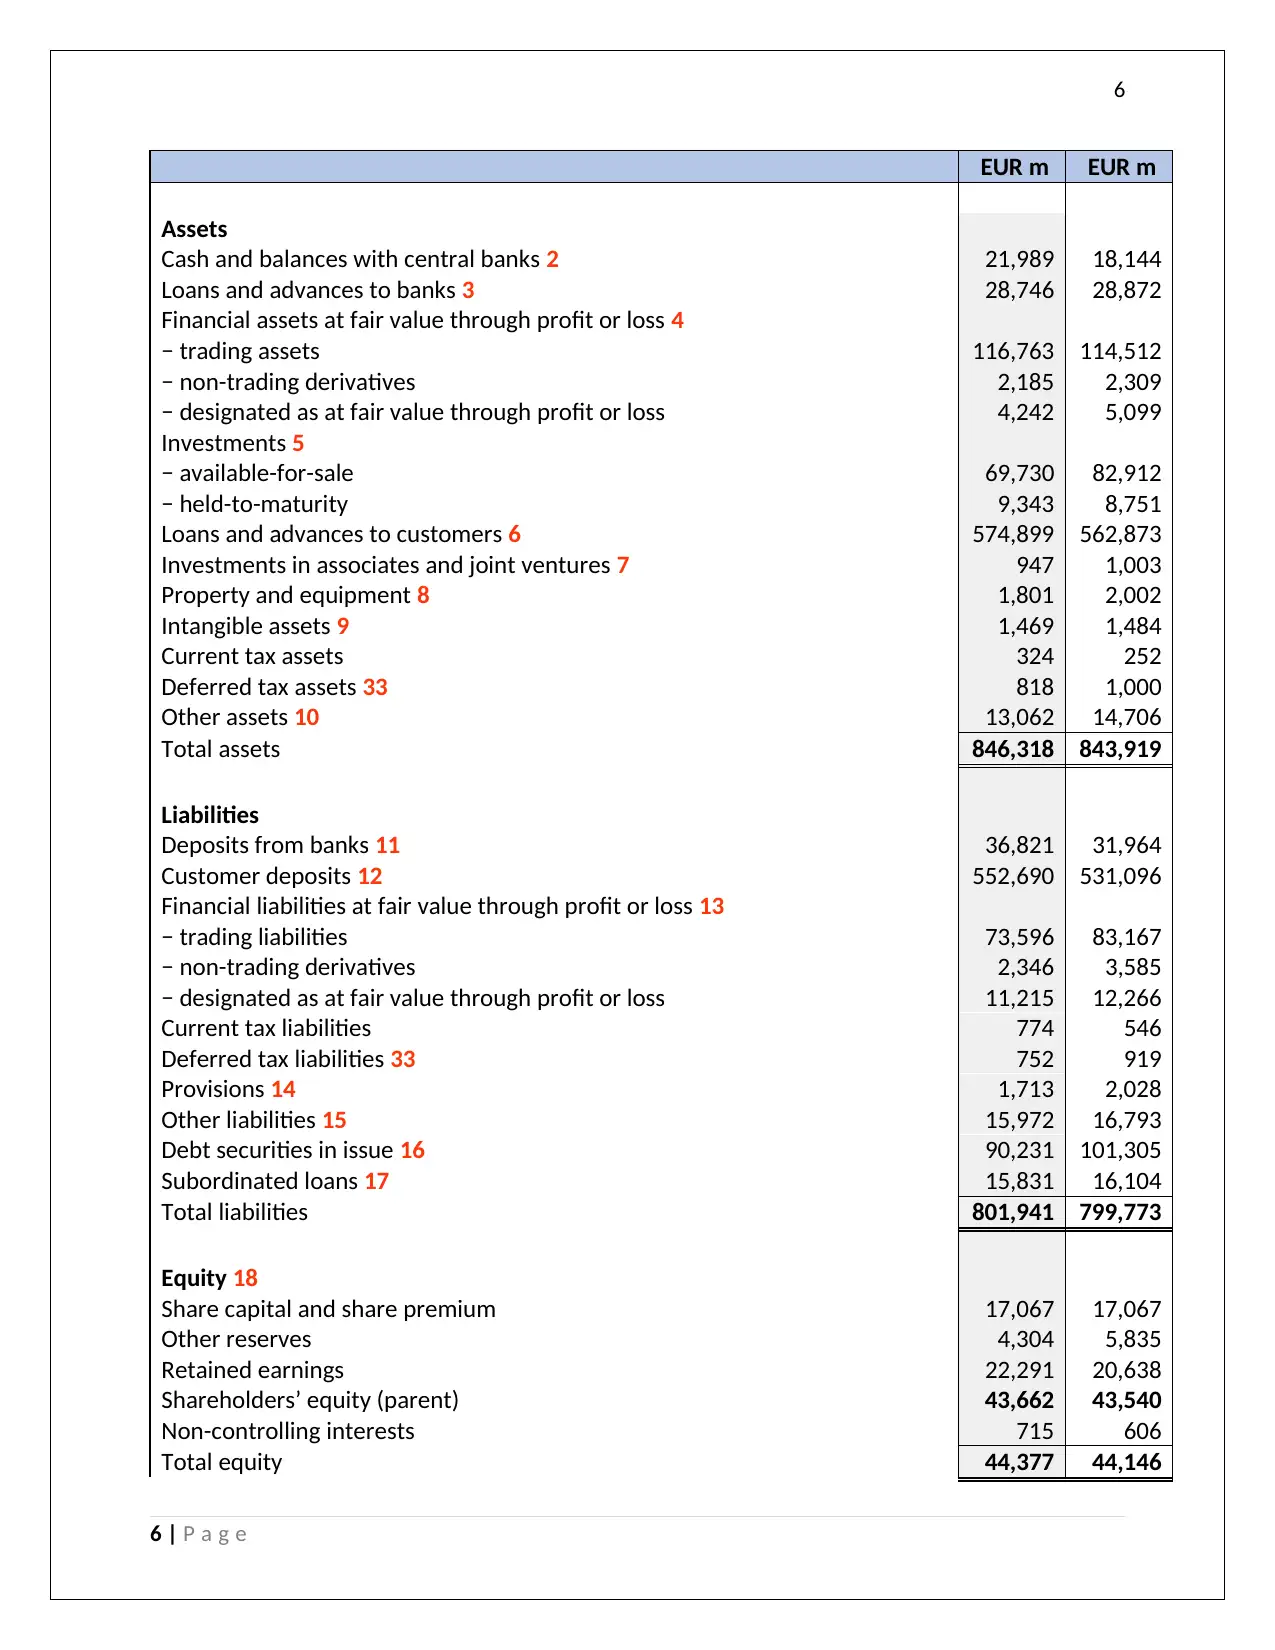
Besides the above trends, the balance sheet as well as the profit and loss account of the company for
the last 2 years has been shown below (Johnson, 2017):
ING Bank
Consolidated statement of financial position
Particulars 2017 2016
5 | P a g e
Average Earning Assets
Investment Income - Interest Expenses 16,496 15,750
Average earning assets 846,318 843,919
Result 1.95% 1.87%
From the above key financial ratios, we can see that in terms of liquidity, the current ratio of the
company is 1.23 in 2017 and it has declined from 1.26 in 2016. It indicates that the liquidity pressure is
there and the company needs to increase the proportion of current assets in order to increase the pay
off the short term liabilities (Jefferson, 2017). The quick ratio as well indicates the same facts. In terms of
debt management ratios, the debt ratio has declined from 18% in 2016 to 16% in 2017 and it is a
positive measure which is indicative of the fact that the company is not relying on debt and the
ownership of the shareholders is not diluted. Furthermore in terms of profitability of the company, it
can be seen that the net margin as well as the operating margin of the bank has grown by nearly 4% and
8% respectively as compared to the last year and it indicates that the company is growing profitably and
meeting the expectations of the shareholders. The return on assets which is the measure of how well
the assets are being utilised by the bank in generating the revenue has also increased from 0.51% to
0.60% but still the same needs to improve further (Linden & Freeman, 2017). The net interest margin
which is one of the most important ratios from the perspective of the banks has also increased by 0.08%
from 1.87% in 2016 to 1.95% in 2017 and is indicative of the fact that the interest income is more than
the interest expenses.
Conclusion
Financial Analysis and overall assessment
The financial performance through bird’s eye view has been shown below:
Besides the above trends, the balance sheet as well as the profit and loss account of the company for
the last 2 years has been shown below (Johnson, 2017):
ING Bank
Consolidated statement of financial position
Particulars 2017 2016
5 | P a g e
⊘ This is a preview!⊘
Do you want full access?
Subscribe today to unlock all pages.
Trusted by 1+ million students worldwide
6
EUR m EUR m
Assets
Cash and balances with central banks 2 21,989 18,144
Loans and advances to banks 3 28,746 28,872
Financial assets at fair value through profit or loss 4
− trading assets 116,763 114,512
− non-trading derivatives 2,185 2,309
− designated as at fair value through profit or loss 4,242 5,099
Investments 5
− available-for-sale 69,730 82,912
− held-to-maturity 9,343 8,751
Loans and advances to customers 6 574,899 562,873
Investments in associates and joint ventures 7 947 1,003
Property and equipment 8 1,801 2,002
Intangible assets 9 1,469 1,484
Current tax assets 324 252
Deferred tax assets 33 818 1,000
Other assets 10 13,062 14,706
Total assets 846,318 843,919
Liabilities
Deposits from banks 11 36,821 31,964
Customer deposits 12 552,690 531,096
Financial liabilities at fair value through profit or loss 13
− trading liabilities 73,596 83,167
− non-trading derivatives 2,346 3,585
− designated as at fair value through profit or loss 11,215 12,266
Current tax liabilities 774 546
Deferred tax liabilities 33 752 919
Provisions 14 1,713 2,028
Other liabilities 15 15,972 16,793
Debt securities in issue 16 90,231 101,305
Subordinated loans 17 15,831 16,104
Total liabilities 801,941 799,773
Equity 18
Share capital and share premium 17,067 17,067
Other reserves 4,304 5,835
Retained earnings 22,291 20,638
Shareholders’ equity (parent) 43,662 43,540
Non-controlling interests 715 606
Total equity 44,377 44,146
6 | P a g e
Paraphrase This Document
Need a fresh take? Get an instant paraphrase of this document with our AI Paraphraser
7
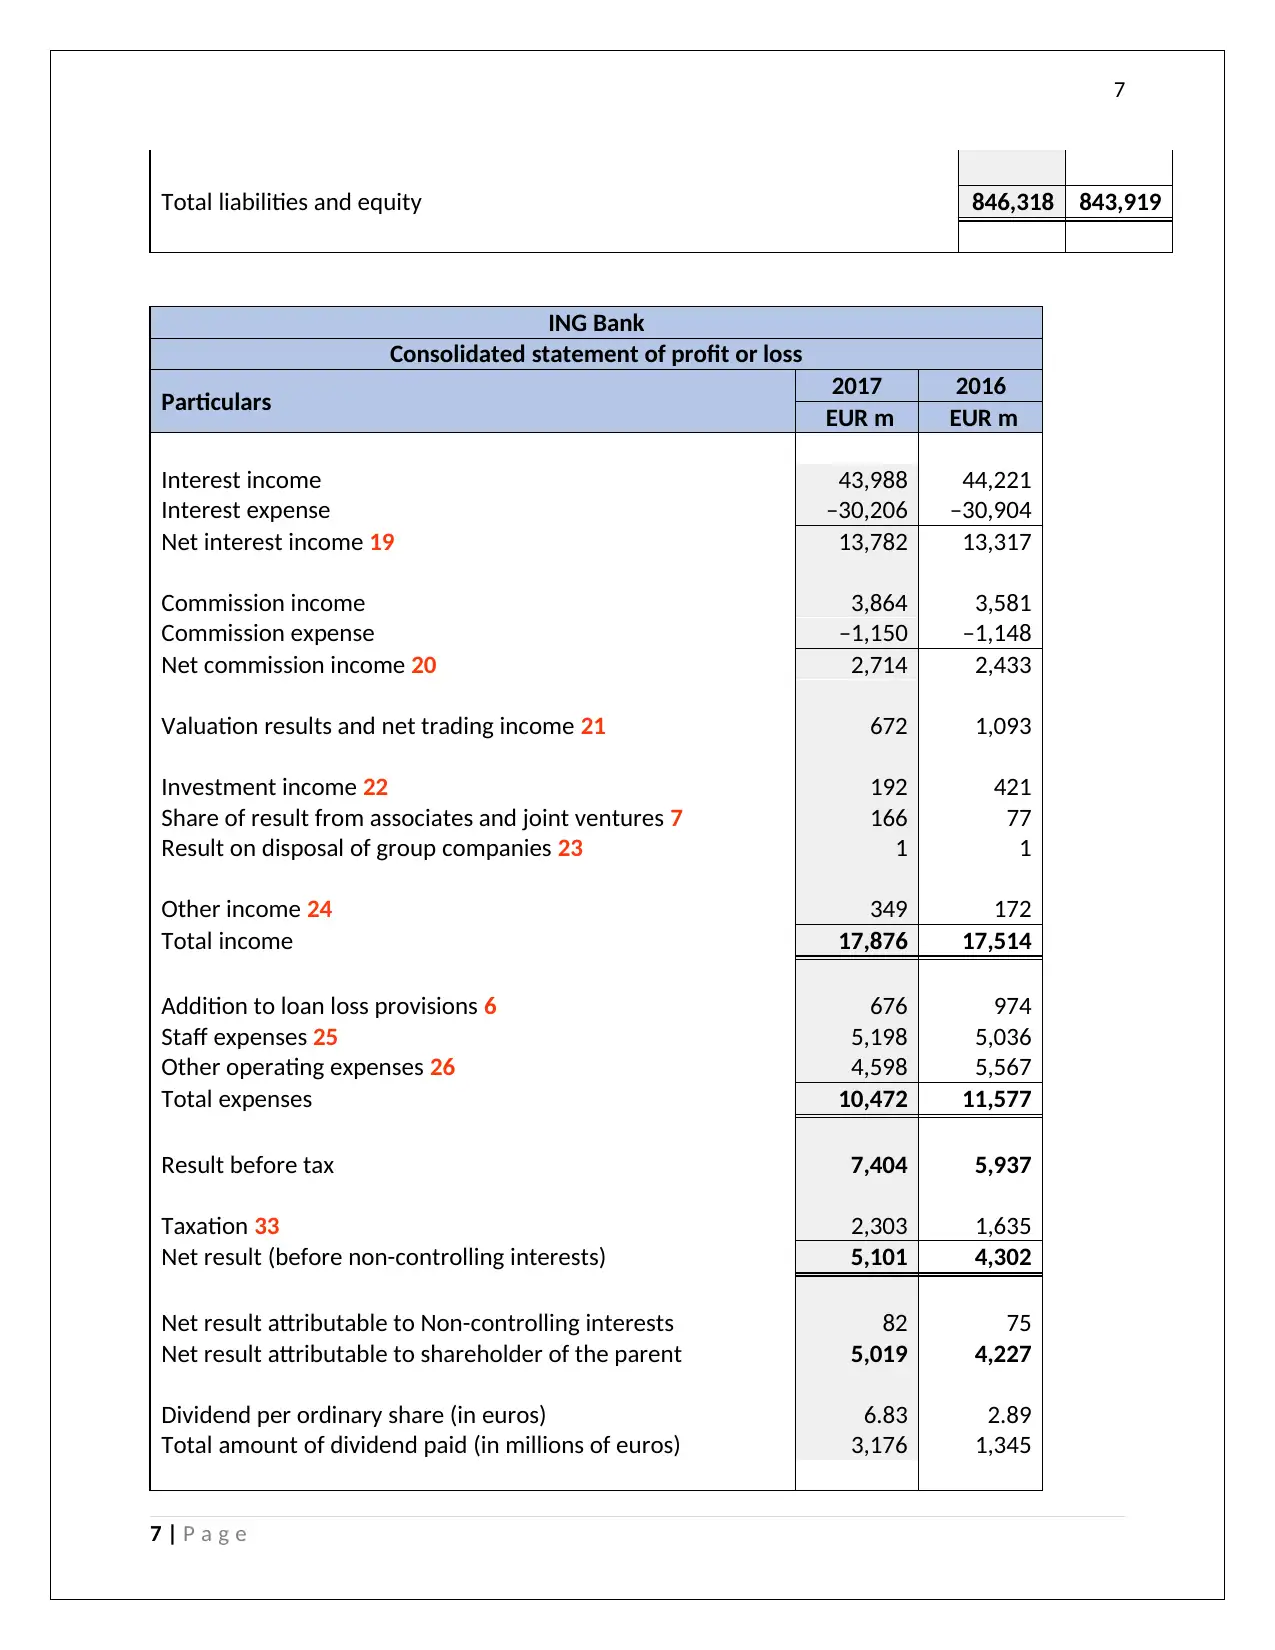
Total liabilities and equity 846,318 843,919
ING Bank
Consolidated statement of profit or loss
Particulars 2017 2016
EUR m EUR m
Interest income 43,988 44,221
Interest expense –30,206 –30,904
Net interest income 19 13,782 13,317
Commission income 3,864 3,581
Commission expense –1,150 –1,148
Net commission income 20 2,714 2,433
Valuation results and net trading income 21 672 1,093
Investment income 22 192 421
Share of result from associates and joint ventures 7 166 77
Result on disposal of group companies 23 1 1
Other income 24 349 172
Total income 17,876 17,514
Addition to loan loss provisions 6 676 974
Staff expenses 25 5,198 5,036
Other operating expenses 26 4,598 5,567
Total expenses 10,472 11,577
Result before tax 7,404 5,937
Taxation 33 2,303 1,635
Net result (before non-controlling interests) 5,101 4,302
Net result attributable to Non-controlling interests 82 75
Net result attributable to shareholder of the parent 5,019 4,227
Dividend per ordinary share (in euros) 6.83 2.89
Total amount of dividend paid (in millions of euros) 3,176 1,345
7 | P a g e
8
From the above discussion and analysis, it can be mentioned that the company has been a growing one
and has also been earning profit over the period of time (Dichev, 2017). As far as the future prospects of
the company is concerned, it plans to expand further and venture into new markets and start several
online asset management services (Meroño-Cerdán, Lopez-Nicolas, & Molina-Castillo, 2017).
Furthermore, as has been mentioned above, the company also has planned investment in the
technology based start-ups which is aimed at increasing both the top line as well as bottom-line of the
company and improve the customer experience and services. Besides this, the company has met all the
sustainability reporting measures and is continuously working in the area of corporate governance and
hence all in all, the company has good future prospects (Marques, 2018).
8 | P a g e
⊘ This is a preview!⊘
Do you want full access?
Subscribe today to unlock all pages.
Trusted by 1+ million students worldwide
9
References
Belton, P. (2017). Competitive Strategy: Creating and Sustaining Superior Performance (Vol. 2). London:
Macat International ltd.
Choy, Y. K. (2018). Cost-benefit Analysis, Values, Wellbeing and Ethics: An Indigenous Worldview
Analysis. Ecological Economics, 145. Retrieved from
https://doi.org/10.1016/j.ecolecon.2017.08.005
Dichev, I. (2017). On the conceptual foundations of financial reporting. Accounting and Business
Research, 47(6), 617-632. doi:https://doi.org/10.1080/00014788.2017.1299620
Jefferson, M. (2017). Energy, Complexity and Wealth Maximization, R. Ayres. Springer, Switzerland .
Technological Forecasting and Social Change, 353-354.
Johnson, R. (2017). The Best Strategies for Investing. In the News, 21-31.
Linden, B., & Freeman, R. (2017). Profit and Other Values: Thick Evaluation in Decision Making. Business
Ethics Quarterly, 27(3), 353-379. Retrieved from https://doi.org/10.1017/beq.2017.1
Marques, R. P. (2018). Continuous Assurance and the Use of Technology for Business Compliance.
Encyclopedia of Information Science and Technology, 820-830.
Meroño-Cerdán, A., Lopez-Nicolas, C., & Molina-Castillo, F. (2017). Risk aversion, innovation and
performance in family firms. Economics of Innovation and new technology, 1-15.
Mubako, G., & O'Donnell, E. (2018). Effect of fraud risk assessments on auditor skepticism: Unintended
consequences on evidence evaluation. International Journal of Auditing, 22(1), 55-64.
Sithole, S., Chandler, P., Abeysekera, I., & Paas, F. (2017). Benefits of guided self-management of
attention on learning accounting. Journal of Educational Psychology, 109(2), 220. Retrieved from
http://psycnet.apa.org/buy/2016-21263-001
Trieu, V. (2017). Getting value from Business Intelligence systems: A review and research agenda.
Decision Support Systems, 93(1), 111-124.
9 | P a g e
1 out of 10
Related Documents


Your All-in-One AI-Powered Toolkit for Academic Success.
+13062052269
info@desklib.com
Available 24*7 on WhatsApp / Email
![[object Object]](/_next/static/media/star-bottom.7253800d.svg)
Unlock your academic potential
Copyright © 2020–2026 A2Z Services. All Rights Reserved. Developed and managed by ZUCOL.