Innovation Project: Managing and Developing Innovations, Analysis
VerifiedAdded on 2023/01/18
|12
|1900
|59
Project
AI Summary
This project focuses on managing and developing innovations, providing a comprehensive analysis of a new technology designed to support customers in their daily operations. It begins with an introduction to the concept and a discussion of the market size, trends, and potential for growth, especially in Australia. The project then identifies the target market, consumer demographics, and competitive landscape. A SWOT analysis and Porter's Five Forces model are employed to assess the company's strengths, weaknesses, opportunities, and threats, as well as the competitive dynamics of the industry. The project includes financial forecasts, such as profit and loss statements, cash flow projections, and a breakeven analysis. The financial data indicates that the company's business model may be viable, and the report concludes with a summary of the findings and a list of references.
Running head: MANAGING AND DEVLOPING INNOVATIONS
Managing and Developing Innovations
Name of the Student:
Name of the University:
Author’s Note:
Managing and Developing Innovations
Name of the Student:
Name of the University:
Author’s Note:
Paraphrase This Document
Need a fresh take? Get an instant paraphrase of this document with our AI Paraphraser
1MANAGING AND DEVLOPING INNOVATIONS
Table of Contents
Introduction......................................................................................................................................2
Discussion........................................................................................................................................2
Market and Customers, Market Size and Trend..........................................................................2
Target Market and Consumers.....................................................................................................3
Competitive Analysis and Estimated Market Share....................................................................4
SWOT Analysis.......................................................................................................................4
Porter’s Five Forces.................................................................................................................5
Financial Forecast........................................................................................................................6
Profit and Loss.........................................................................................................................6
Cash Flow................................................................................................................................6
Breakeven Analysis.................................................................................................................6
Conclusion.......................................................................................................................................7
References........................................................................................................................................8
Appendix..........................................................................................................................................9
2MANAGING AND DEVLOPING INNOVATIONS
Introduction
The product designed and developed is an idea which will enable the company in creating
a new technology whereby the customers will be benefited with various types of technological
support will be supported in solving their daily operational activities. Connectivity and
technology are the two main aspect that brings together various operational work and activities
together. Various daily operations of the tasks can be better dealt with the help of the smart
phone application (Shen et al. 2018).
Discussion
Market and Customers, Market Size and Trend
The market size of this business is currently huge where the venture can explore enough
opportunity in the context of users & industry growth aspects. The service provided by the
company will be in the form of digital services in the form of mobile subscription allowing the
company to charge application fees in the form of mobile subscription fees (Aydalot and Keeble
2018).
⊘ This is a preview!⊘
Do you want full access?
Subscribe today to unlock all pages.
Trusted by 1+ million students worldwide
3MANAGING AND DEVLOPING INNOVATIONS
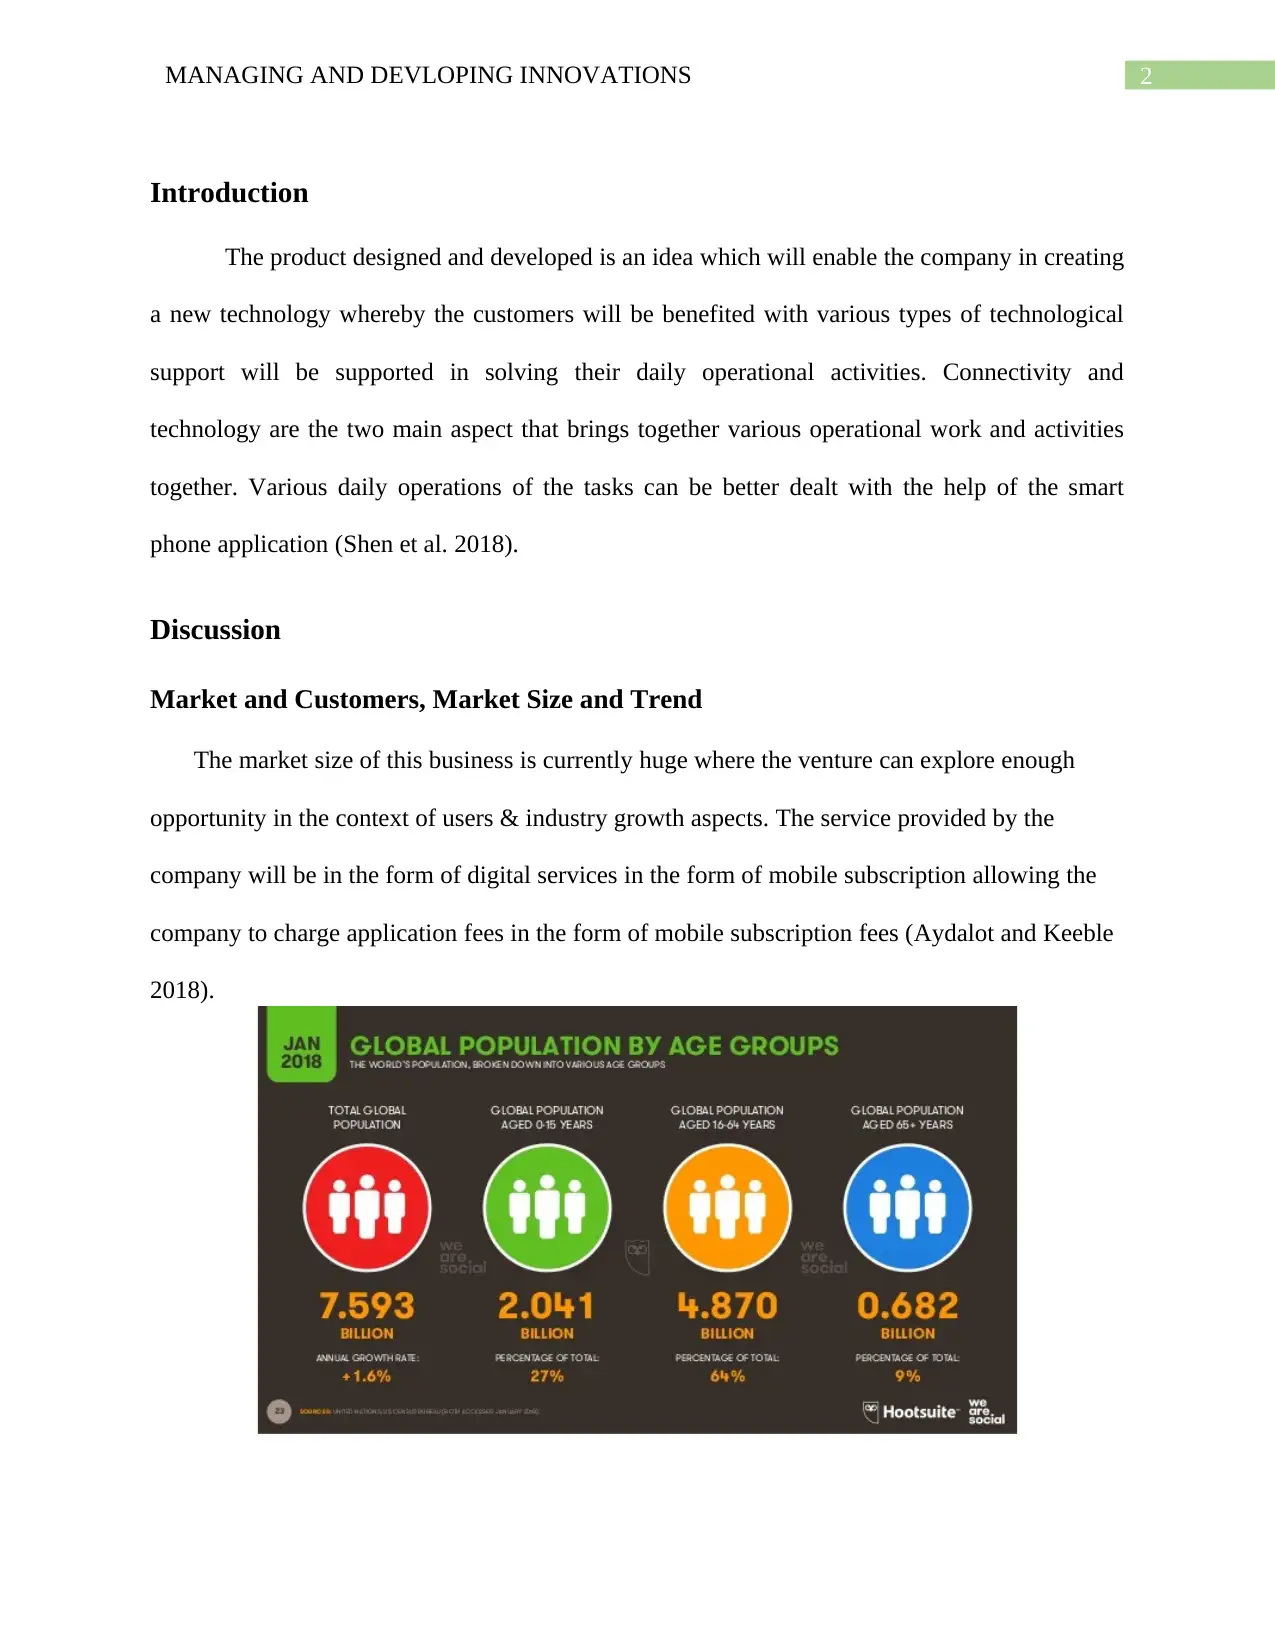
Figure 1: Global Population by Age Group
The mobile subscription growth in Australia has been around 1.8% that states around which in
contrast to the growing population of 1.3% is much consistent and attractive. In the initial stage
of operation Australia will be the primary source where the company will be conducting its
operations. The market size of the users actively using smartphones and regularly uses internet
and other technical stuffs is around 4.87 billion. The future growth rate and acceptance of the
services by the consumers will be solely dependent on the rising mobile subscription and tech-
pro customers who are happy managing the various operations and activities with the help of
tech-pro services (Rüßmann et al. 2015).
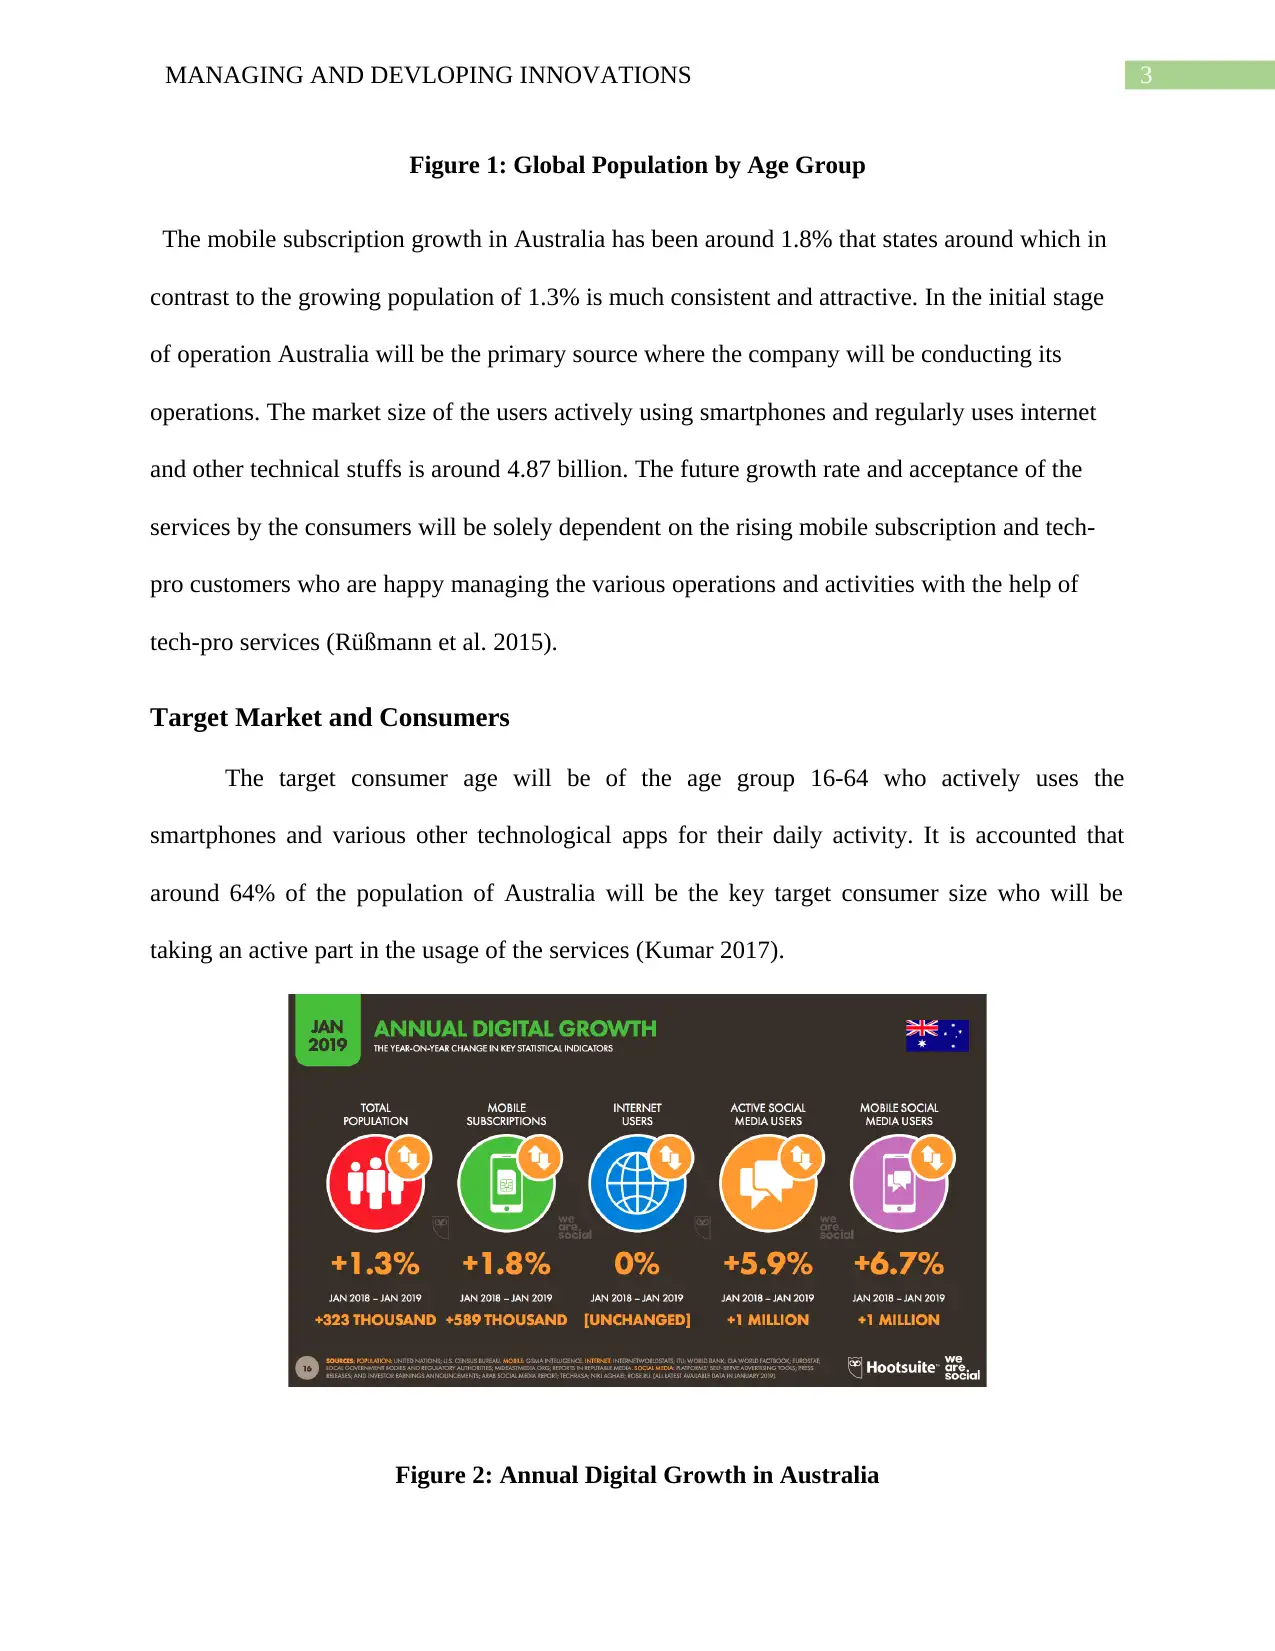
Target Market and Consumers
The target consumer age will be of the age group 16-64 who actively uses the
smartphones and various other technological apps for their daily activity. It is accounted that
around 64% of the population of Australia will be the key target consumer size who will be
taking an active part in the usage of the services (Kumar 2017).
Figure 2: Annual Digital Growth in Australia
Figure 1: Global Population by Age Group
The mobile subscription growth in Australia has been around 1.8% that states around which in
contrast to the growing population of 1.3% is much consistent and attractive. In the initial stage
of operation Australia will be the primary source where the company will be conducting its
operations. The market size of the users actively using smartphones and regularly uses internet
and other technical stuffs is around 4.87 billion. The future growth rate and acceptance of the
services by the consumers will be solely dependent on the rising mobile subscription and tech-
pro customers who are happy managing the various operations and activities with the help of
tech-pro services (Rüßmann et al. 2015).
Target Market and Consumers
The target consumer age will be of the age group 16-64 who actively uses the
smartphones and various other technological apps for their daily activity. It is accounted that
around 64% of the population of Australia will be the key target consumer size who will be
taking an active part in the usage of the services (Kumar 2017).
Figure 2: Annual Digital Growth in Australia
Paraphrase This Document
Need a fresh take? Get an instant paraphrase of this document with our AI Paraphraser
4MANAGING AND DEVLOPING INNOVATIONS
The rise and growth of the technological applications in the Australia has been
impressive and beside help with domestic grown company the company would be having easy
and better access to resources. The company will applying various marketing strategies in the
form of advertisements, various display booths for showing the operation of the service. The
annual spending on the various types of Information Technology Products (IT) Products and
services in Australia is forecasted to grow by at least 3.5% in the year 2019. On the other hand
the global growth rate in technology products and services is accounted by around 3.2%.
Competitive Analysis and Estimated Market Share
The products and services offered by the venture is completely different from other tech
products and services that are currently offered by the company. During the analysis it was found
that the company would not face any direct competition from other products and services, but
may face indirect competition from other competitors who offer tech products which are
automated in nature. These products are set-off with Artificial Intelligence Data which allows the
products and services to work in accordance with the customer’s wants and preferences (Hartley
2017).
SWOT Analysis
Strength
1) All in One Services
2) Low Cost Subscription
Weakness
1) Technical Glitch
2) Periodically Monitoring
Opportunities
1) Rising Internet and Technology
2) Improving Lifestyle Idea
Threats
1) Indirect Competition
2) Local Rules and Regulations
5MANAGING AND DEVLOPING INNOVATIONS
Porter’s Five Forces
The porter’s five forces is an important tool that can be used for identifying and
understanding the shape of the industry where the company operates. The application of porter’s
five forces was done for understanding the various aspects of the market factors as follows:
1) Threat of New Entry: The threat of new entry for the products and services of the
company offered is high as in the technological industry researching, developing and
innovating better products and services has been the key aspects (Britton 2018).
2) Threat of Substitution: The threat of substitution for the company is generally low for
the company where the offered products and services directly is not offered by other
industry rivals.
3) Bargaining Power of Suppliers: The bargaining power of suppliers would be high in
this scenario as the company will be offering or selling a differentiated products.
However, in the initial stage of business the profit margin of the business will be kept at a
very low level allowing to capture a significant market share (Walcott 2017).
4) Bargaining Power of Buyers: The bargaining power of buyers would be at a moderate
or a low level because of the differentiated products and services sold by the company.
However, with the increase in the market penetration of the services the company is
aiming at volume basis for business rather than only profit driven allowing the bargaining
power of consumer to increase.
5) Competitive Rivalries: The Company would not be facing any direct competition, but
still the technological industry various other substituted products and services whereby
the company can face competition.
⊘ This is a preview!⊘
Do you want full access?
Subscribe today to unlock all pages.
Trusted by 1+ million students worldwide
6MANAGING AND DEVLOPING INNOVATIONS
Financial Forecast
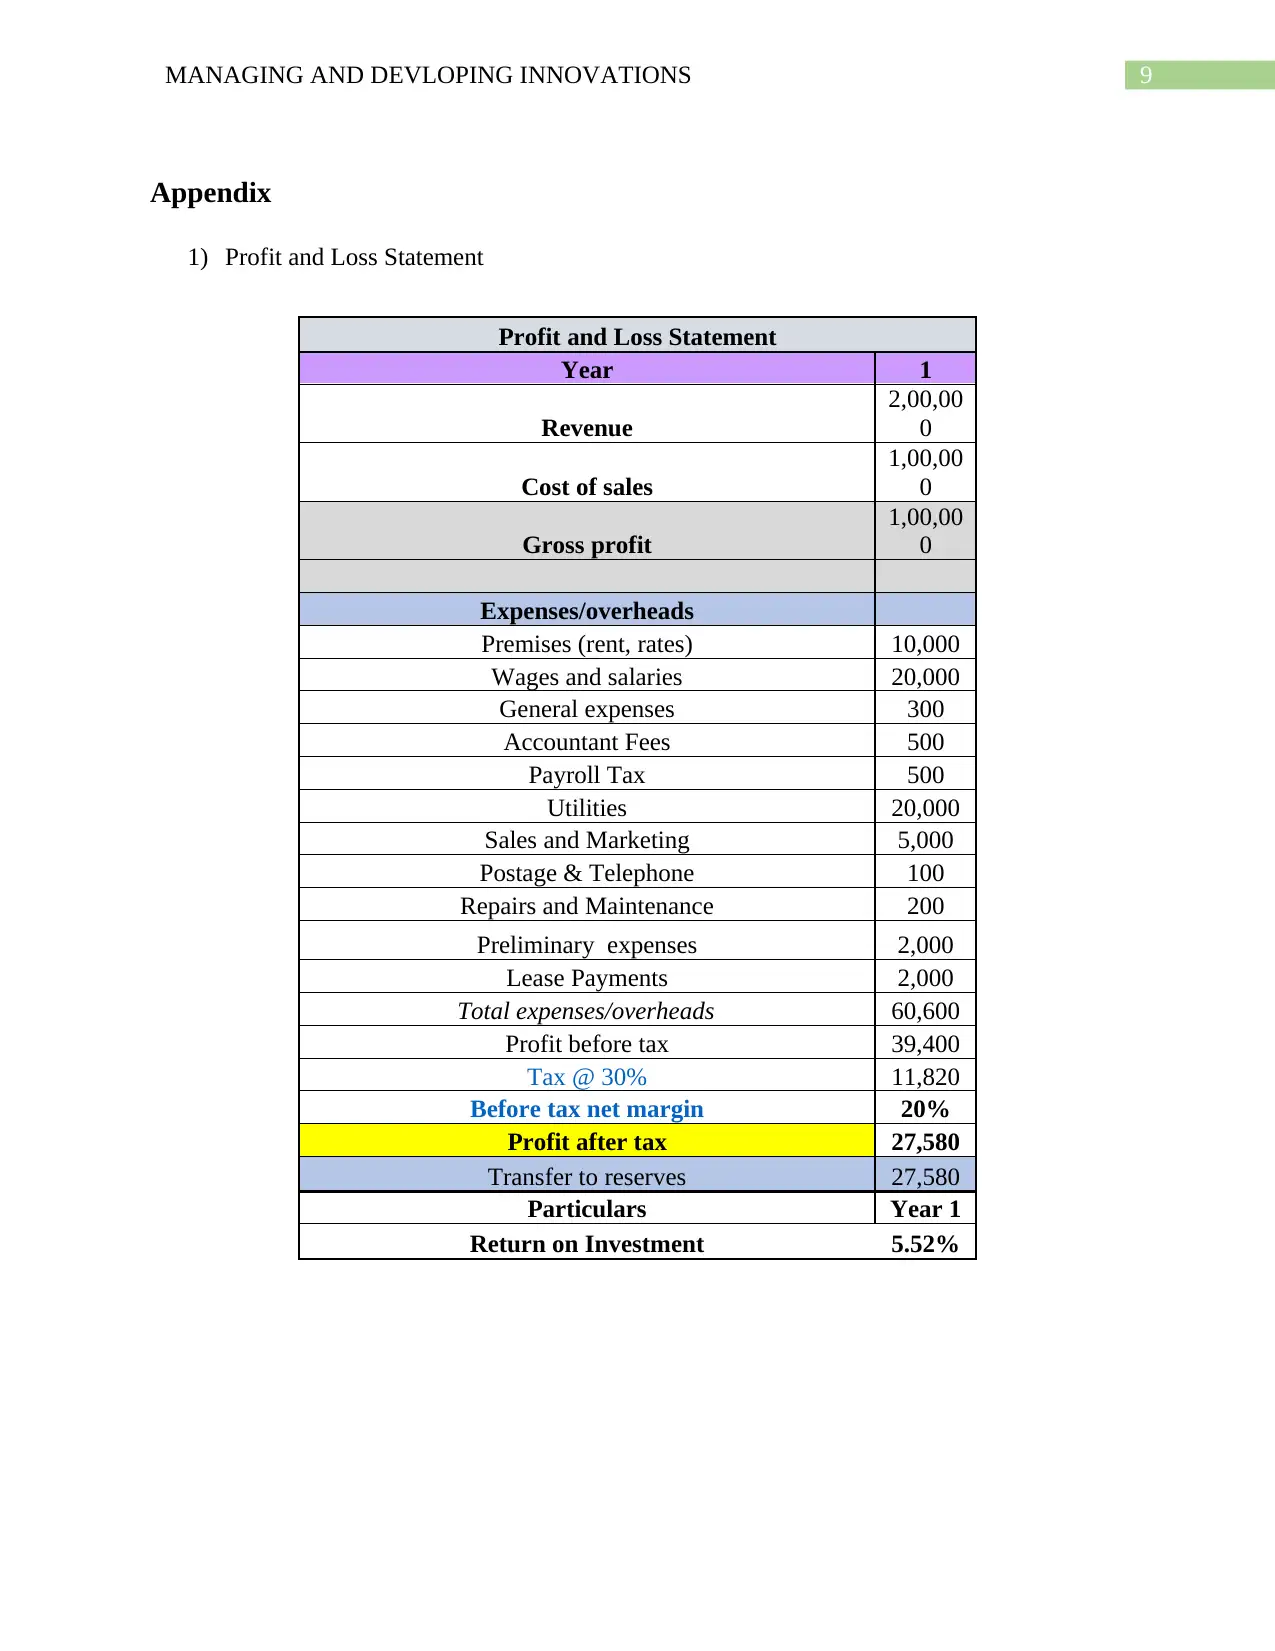
Profit and Loss
The financial forecast for the company will be prepared for a sum of two years where
major of the expenses and revenue sources of the company will be examined. In the due course
of business the funding source hat would be applied by the company would be borrowing the
sum of amount from both the equity and debt sources (Moore 2019). The operating and the
variable expenses of the company will be in accordance with the sales/revenue of the company.
The sales volume for the first year would be around 2500 customers who will be paying around
$80 for the products. Overhead expenses of the company would be around $60,600 for the first
year itself (Appendix 1).
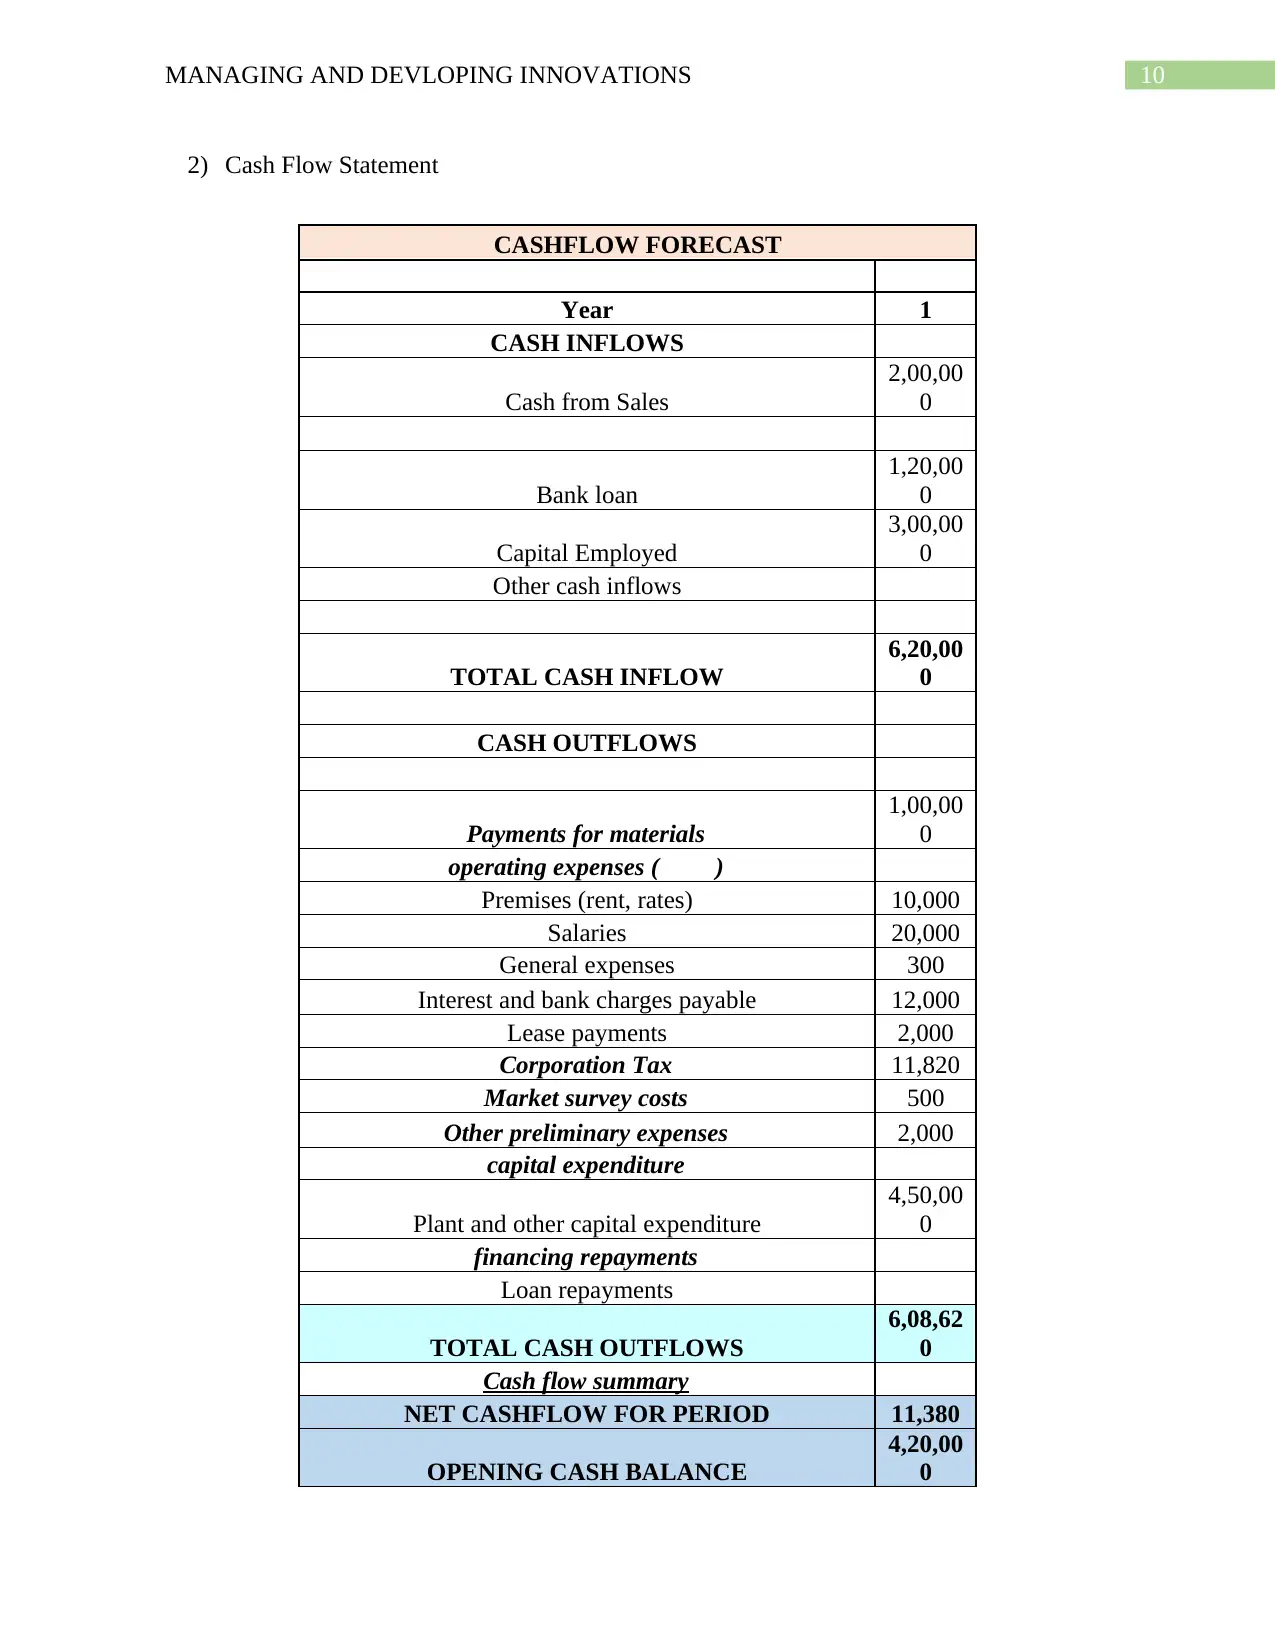
Cash Flow
In the initial set of years the major capital expenditure what the company needs to do is
on the technology application tools, patents, office building and other technical software’s and
hardware’s. The equity would be funding about 60% of the total required initial capital for the
business and debt would be funding 40% of the total required capital (Appendix 2).
Breakeven Analysis
The company if needs to be sustainable and profit has to sell around 1515 Units in
quantity so that it is at least able to cover the overhead expenses of the company.
Financial Forecast
Profit and Loss
The financial forecast for the company will be prepared for a sum of two years where
major of the expenses and revenue sources of the company will be examined. In the due course
of business the funding source hat would be applied by the company would be borrowing the
sum of amount from both the equity and debt sources (Moore 2019). The operating and the
variable expenses of the company will be in accordance with the sales/revenue of the company.
The sales volume for the first year would be around 2500 customers who will be paying around
$80 for the products. Overhead expenses of the company would be around $60,600 for the first
year itself (Appendix 1).
Cash Flow
In the initial set of years the major capital expenditure what the company needs to do is
on the technology application tools, patents, office building and other technical software’s and
hardware’s. The equity would be funding about 60% of the total required initial capital for the
business and debt would be funding 40% of the total required capital (Appendix 2).
Breakeven Analysis
The company if needs to be sustainable and profit has to sell around 1515 Units in
quantity so that it is at least able to cover the overhead expenses of the company.
Paraphrase This Document
Need a fresh take? Get an instant paraphrase of this document with our AI Paraphraser
7MANAGING AND DEVLOPING INNOVATIONS
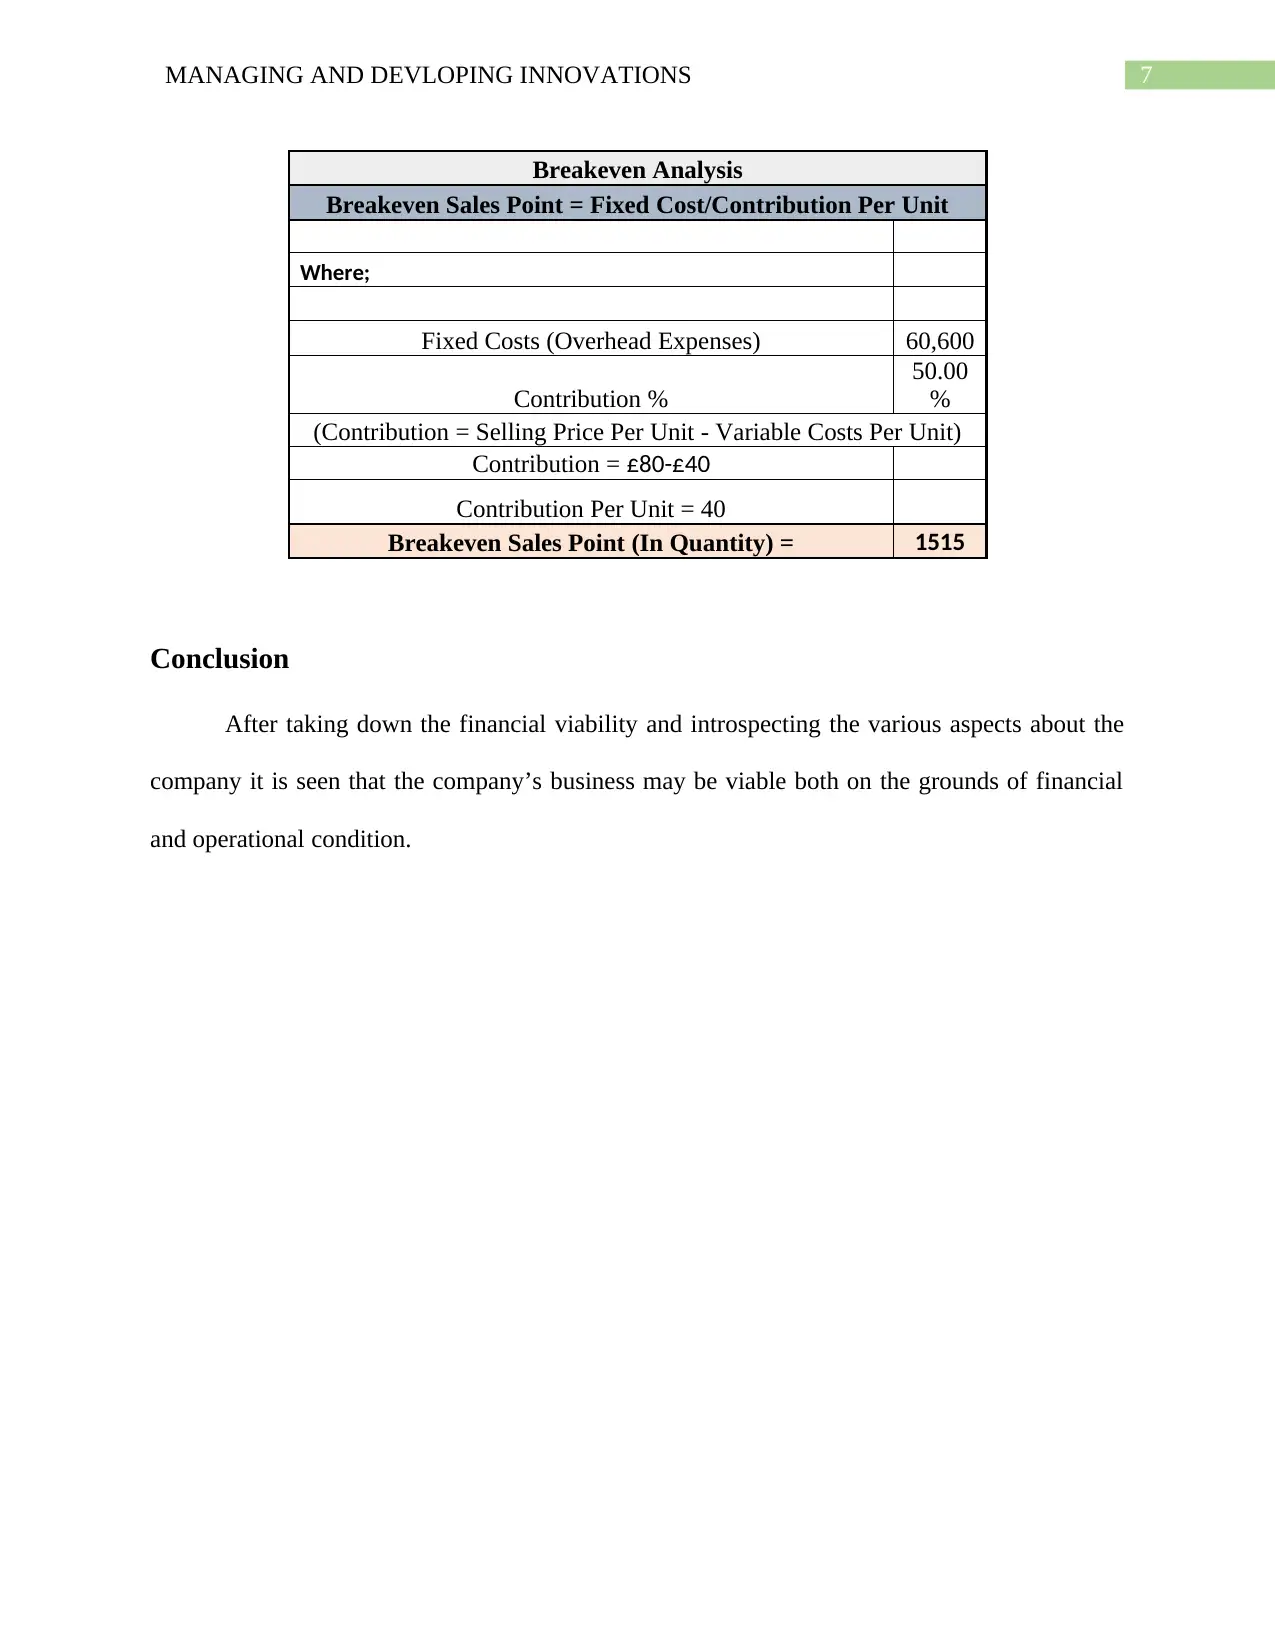
Breakeven Analysis
Breakeven Sales Point = Fixed Cost/Contribution Per Unit
Where;
Fixed Costs (Overhead Expenses) 60,600
Contribution %
50.00
%
(Contribution = Selling Price Per Unit - Variable Costs Per Unit)
Contribution = £80-£40
Contribution Per Unit = 40
Breakeven Sales Point (In Quantity) = 1515
Conclusion
After taking down the financial viability and introspecting the various aspects about the
company it is seen that the company’s business may be viable both on the grounds of financial
and operational condition.
8MANAGING AND DEVLOPING INNOVATIONS
References
Aydalot, P. and Keeble, D., 2018. High technology industry and innovative environments: the
European experience. Routledge.
Britton, J.N., 2018. High technology industry in Canada: Locational and policy issues of the
technology gap. In The Development of High Technology Industries (pp. 143-191). Routledge.
Hartley, J., 2017. From the consciousness industry to the creative industries consumer-created
content, social network markets and the growth of knowledge. In The uses of digital literacy (pp.
49-80). Routledge.
Kumar, A., 2017. Information Technology Industry. Journal of Management Science,
Operations & Strategies (e ISSN 2456-9305), 1(1), pp.12-15.
Moore, S. (2019). Gartner Forecasts. [online] Gartner. Available at:
https://www.gartner.com/en/newsroom/press-releases/2018-10-31-gartner-forecasts-it-spending-
in-australia-to-grow-3-5-percent-in-2019 [Accessed 10 Apr. 2019].
Rüßmann, M., Lorenz, M., Gerbert, P., Waldner, M., Justus, J., Engel, P. and Harnisch, M.,
2015. Industry 4.0: The future of productivity and growth in manufacturing industries. Boston
Consulting Group, 9(1), pp.54-89.
Shen, W., Tang, W., Siripanan, A., Lei, Z., Duffield, C. and Hui, F., 2018. Understanding the
Green Technical Capabilities and Barriers to Green Buildings in Developing Countries: A Case
Study of Thailand. Sustainability, 10(10), p.3585.
Walcott, S.M., 2017. Chinese science and technology industrial parks. Routledge.
⊘ This is a preview!⊘
Do you want full access?
Subscribe today to unlock all pages.
Trusted by 1+ million students worldwide
9MANAGING AND DEVLOPING INNOVATIONS
Appendix
1) Profit and Loss Statement
Profit and Loss Statement
Year 1
Revenue
2,00,00
0
Cost of sales
1,00,00
0
Gross profit
1,00,00
0
Expenses/overheads
Premises (rent, rates) 10,000
Wages and salaries 20,000
General expenses 300
Accountant Fees 500
Payroll Tax 500
Utilities 20,000
Sales and Marketing 5,000
Postage & Telephone 100
Repairs and Maintenance 200
Preliminary expenses 2,000
Lease Payments 2,000
Total expenses/overheads 60,600
Profit before tax 39,400
Tax @ 30% 11,820
Before tax net margin 20%
Profit after tax 27,580
Transfer to reserves 27,580
Particulars Year 1
Return on Investment 5.52%
Paraphrase This Document
Need a fresh take? Get an instant paraphrase of this document with our AI Paraphraser
10MANAGING AND DEVLOPING INNOVATIONS
2) Cash Flow Statement
CASHFLOW FORECAST
Year 1
CASH INFLOWS
Cash from Sales
2,00,00
0
Bank loan
1,20,00
0
Capital Employed
3,00,00
0
Other cash inflows
TOTAL CASH INFLOW
6,20,00
0
CASH OUTFLOWS
Payments for materials
1,00,00
0
operating expenses ( )
Premises (rent, rates) 10,000
Salaries 20,000
General expenses 300
Interest and bank charges payable 12,000
Lease payments 2,000
Corporation Tax 11,820
Market survey costs 500
Other preliminary expenses 2,000
capital expenditure
Plant and other capital expenditure
4,50,00
0
financing repayments
Loan repayments
TOTAL CASH OUTFLOWS
6,08,62
0
Cash flow summary
NET CASHFLOW FOR PERIOD 11,380
OPENING CASH BALANCE
4,20,00
0
11MANAGING AND DEVLOPING INNOVATIONS
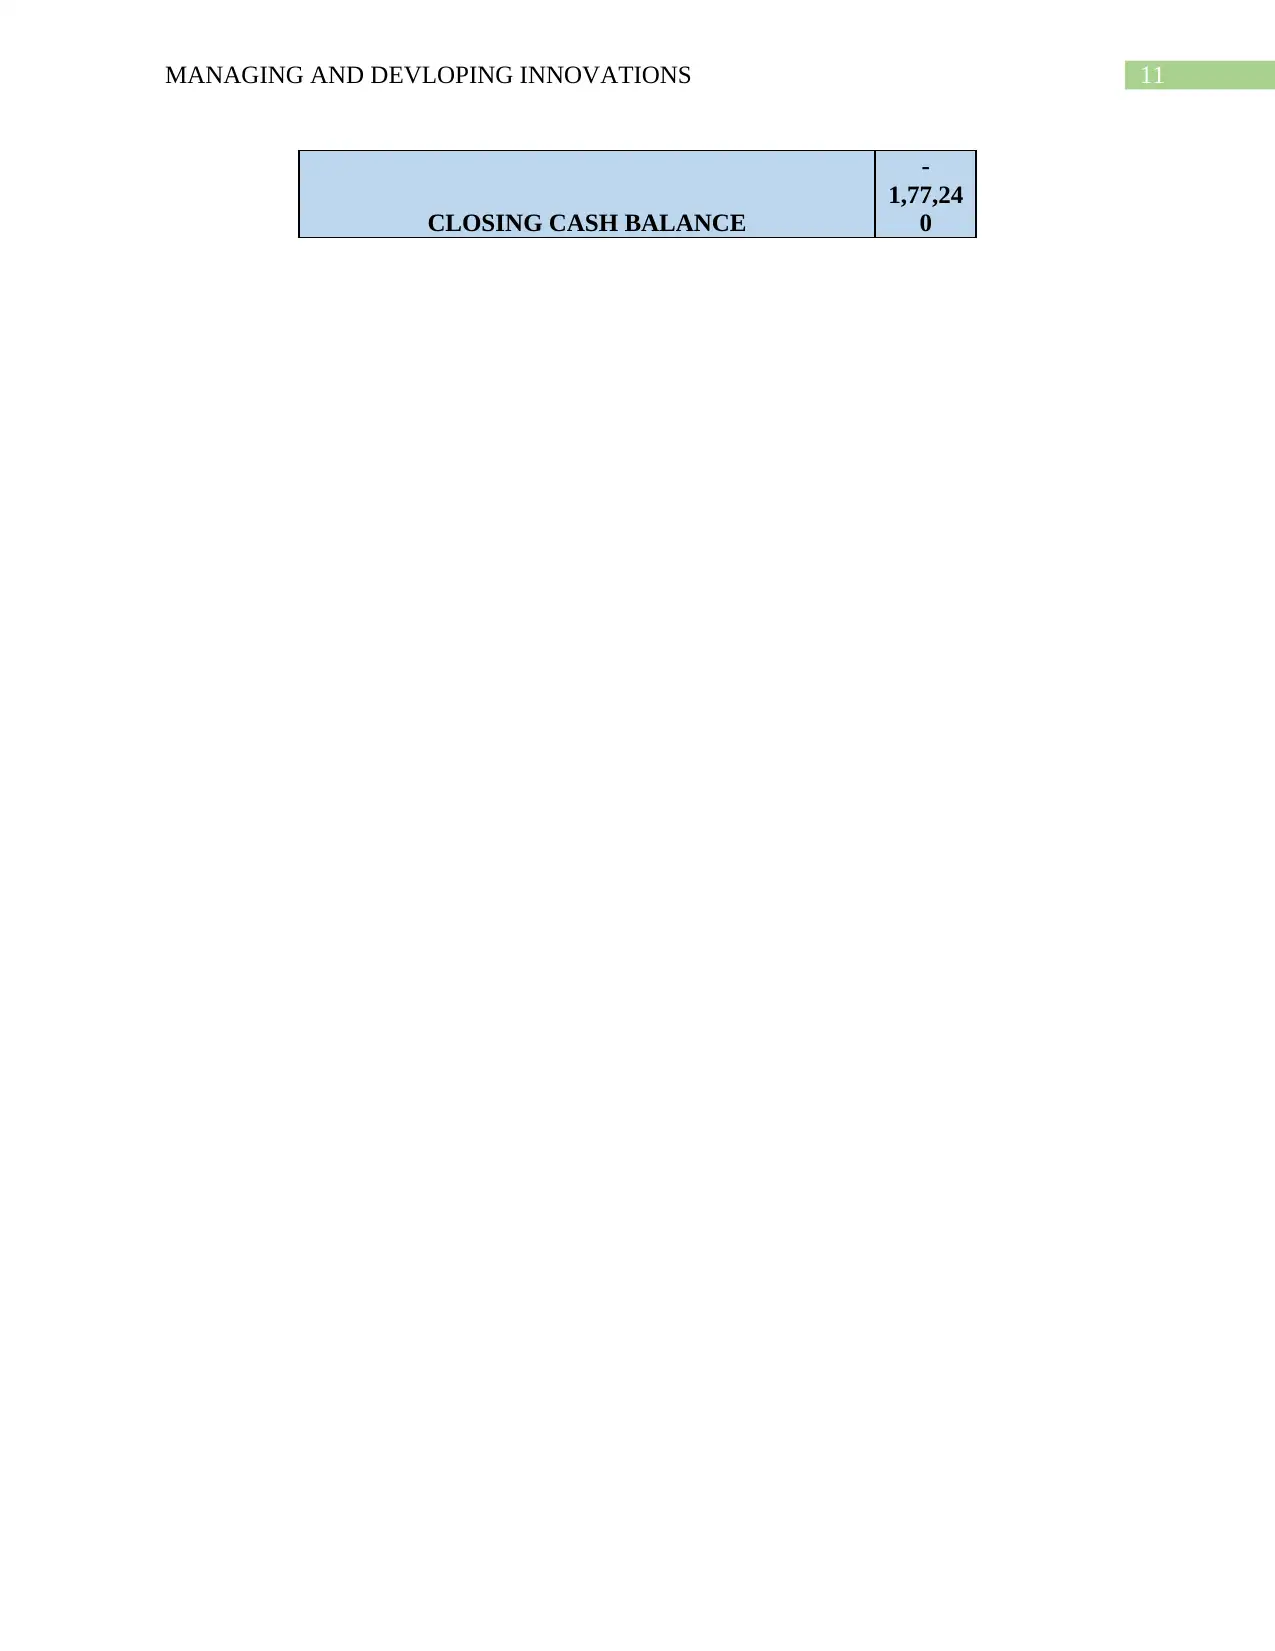
CLOSING CASH BALANCE
-
1,77,24
0
CLOSING CASH BALANCE
-
1,77,24
0
⊘ This is a preview!⊘
Do you want full access?
Subscribe today to unlock all pages.
Trusted by 1+ million students worldwide
1 out of 12
Related Documents


Your All-in-One AI-Powered Toolkit for Academic Success.
+13062052269
info@desklib.com
Available 24*7 on WhatsApp / Email
![[object Object]](/_next/static/media/star-bottom.7253800d.svg)
Unlock your academic potential
Copyright © 2020–2026 A2Z Services. All Rights Reserved. Developed and managed by ZUCOL.