INST 314 Homework 5: Weight Loss, FIFA Data, and Optimism
VerifiedAdded on 2022/09/29
|8
|1765
|36
Homework Assignment
AI Summary
This document presents the solutions to INST 314 Homework 5, a statistics assignment. The assignment covers several key areas of statistical analysis. Question 1 focuses on hypothesis testing related to weight loss and the use of the MyFitnessPal app. Question 2 involves analyzing FIFA 2017 video game data to create a mean composite scale for player kicking abilities, calculating summary statistics and confidence intervals for different football clubs. Question 3 uses the General Social Survey, examining optimism variables, creating an item scale, producing a histogram to assess normality, and calculating a confidence interval. The solutions include interpretations of the results, addressing statistical significance, variable types, and the application of R programming for data analysis and visualization. The document provides a comprehensive approach to solving the statistical problems presented in the homework assignment.

Running head: INST 314 HOMEWORK 5 1
INST 314 Homework 5
Name
Institution
INST 314 Homework 5
Name
Institution
Paraphrase This Document
Need a fresh take? Get an instant paraphrase of this document with our AI Paraphraser
INST 314 HOMEWORK 5 2
INST 314 Homework 5
Question 1
Most people don't succeed in losing weight by dieting, and on average people don't lose any
weight. Proponents of the quantized-self movement believe that by tracking eating behavior,
using apps like MyFitnessPal, people will lose more weight. Pedro randomly selected 25 people
from his university who were interested in dieting. He then had them use MyFitnessPal to track
their eating behavior. He wants to understand whether using the app leads to greater weight loss.
1a) (Must answer all correct for points on question 1a.)
i. What is Pedro’s research question?
Does using of MyFitnessPal app to track ones eating behavior lead to increased weight loss?
ii. What is the predictor (independent variable)?
Extent of using MyFitness Pal app.
iii. What is the outcome (dependent variable)?
Weight loss
iv. What kind of dependent (outcome) measure is this?
Weight is a ratio scale. A ratio scale variable is quantitative and possess a character of
origin. Weight is quantitative and can have a zero point hence is a ratio scale.
1b).What should his null and alternate hypotheses be in words and in symbols?
A hypothesis is a kind of explanation where the researcher has limited evidence and would
wasn’t to investigate (King’oriah, 2012).
Null Hypothesis: Using of MyFitnessPal app to track ones eating behavior does not lead to
increased weight loss.
Alternative Hypothesis: Using of MyFitnessPal app to track ones eating behavior lead to
increased weight loss.
H0: (μ1- μ2) = 0
INST 314 HOMEWORK 5 3
H1: (μ1- μ2) >0
1c).Would he be more likely to conclude that there is a significant effect is he uses a one -tailed
or two-tailed test?
One tailed test are used when the research question is directional and on one side
(Johnson and Bhattacharyya,2018). This give the researcher an opportunity to examine the
effects on one direction. In this case, Pedro is interested in finding out if the use of the app leads
to increased weight loss hence it is one sided. Carrying out of a one-tailed test will lead to
identification of a significant effect only if there is indeed increased weight loss. On the other
hand use of a two tailed test will detect significant differences if there is increased or decreased
weight loss hence it is more like to detect a significant effect (Fielding & Gilbert,2006).
1d) Pedro found that after 6 weeks his sample of 25 had lost an average of 2 pounds. He set an
alpha level of 0.10 at the start of the study and his p-value from the analysis is 0.12.
i. Are Pedro’s results statistically significant?
No.Since the alpha level is .10 the p value is .12.This implies that the p values is greater
than the alpha level hence the results is not significant (Gupta and Kapoor,2019).
ii. Is his group different from the rest of the population?
Despite of the weight loss of 2kgs after 6 weeks the results were not significant.
Therefore, the group is not significantly different from the population
iii. What can you conclude about MyFitnessPal and weight loss?
MyFitnessPal app was found to have an influence on the weight lost by individuals.
However, the individuals were not found to be significantly difference from the population
Do you believe Pedro’s findings to be substantively significant? (This question is not graded.)
⊘ This is a preview!⊘
Do you want full access?
Subscribe today to unlock all pages.
Trusted by 1+ million students worldwide
INST 314 HOMEWORK 5 4
Pedro’s findings have an impact. Though statistically not significant, use of a large sample size
and observation of subjects for longer periods could lead to significant results.
Question 2
Professional athletes are often judged in terms of performance on a wide variety of metrics,
which feed into a wide array of uses from fantasy leagues and gambling to AI development in
video games. We will use the Fifa 2017 video game data as a proxy for actual soccer (football)
player performance. Import the Fifa CSV file.
Mean composite scales are variables that represent a mean score built from other variables. Use
R to construct a mean composite scale that represents a player’s kicking abilities. Use the
following variables: Shot_Power, Finishing, Long_Shots, Curve, Freekick_Accuracy,
Short_Pass, and Long_Pass. Attach your new variable to the Fifa 2017 dataset. See the R setup
file for more on how to construct a mean composite scale with an example.
The following questions will have you evaluate the new kicking ability scores of all Fifa 2017
players, with those of the top and bottom ranked football clubs: FC Barcelona and Longford
Town respectively. 1 The club names are the same in the R data. You will need to use subsetting
techniques to isolate the scores for each team. You may use whichever subsetting approach you
prefer.
2a) Report summary statistics below for this new kick scale variable for all Fifa players, FC
Barcelona, and Longford Town clubs (PQ table with n, min, max, 1st & 3rd quartiles, median,
mean, and sd).
2b) Calculate a 95% confidence interval for the mean for all Fifa players, FC Barcelona, and
Longford Town. Do this by hand below and confirm your work using R. Round your answer to
2 decimal places.
What can you conclude from your confidence intervals? Not graded, be descriptive.
Question 3
1 As reported using the top and bottom non-zero average rating on https://www.futhead.com/17/clubs/?sort=-
average_rating.
Paraphrase This Document
Need a fresh take? Get an instant paraphrase of this document with our AI Paraphraser

INST 314 HOMEWORK 5 5
The General Social Survey has 6 questions that pertain to optimism. The variables are named
LOTR1, LOTR2, LOTR3, LOTR4, LOTR5, and LOTR6.
3a) What type of variables are LOTR1 through LOTR6? (Scale of measurement). Look up the
full survey question asked for one of the six LOTR variables and enter it below. Hint: This will
be easier if you use the GSS online data explorer rather than the pdf codebook.
The Likert scale is used in all the 6 variables to code qualitative data into quantitative for easier
analysis. All variables were qualitative in nature but responses measured on a scale. Therefore
optimism variables are of interval scale.
LOTR1- This variable has an interval scale.
LOTR2- This variable has an interval scale.
LOTR3- This variable has an interval scale.
LOTR4- This variable has an interval scale.
LOTR5- This variable has an interval scale.
LOTR6- This variable has an interval scale.
3b) Use the R code from the setup file to create an item scale, which allows us to do quantitative
analysis on it. The new variable will be called LOTR.scale. Examine the setup code to learn
more about how we constructed this new variable.
Using a PQ table, report the n, min, max, 1st & 3rd quartiles, median, mean, and sd.
LOTR.scale
nobs 2867.000000
NAs 1426.000000
Minimum 1.000000
Maximum 24.000000
1. Quartile 12.000000
3. Quartile 15.000000
Mean 13.821652
Median 13.000000
Sum 19917.000000
SE Mean 0.070266
LCL Mean 13.683817
UCL Mean 13.959487
Variance 7.114698
Stdev 2.667339
Skewness 0.330238
Kurtosis 1.382076
INST 314 HOMEWORK 5 6
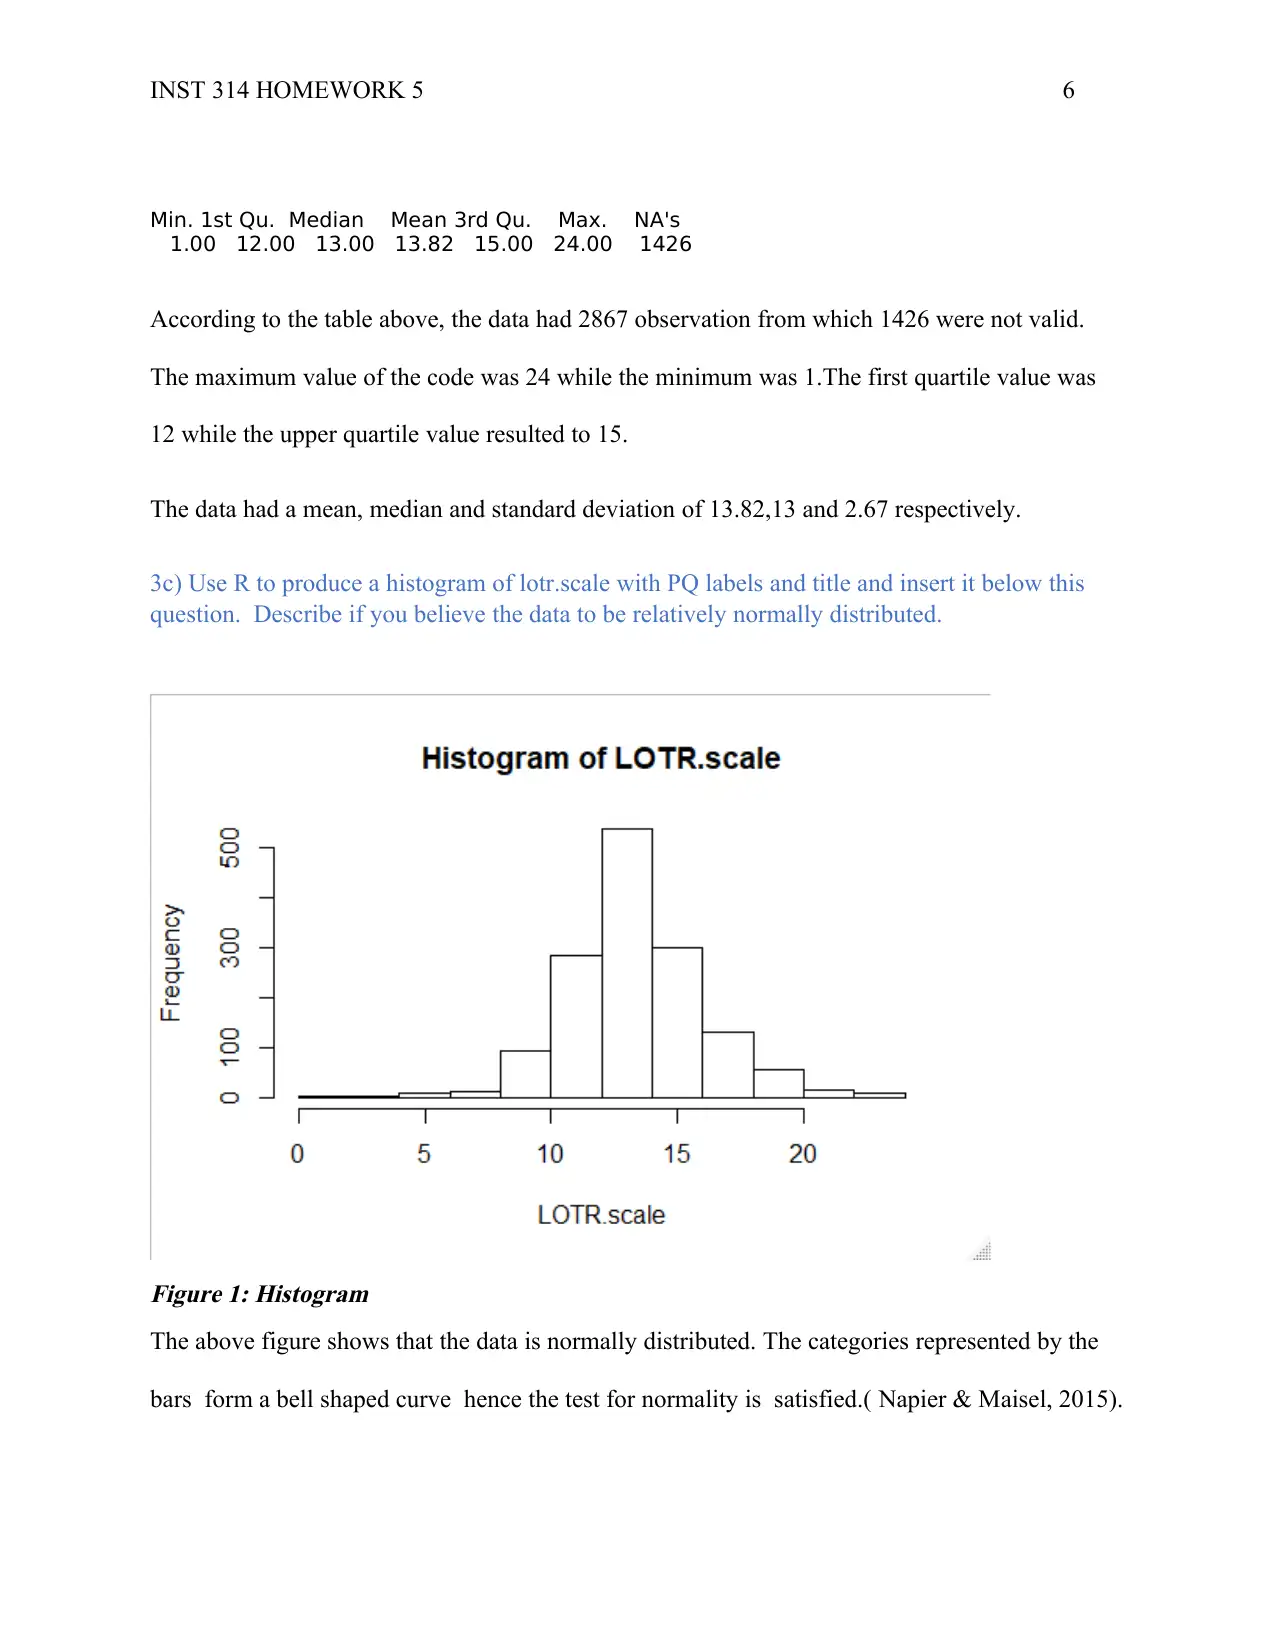
Min. 1st Qu. Median Mean 3rd Qu. Max. NA's
1.00 12.00 13.00 13.82 15.00 24.00 1426
According to the table above, the data had 2867 observation from which 1426 were not valid.
The maximum value of the code was 24 while the minimum was 1.The first quartile value was
12 while the upper quartile value resulted to 15.
The data had a mean, median and standard deviation of 13.82,13 and 2.67 respectively.
3c) Use R to produce a histogram of lotr.scale with PQ labels and title and insert it below this
question. Describe if you believe the data to be relatively normally distributed.
Figure 1: Histogram
The above figure shows that the data is normally distributed. The categories represented by the
bars form a bell shaped curve hence the test for normality is satisfied.( Napier & Maisel, 2015).
⊘ This is a preview!⊘
Do you want full access?
Subscribe today to unlock all pages.
Trusted by 1+ million students worldwide
INST 314 HOMEWORK 5 7
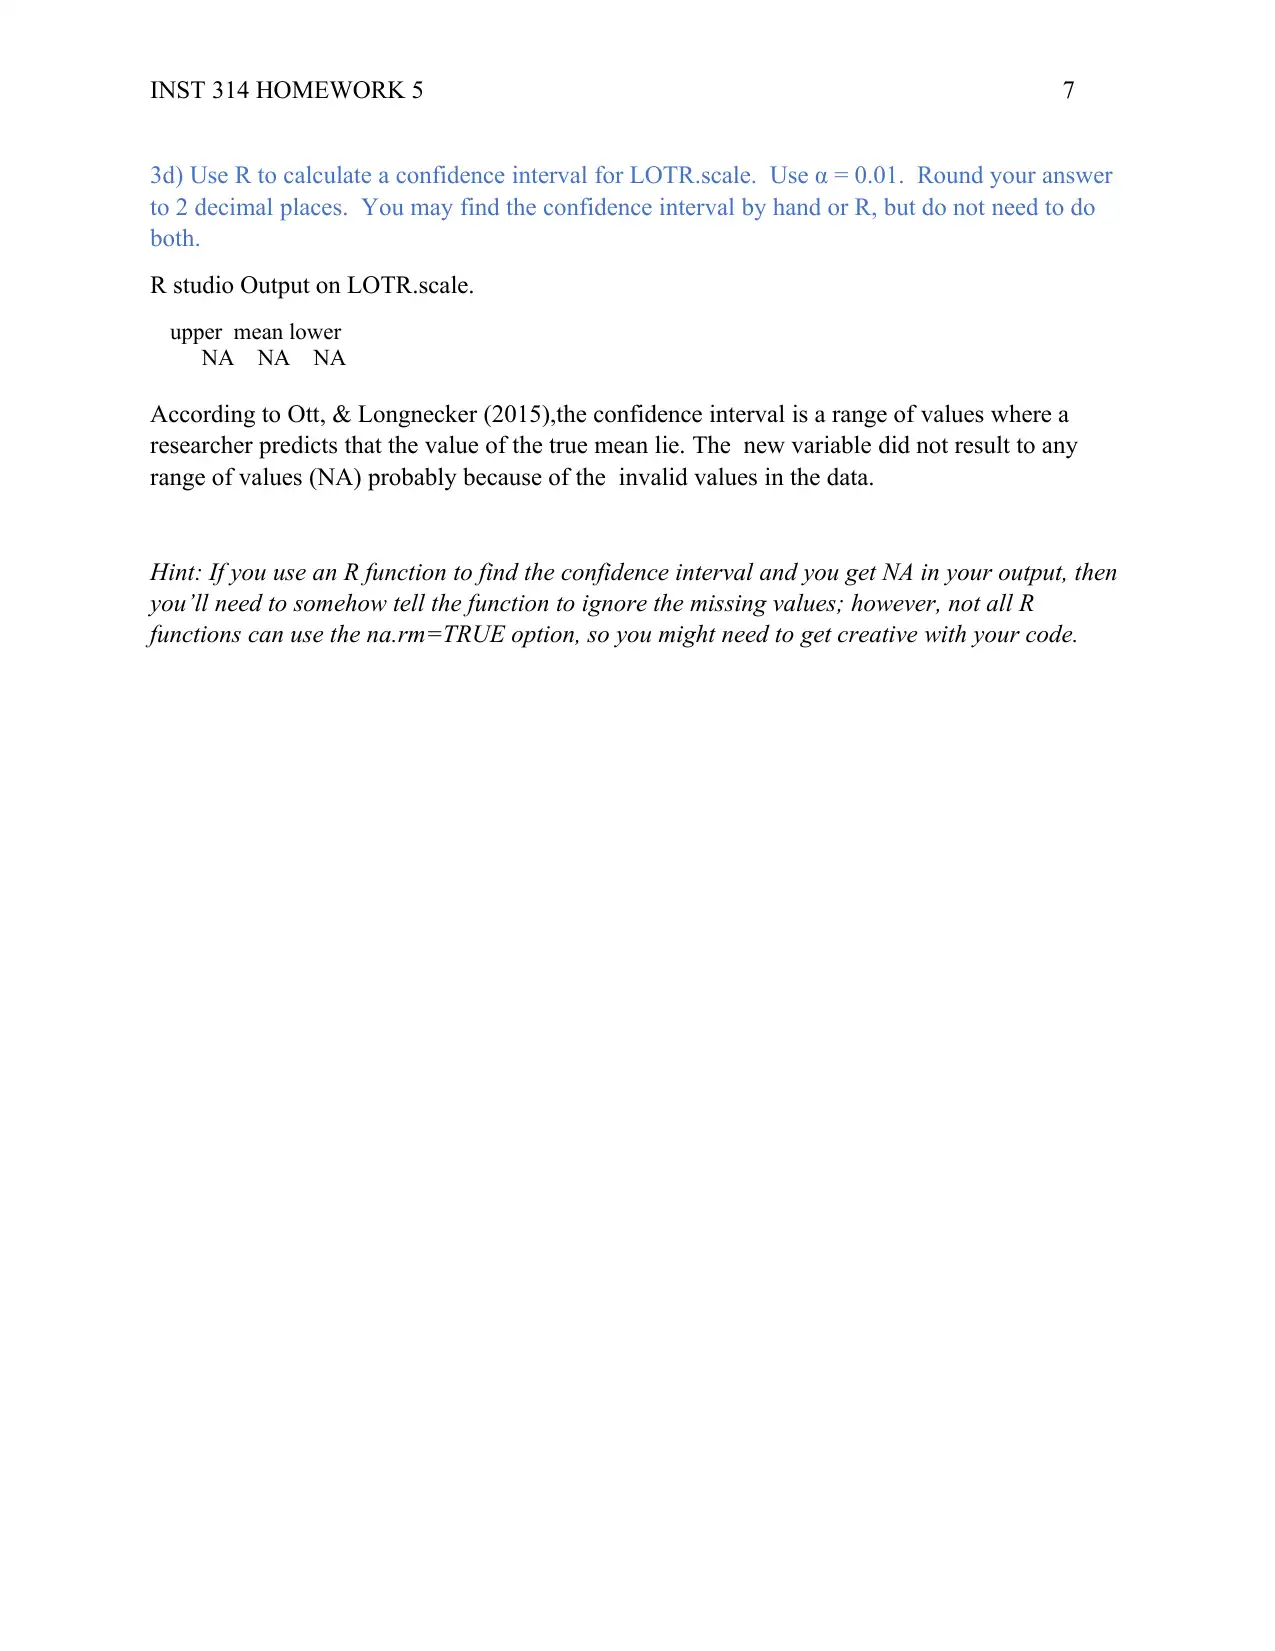
3d) Use R to calculate a confidence interval for LOTR.scale. Use α = 0.01. Round your answer
to 2 decimal places. You may find the confidence interval by hand or R, but do not need to do
both.
R studio Output on LOTR.scale.
upper mean lower
NA NA NA
According to Ott, & Longnecker (2015),the confidence interval is a range of values where a
researcher predicts that the value of the true mean lie. The new variable did not result to any
range of values (NA) probably because of the invalid values in the data.
Hint: If you use an R function to find the confidence interval and you get NA in your output, then
you’ll need to somehow tell the function to ignore the missing values; however, not all R
functions can use the na.rm=TRUE option, so you might need to get creative with your code.
Paraphrase This Document
Need a fresh take? Get an instant paraphrase of this document with our AI Paraphraser
INST 314 HOMEWORK 5 8
References
Gupta, S. C., & Kapoor, V. K. (2019). Fundamentals of applied statistics. Sulthan Chand &
Sons.
Johnson, R.A. & Bhattacharyya, G.K.,(2018). Statistics: principles and methods. Wiley.
King'oriah, G. K.(2012).Fundamentals of applied statistics. Nairobi: The Jomo Kenyatta
Foundation.
Napier, C., & Maisel, J. W (2015). Principles and Procedures of Statistics: a Biometric
Approach. McGraw Hill Book Company, New York.
Fielding, J., Gilbert, N., & Gilbert, G. N. (2006). Understanding social statistics. California:
SAGE Publications.
Ott, R. L., & Longnecker, M. T. (2015). An introduction to statistical methods and data analysis.
Nelson Education.
1 out of 8
Your All-in-One AI-Powered Toolkit for Academic Success.
+13062052269
info@desklib.com
Available 24*7 on WhatsApp / Email
![[object Object]](/_next/static/media/star-bottom.7253800d.svg)
Unlock your academic potential
Copyright © 2020–2026 A2Z Services. All Rights Reserved. Developed and managed by ZUCOL.