Financial Performance: Weekly Budget, Cash Flow, and Graph Analysis

Verified

Added on  2023/01/10

|5
|606
|79
Report
AI Summary
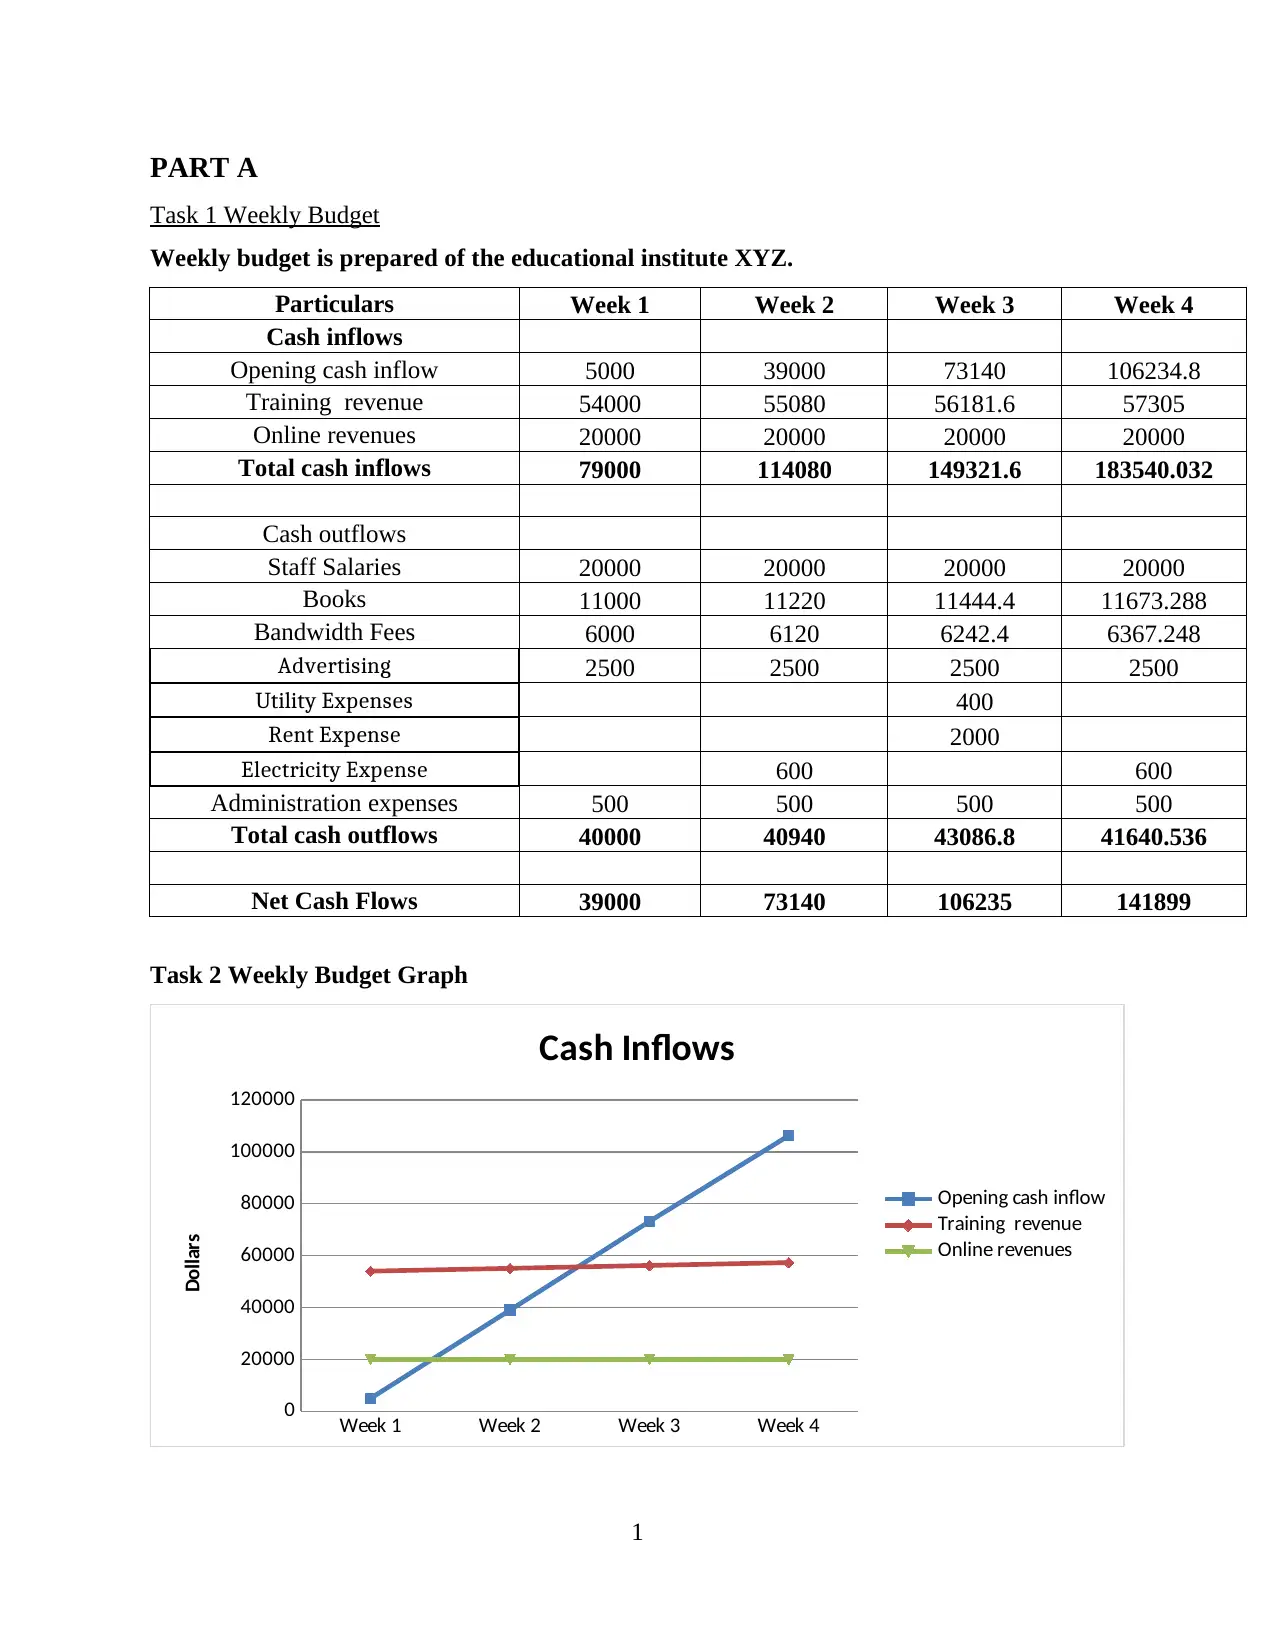
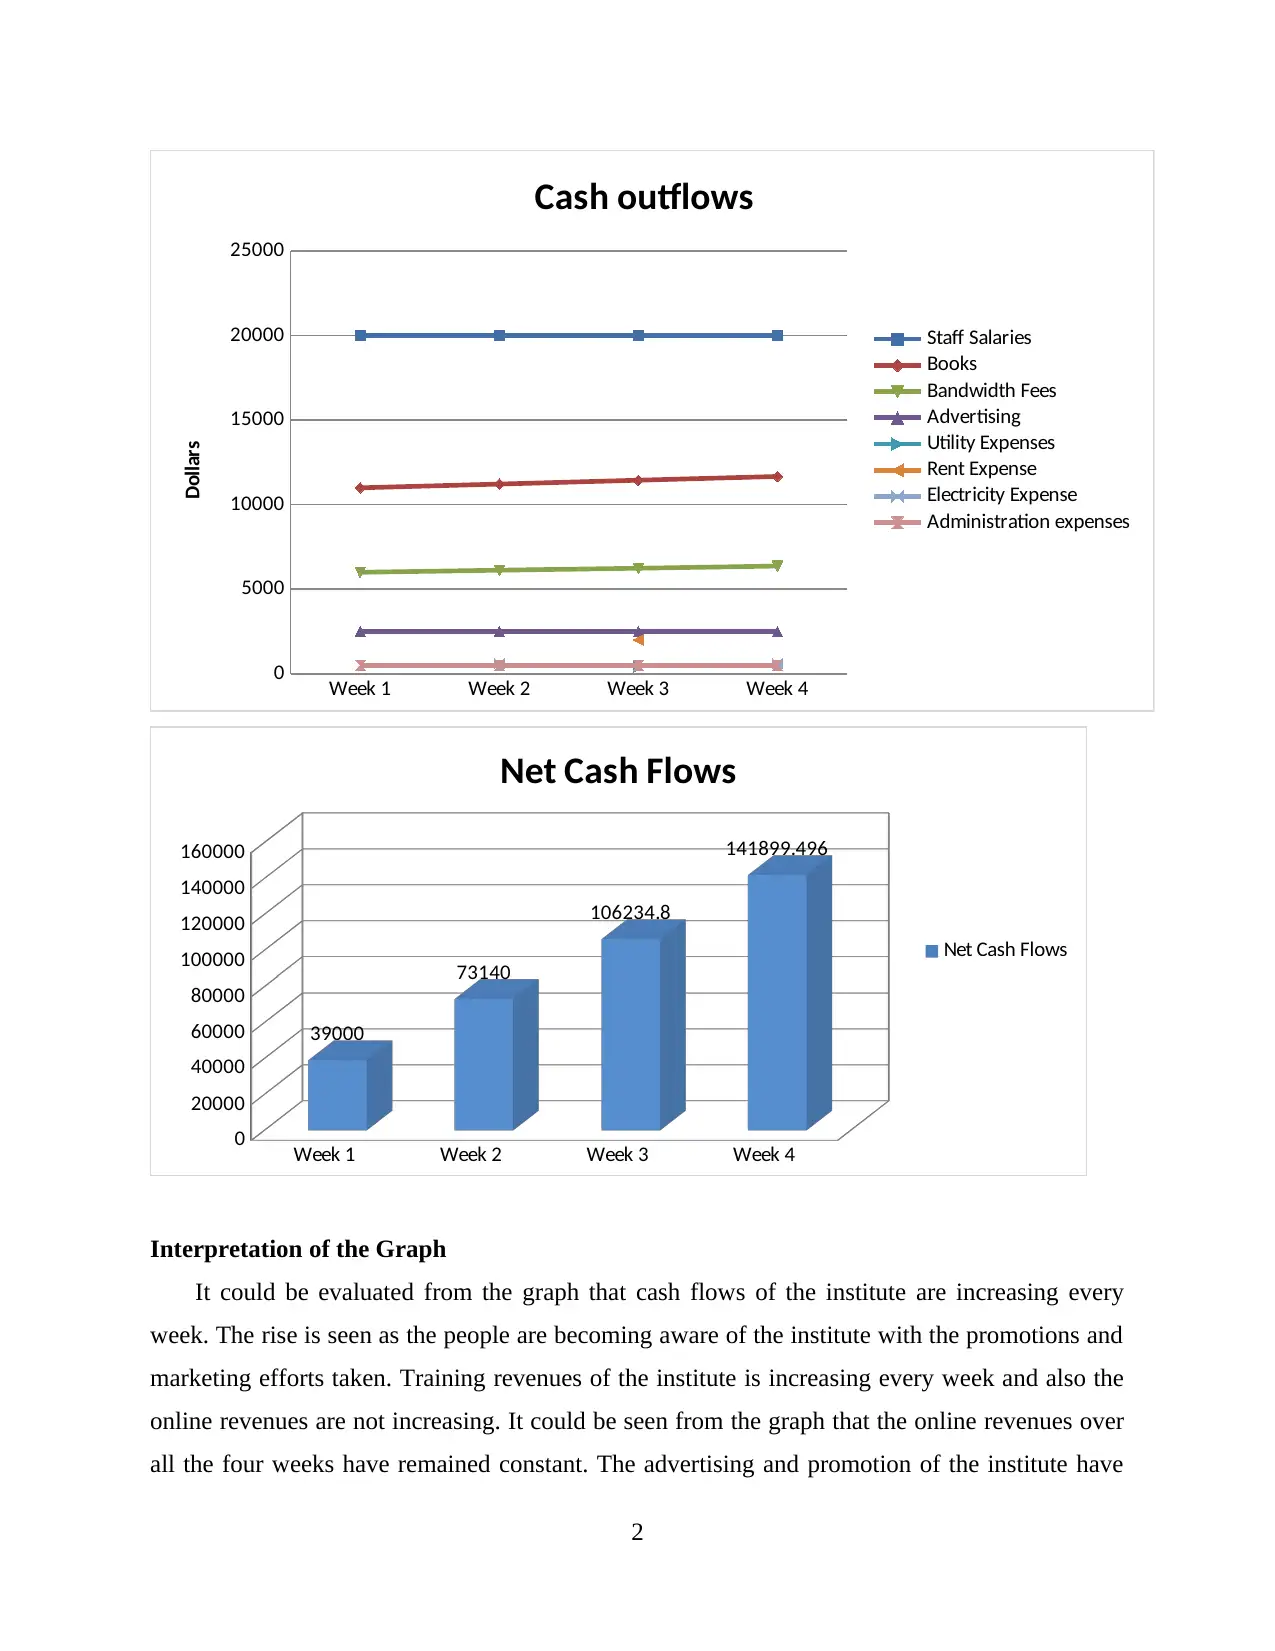
This individual research report presents a detailed weekly budget analysis for an educational institute, XYZ. The report includes a comprehensive breakdown of cash inflows, such as opening cash, training revenue, and online revenues, across four weeks. It contrasts these inflows with cash outflows, covering expenses like staff salaries, books, bandwidth fees, advertising, utilities, rent, and administration. The report utilizes tables and graphs to visualize the financial data, illustrating trends in revenue and expenditure. Interpretation of the graphs highlights increasing cash flows due to effective marketing and revenue generation. The analysis also discusses the impact of seasonal variations, such as school vacations, on the institute's finances. Furthermore, it evaluates the management's control over costs, the impact of fixed and variable costs, and the efficiency of resource allocation. The report concludes with an assessment of net cash flows, demonstrating the institute's financial health and growth.
tabler-icon-diamond-filled.svg

Contribute Materials

Your contribution can guide someone’s learning journey. Share your documents today.
Document Page
INDIVIDUAL RESEARCH
REPORT
tabler-icon-diamond-filled.svg

Secure Best Marks with AI Grader

Need help grading? Try our AI Grader for instant feedback on your assignments.
Document Page
TABLE OF CONTENTS
TABLE OF CONTENTS................................................................................................................2
PART A...........................................................................................................................................1
Task 1 Weekly Budget.................................................................................................................1
REFERENCES................................................................................................................................4
Document Page
PART A
Task 1 Weekly Budget
Weekly budget is prepared of the educational institute XYZ.
Particulars Week 1 Week 2 Week 3 Week 4
Cash inflows
Opening cash inflow 5000 39000 73140 106234.8
Training revenue 54000 55080 56181.6 57305
Online revenues 20000 20000 20000 20000
Total cash inflows 79000 114080 149321.6 183540.032
Cash outflows
Staff Salaries 20000 20000 20000 20000
Books 11000 11220 11444.4 11673.288
Bandwidth Fees 6000 6120 6242.4 6367.248
Advertising 2500 2500 2500 2500
Utility Expenses 400
Rent Expense 2000
Electricity Expense 600 600
Administration expenses 500 500 500 500
Total cash outflows 40000 40940 43086.8 41640.536
Net Cash Flows 39000 73140 106235 141899
Task 2 Weekly Budget Graph
Week 1 Week 2 Week 3 Week 4
0
20000
40000
60000
80000
100000
120000
Cash Inflows
Opening cash inflow
Training revenue
Online revenues
Dollars
1
Document Page
Week 1 Week 2 Week 3 Week 4
0
5000
10000
15000
20000
25000
Cash outflows
Staff Salaries
Books
Bandwidth Fees
Advertising
Utility Expenses
Rent Expense
Electricity Expense
Administration expenses
Dollars
Week 1 Week 2 Week 3 Week 4
0
20000
40000
60000
80000
100000
120000
140000
160000
39000
73140
106234.8
141899.496
Net Cash Flows
Net Cash Flows
Interpretation of the Graph
It could be evaluated from the graph that cash flows of the institute are increasing every
week. The rise is seen as the people are becoming aware of the institute with the promotions and
marketing efforts taken. Training revenues of the institute is increasing every week and also the
online revenues are not increasing. It could be seen from the graph that the online revenues over
all the four weeks have remained constant. The advertising and promotion of the institute have
2
tabler-icon-diamond-filled.svg

Secure Best Marks with AI Grader

Need help grading? Try our AI Grader for instant feedback on your assignments.
Document Page
enabled the institute to increase its share. The cash flows and revenes will decrease from next
month as the school and colleges will be closed for vacation and students will join the classes
after 2 months. It could also be states as off season for the institutes as the students at this time
are considerably low. Constant increase in the cash flow shows that it is making effective
utilisation of the resources to generate revenues.
Graph of the cash outflows shows that it has maintained strict control over the costs to
generate higher revenues and cash inflows. Salaries of the staff are considered as fixed cost and
therefore have remained constant for the period of four weeks. With the increase of students cost
of books is increasing and is recognised as variable cost. Bandwidth fees is paid for the online
classes provided by the institute over locations outside locality to the students that are residing in
other cities or rural areas. It is paying utility expenses for the period in week 3 of every month. it
covers all the costs for running business. Rent expenses are also paid every month in week 3
which is irregular payment. Electricity expenses of the institute are paid in alternative weeks.
Administration expenses are also fixed and are paid every week by the institute. Total cash
outflows of institute are not increasing with the same proportion of revenues. it has maintained
effective control over the cost is maintained.
Graph of Net cash flows shows that the cash flows of the institute are increasing with the
constant speed. It means the management is efficiently managing resources for increasing returns
and generating cash inflows.
3
chevron_up_icon
1 out of 5
circle_padding
hide_on_mobile
zoom_out_icon
logo.png

Your All-in-One AI-Powered Toolkit for Academic Success.

Available 24*7 on WhatsApp / Email

[object Object]