IAG Financial Performance: Ratio Analysis and Trend Evaluation
VerifiedAdded on 2021/04/17
|11
|2730
|54
Report
AI Summary
This report provides a comprehensive financial analysis of Insurance Australia Group Limited (IAG). It begins with an abstract summarizing the company's history and current position in the Australian insurance market. The introduction emphasizes the importance of financial statement analysis for assessing a company's health. The report calculates and analyzes key financial ratios for 2016 and 2017, including profitability (net profit margin, return on assets, return on equity, gross profit margin, and earnings per share) and liquidity ratios (current, quick, operating cash flow, asset efficiency, current liability coverage, long-term debt coverage, and cash generating power). The analysis reveals positive trends in profitability and asset utilization, with improvements in net profit margin, return on assets, and return on equity. The report also examines the company's competitors, including Westpac Banking Corporation, Commonwealth Bank Limited, and Suncorp, and analyzes IAG's corporate governance practices, highlighting compliance with the ASX Corporate Governance Council principles. The conclusion summarizes the findings and overall financial performance of IAG.

INSURANCE AUSTRALIA GROUP LIMITED
Student Name :
Student ID :
9/5/2018
Student Name :
Student ID :
9/5/2018
Paraphrase This Document
Need a fresh take? Get an instant paraphrase of this document with our AI Paraphraser
Contents
ABSTRACT....................................................................................................................................................2
INTRODUCTION...........................................................................................................................................3
CALCULATION OF FINANCIAL RATIOS..........................................................................................................3
ANALYSIS OF RATIOS AND ITS RELATED TRENDS.........................................................................................6
COMPANY AND ITS COMPETITORS..............................................................................................................8
ANALYSIS OF THE CORPORATE GOVERNANCE.............................................................................................9
Board’s Role.............................................................................................................................................9
Ethical and Responsible decision making..............................................................................................10
CONCLUSION.............................................................................................................................................10
REFERENCES..............................................................................................................................................10
ABSTRACT
The company that has been provided is Insurance Australia Group Limited and it belongs to the
group of financing industry. The company has its roots beginning from the year of nineteen
hundred and twenty five when it was working in the form of association under the trade name of
National Roads and Motorists Association. Through this association the company was providing
the facilities related to insurance only to its member and in the year of nineteen hundred and
eighty one it has been regarded as largest insurance service provider and in the year of 1995, the
company has started its expansion outside the operating state and opened their offices in Victoria
and moves to Queensland. In the year of 2000, the association status has been waived and the
new company – NRMA Insurance Group Limited has been formed and later in the year of 2002
the name has been changed to Insurance Australia Group Limited and in the today’s world, the
company is leading the business in the Insurance sector in Australia. It is working across
Australia, Asia and New Zealand. The company is constantly working for providing better
insurance facilities to the customers and giving maximum returns to their stakeholders.
2
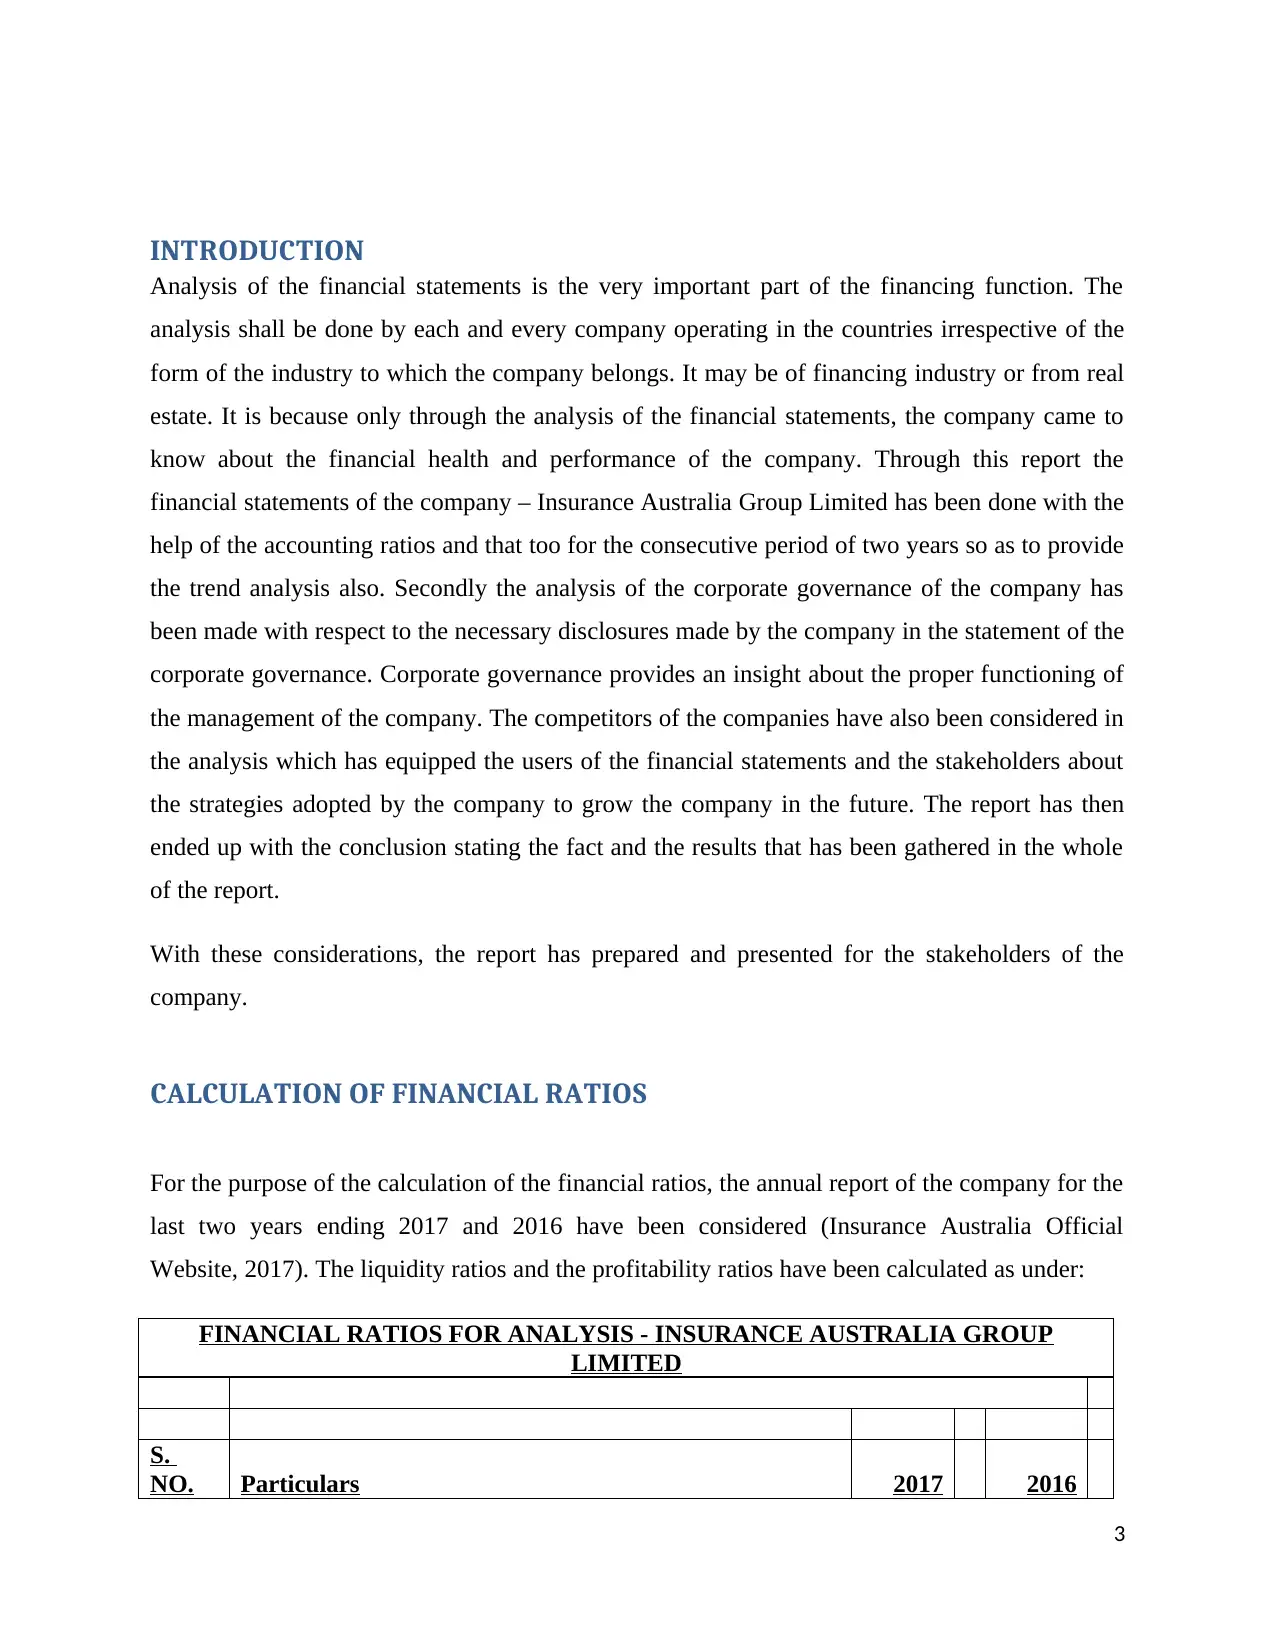
INTRODUCTION
Analysis of the financial statements is the very important part of the financing function. The
analysis shall be done by each and every company operating in the countries irrespective of the
form of the industry to which the company belongs. It may be of financing industry or from real
estate. It is because only through the analysis of the financial statements, the company came to
know about the financial health and performance of the company. Through this report the
financial statements of the company – Insurance Australia Group Limited has been done with the
help of the accounting ratios and that too for the consecutive period of two years so as to provide
the trend analysis also. Secondly the analysis of the corporate governance of the company has
been made with respect to the necessary disclosures made by the company in the statement of the
corporate governance. Corporate governance provides an insight about the proper functioning of
the management of the company. The competitors of the companies have also been considered in
the analysis which has equipped the users of the financial statements and the stakeholders about
the strategies adopted by the company to grow the company in the future. The report has then
ended up with the conclusion stating the fact and the results that has been gathered in the whole
of the report.
With these considerations, the report has prepared and presented for the stakeholders of the
company.
CALCULATION OF FINANCIAL RATIOS
For the purpose of the calculation of the financial ratios, the annual report of the company for the
last two years ending 2017 and 2016 have been considered (Insurance Australia Official
Website, 2017). The liquidity ratios and the profitability ratios have been calculated as under:
FINANCIAL RATIOS FOR ANALYSIS - INSURANCE AUSTRALIA GROUP
LIMITED
S.
NO. Particulars 2017 2016
3
⊘ This is a preview!⊘
Do you want full access?
Subscribe today to unlock all pages.
Trusted by 1+ million students worldwide
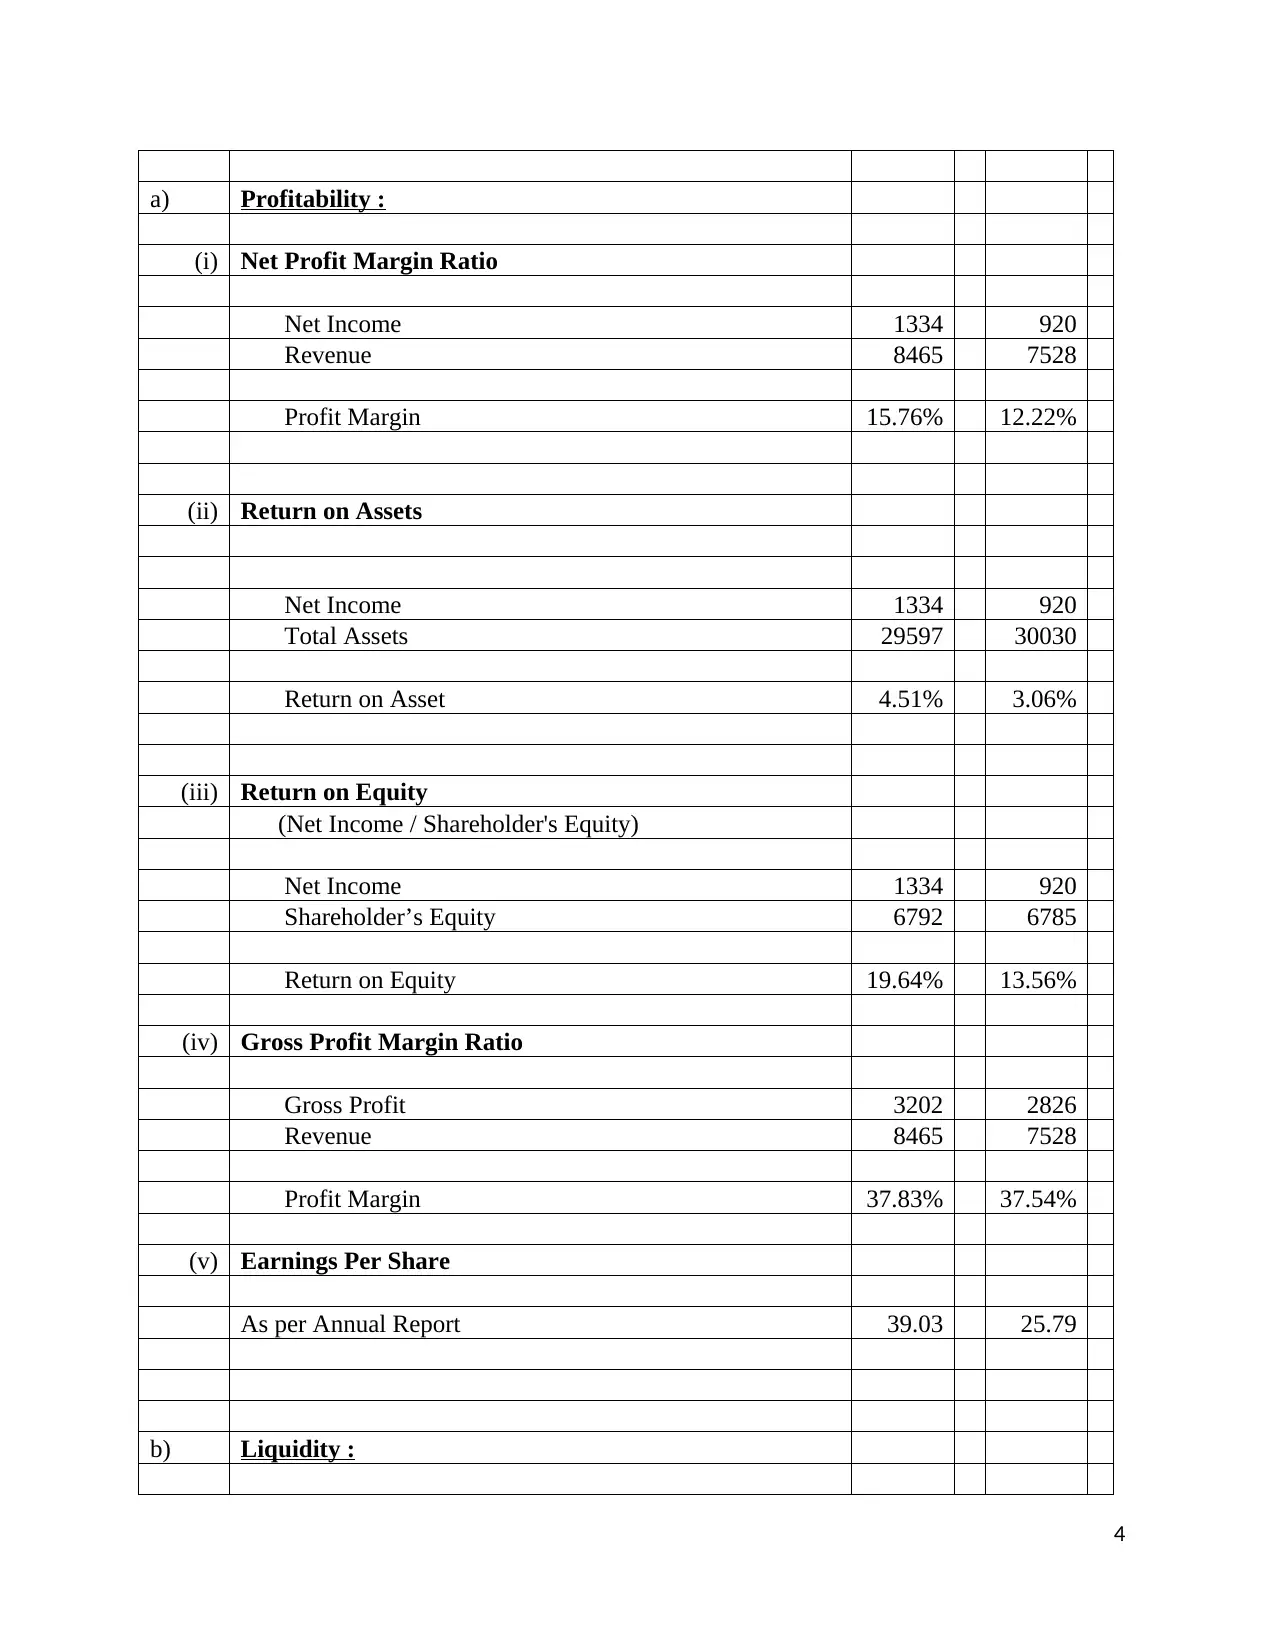
a) Profitability :
(i) Net Profit Margin Ratio
Net Income 1334 920
Revenue 8465 7528
Profit Margin 15.76% 12.22%
(ii) Return on Assets
Net Income 1334 920
Total Assets 29597 30030
Return on Asset 4.51% 3.06%
(iii) Return on Equity
(Net Income / Shareholder's Equity)
Net Income 1334 920
Shareholder’s Equity 6792 6785
Return on Equity 19.64% 13.56%
(iv) Gross Profit Margin Ratio
Gross Profit 3202 2826
Revenue 8465 7528
Profit Margin 37.83% 37.54%
(v) Earnings Per Share
As per Annual Report 39.03 25.79
b) Liquidity :
4
Paraphrase This Document
Need a fresh take? Get an instant paraphrase of this document with our AI Paraphraser
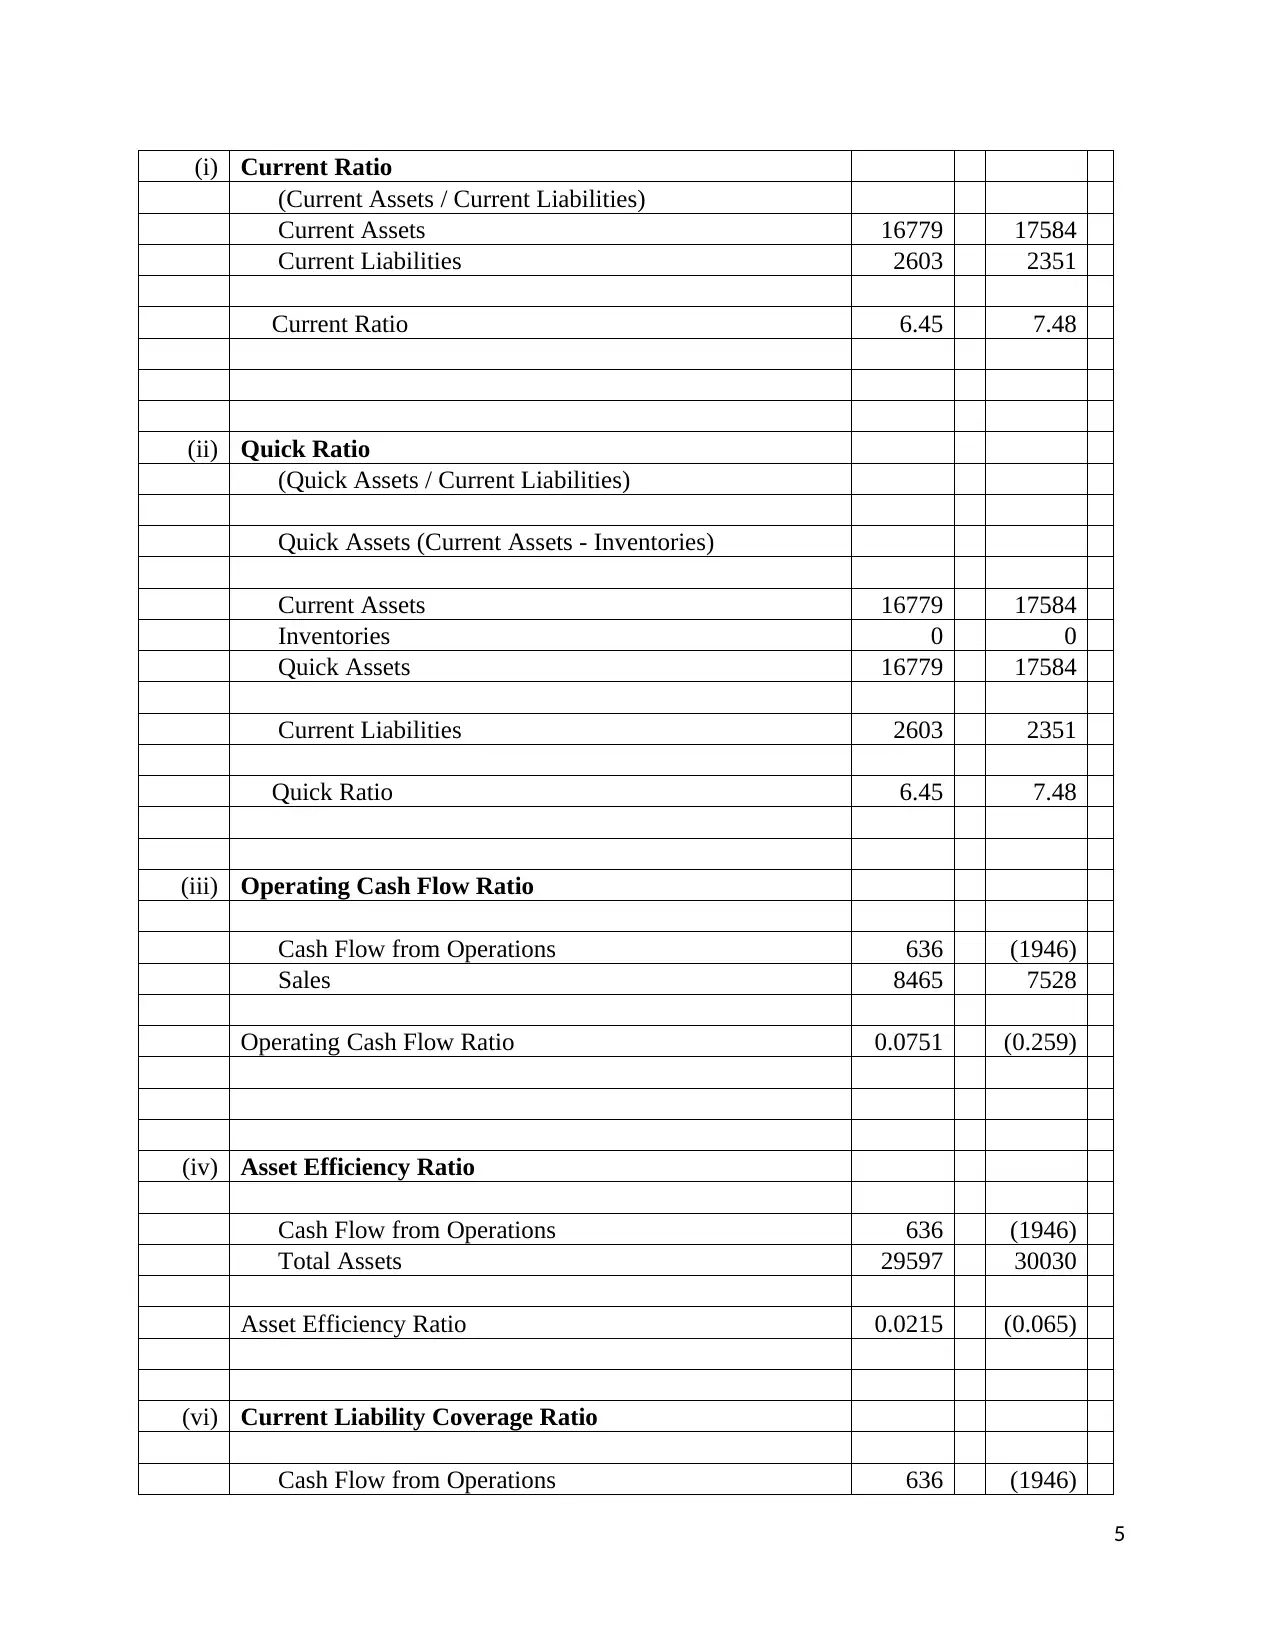
(i) Current Ratio
(Current Assets / Current Liabilities)
Current Assets 16779 17584
Current Liabilities 2603 2351
Current Ratio 6.45 7.48
(ii) Quick Ratio
(Quick Assets / Current Liabilities)
Quick Assets (Current Assets - Inventories)
Current Assets 16779 17584
Inventories 0 0
Quick Assets 16779 17584
Current Liabilities 2603 2351
Quick Ratio 6.45 7.48
(iii) Operating Cash Flow Ratio
Cash Flow from Operations 636 (1946)
Sales 8465 7528
Operating Cash Flow Ratio 0.0751 (0.259)
(iv) Asset Efficiency Ratio
Cash Flow from Operations 636 (1946)
Total Assets 29597 30030
Asset Efficiency Ratio 0.0215 (0.065)
(vi) Current Liability Coverage Ratio
Cash Flow from Operations 636 (1946)
5
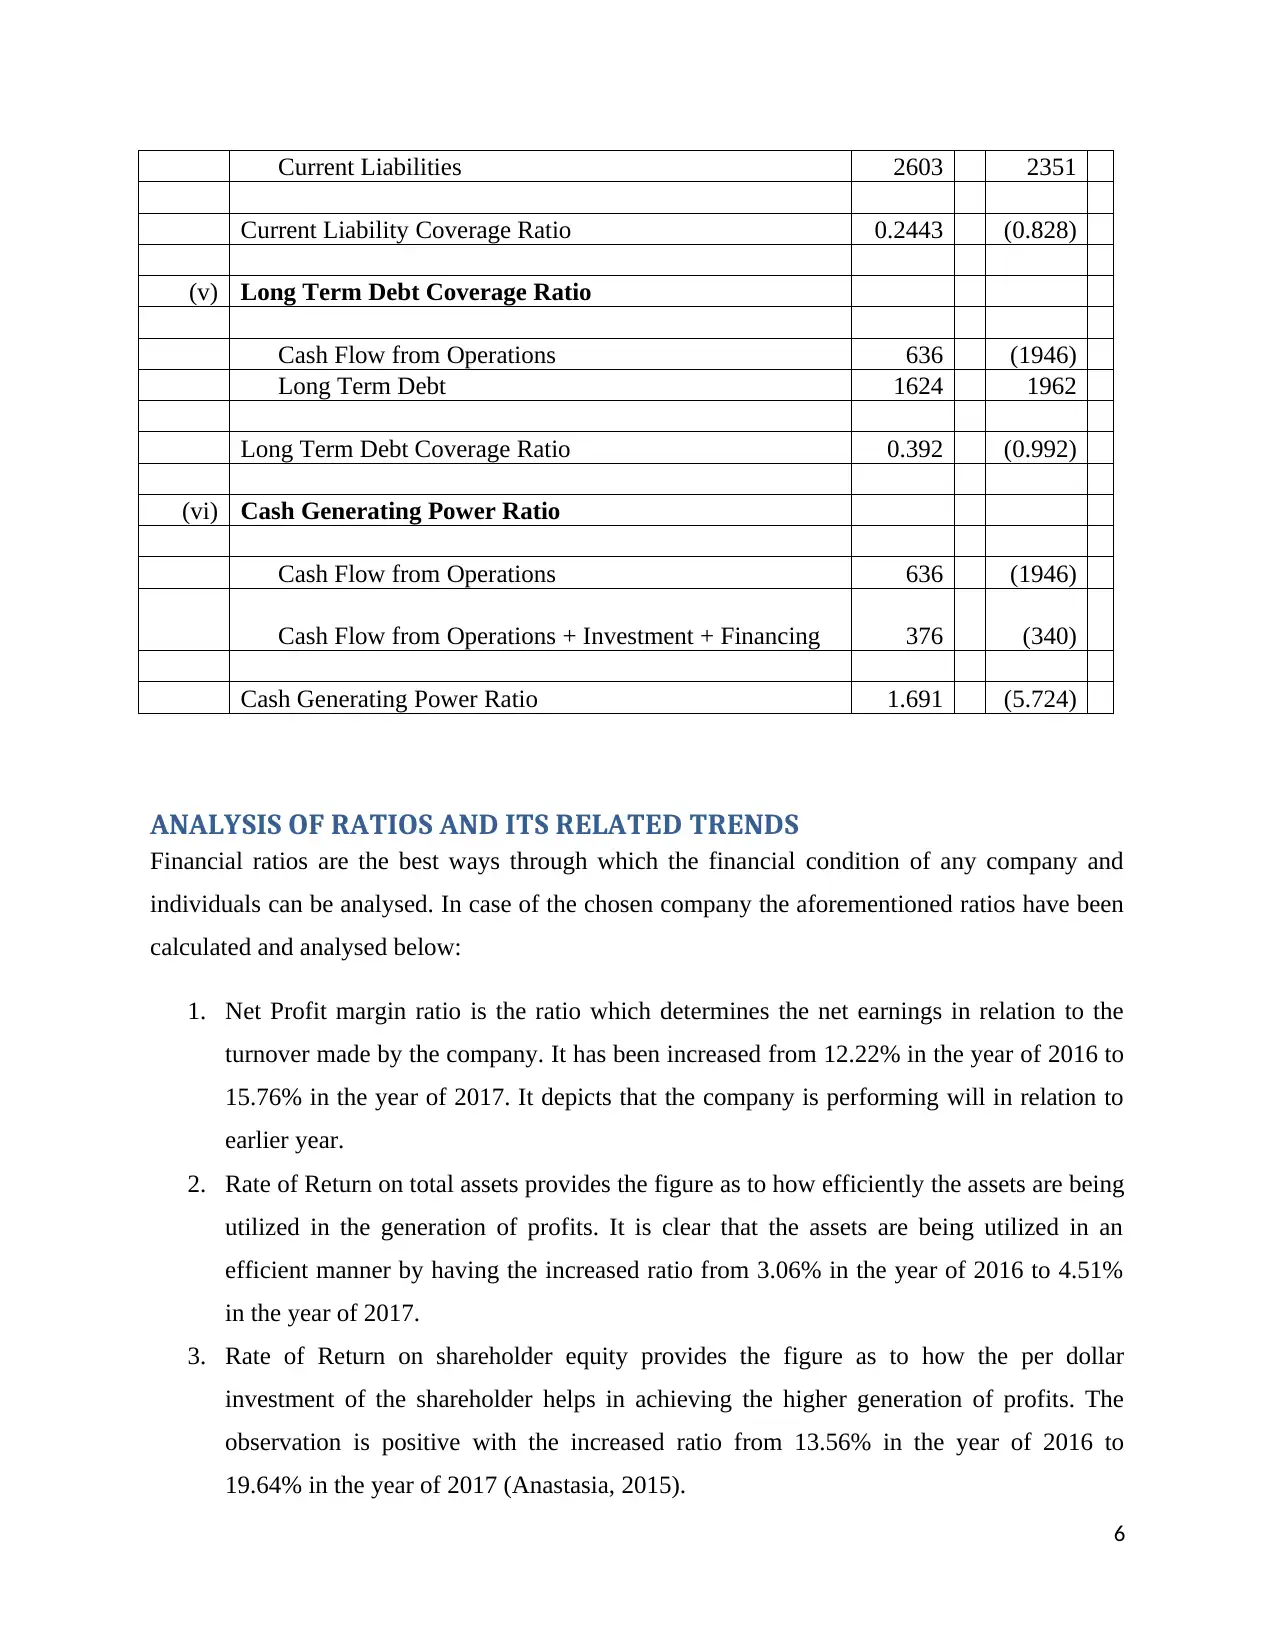
Current Liabilities 2603 2351
Current Liability Coverage Ratio 0.2443 (0.828)
(v) Long Term Debt Coverage Ratio
Cash Flow from Operations 636 (1946)
Long Term Debt 1624 1962
Long Term Debt Coverage Ratio 0.392 (0.992)
(vi) Cash Generating Power Ratio
Cash Flow from Operations 636 (1946)
Cash Flow from Operations + Investment + Financing 376 (340)
Cash Generating Power Ratio 1.691 (5.724)
ANALYSIS OF RATIOS AND ITS RELATED TRENDS
Financial ratios are the best ways through which the financial condition of any company and
individuals can be analysed. In case of the chosen company the aforementioned ratios have been
calculated and analysed below:
1. Net Profit margin ratio is the ratio which determines the net earnings in relation to the
turnover made by the company. It has been increased from 12.22% in the year of 2016 to
15.76% in the year of 2017. It depicts that the company is performing will in relation to
earlier year.
2. Rate of Return on total assets provides the figure as to how efficiently the assets are being
utilized in the generation of profits. It is clear that the assets are being utilized in an
efficient manner by having the increased ratio from 3.06% in the year of 2016 to 4.51%
in the year of 2017.
3. Rate of Return on shareholder equity provides the figure as to how the per dollar
investment of the shareholder helps in achieving the higher generation of profits. The
observation is positive with the increased ratio from 13.56% in the year of 2016 to
19.64% in the year of 2017 (Anastasia, 2015).
6
⊘ This is a preview!⊘
Do you want full access?
Subscribe today to unlock all pages.
Trusted by 1+ million students worldwide
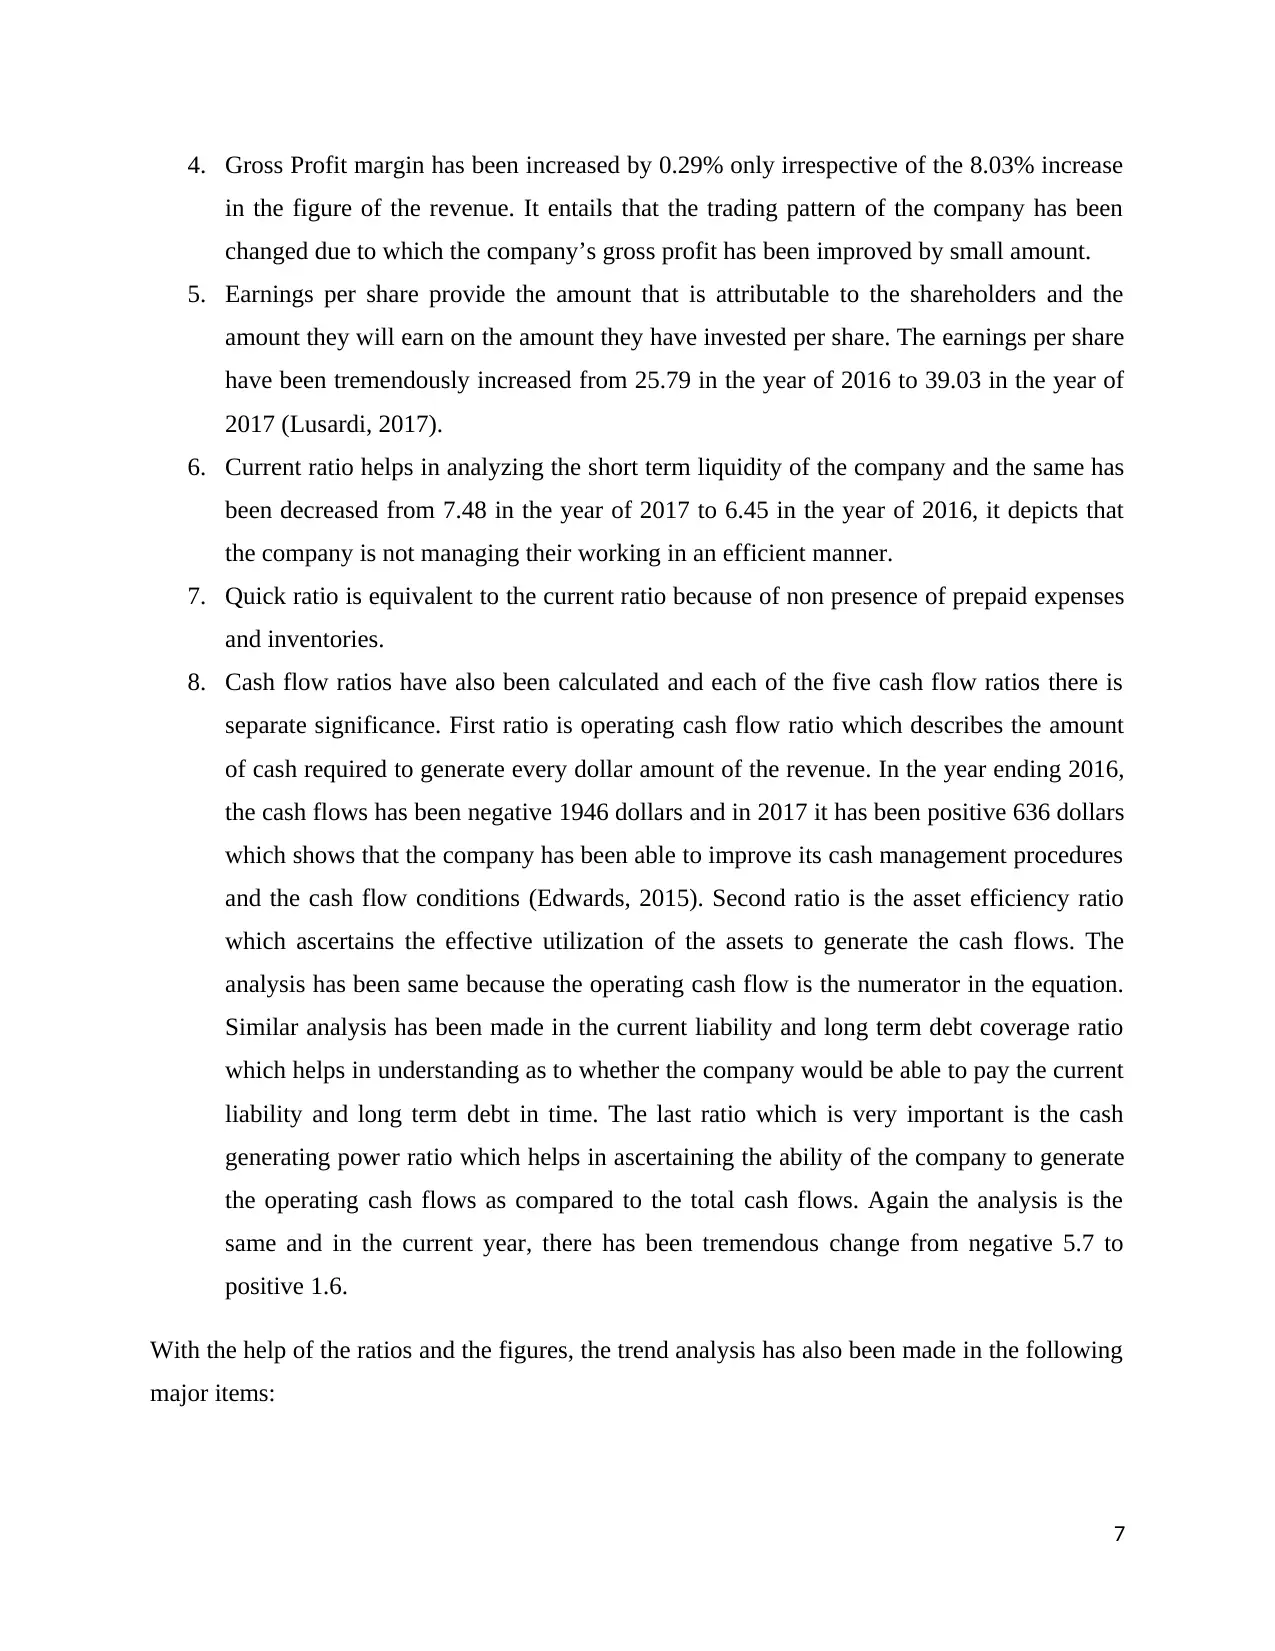
4. Gross Profit margin has been increased by 0.29% only irrespective of the 8.03% increase
in the figure of the revenue. It entails that the trading pattern of the company has been
changed due to which the company’s gross profit has been improved by small amount.
5. Earnings per share provide the amount that is attributable to the shareholders and the
amount they will earn on the amount they have invested per share. The earnings per share
have been tremendously increased from 25.79 in the year of 2016 to 39.03 in the year of
2017 (Lusardi, 2017).
6. Current ratio helps in analyzing the short term liquidity of the company and the same has
been decreased from 7.48 in the year of 2017 to 6.45 in the year of 2016, it depicts that
the company is not managing their working in an efficient manner.
7. Quick ratio is equivalent to the current ratio because of non presence of prepaid expenses
and inventories.
8. Cash flow ratios have also been calculated and each of the five cash flow ratios there is
separate significance. First ratio is operating cash flow ratio which describes the amount
of cash required to generate every dollar amount of the revenue. In the year ending 2016,
the cash flows has been negative 1946 dollars and in 2017 it has been positive 636 dollars
which shows that the company has been able to improve its cash management procedures
and the cash flow conditions (Edwards, 2015). Second ratio is the asset efficiency ratio
which ascertains the effective utilization of the assets to generate the cash flows. The
analysis has been same because the operating cash flow is the numerator in the equation.
Similar analysis has been made in the current liability and long term debt coverage ratio
which helps in understanding as to whether the company would be able to pay the current
liability and long term debt in time. The last ratio which is very important is the cash
generating power ratio which helps in ascertaining the ability of the company to generate
the operating cash flows as compared to the total cash flows. Again the analysis is the
same and in the current year, there has been tremendous change from negative 5.7 to
positive 1.6.
With the help of the ratios and the figures, the trend analysis has also been made in the following
major items:
7
Paraphrase This Document
Need a fresh take? Get an instant paraphrase of this document with our AI Paraphraser
1. Increase in Net Profit in relation to Revenue – The revenue of the company has been
increased by 8% approximately in 2017 as compared to the year of 2016. But the net
profit has been increased by 3.54% only which exhibits that the expenses have also been
increased as compared to the earlier year.
2. Decrease in Current Assets – The value of the current assets has been decreased in
relation to the increase in revenue. It exhibits that the cash flows of the company has been
increased and the same is very clear from the cash flow statement read with the cash flow
ratios.
3. Decrease in Long Term Debt – There has been decrease in the long term debt which
ensures that the company has paid the debt from the cash flows generated during the year
and hence it is the positive indication for the growth of the company.
With this the analysis of the ratios and the trends have been made and have been found positive
about the future certainty of the company keeping in consideration of the financial crisis that has
happened in the last decades.
COMPANY AND ITS COMPETITORS
The chosen company is Insurance Australia Group Limited and is into the financing sector of
Insurance and is registered in Sydney, Australia and is in existence for 90 plus years. The
company is providing not only the insurance of businesses but also for the individuals and also
includes the motor vehicle and compensation to workers insurance. The company operates its
functions through online mode under the brand name of Buzz (Insurance Australia Official
Website, 2017). There are three chief competitors of the company. One is Westpac Banking
Corporation, second is Commonwealth Bank Limited and the third one is Suncorp – Metway
Limited. Each of these companies has different strategies of operations and are working edge to
edge basis for each other.
Westpac Company is founded in the year of eighteen hundred and seventeen and has been found
as one of the top rival of the company and as on that the company is employing 20000 more
employees than the chosen company. The company has celebrated its 200th century in the year of
2017 and serving more than 12 million customers. But recently the company has been fined for
having the ineffective and bad mortgage system. Common Wealth bank is also founded in
8
Australia in the year of 1911 and has 38000 more employees than the chosen company and
accordingly the company has the roots in the banking industry with the larger effect. Suncorp
Company has been founded in Queensland having employees nearer to the chosen company but
has been able to generate the revenues equal to the approximately 6.42% of the revenue of the
chosen company. Thus, in this manner each of the competitors has its own significance with
regard to the chosen company.
ANALYSIS OF THE CORPORATE GOVERNANCE
Corporate Governance is the code of conduct along with the policies, procedures and rules and
regulations which are required to be ensure that the interest of the stakeholders and the
shareholders of the company have been considered with completeness (Dandino, 2014).
As per the statement of corporate governance as hosted on the website of the company, it has
been observed that the necessary compliance has been made with the third edition of Principles
and Recommendation of Australia Securities Exchange Corporate Governance Council. Also, the
board of director has the full responsibility to ensure the compliance with the corporate
governance framework which is accordance with the provisions of the Corporations Act 2001.
Following are the facts observed from the statement of corporate governance and is worth
mentioning as it shows the negative as well as positive side of the effective management of the
company.
Board’s Role
As per the first principle of the laying foundations for management and oversight, the
responsibility has been given totally to the board of director for protecting the various interests of
the shareholders as well as the stakeholders and for the effective running of the functions of the
company. Following are the areas where there attention is required:
- Strategies of the group towards the organizational objectives.
- Maintaining the integrity and faithfulness of the financial information and reporting
system of the company
9
⊘ This is a preview!⊘
Do you want full access?
Subscribe today to unlock all pages.
Trusted by 1+ million students worldwide
The statement has laid down the responsibilities for Chief Executive Officer also (Insurance
Australia Official Website, 2017). As per the provisions of Corporations Act 2001, he shall make
all the endeavors to manage the routine affairs of the company and if any regularity comes under
observation then the same shall be brought by him to the notice of the management of the
company in order to have the correction there from (Cameron, 2014).
Ethical and Responsible decision making
The third principle makes the company to mention all the ethical requirements that every
employee and officers shall follow. The same has been done and to mention it better the
company has bring on its roll the well known ethicist - Dr Simon Longstaff (Insurance Australia
Official Website, 2017) .
CONCLUSION
The report has been prepared with the objective of providing the detailed information about the
company and its working. The working has been analysed not only in the form of the financial
but also through the performance of the competitors and more important through the
effectiveness of the corporate governance. Each of the analysis is very important for
understanding the function of the company and the same has been depicted from and exhibited in
the report. The report has taught that the financial ratios have the important role in getting the
detailed degree of the performance of the company as each of the ratios have its own significance
and each of them has different linkage to different concepts. Second lesson that has been
concluded from the report is that the competitor’s analysis is required before taking any
necessary step.
REFERENCES
10
Paraphrase This Document
Need a fresh take? Get an instant paraphrase of this document with our AI Paraphraser
Anastasia, (2015), “Financial Statement Analysis : An Introduction” available on
https://www.cleverism.com/financial-statement-analysis-introduction/ accessed on 05/09/2018
Cameron A, (2014), “Corporate Governance Principles and Recommendations” available on
http://www.asx.com.au/documents/asx-compliance/cgc-principles-and-recommendations-3rd-
edn.pdf accessed on 05/09/2018.
Dandino P. (2014), “Corporate Governance : Something for everyone”, Franchising World,
pages 40-41.
Edwards, A., (2015), “Financial constraints and cash tax savings”. The Accounting
Review, 91(3), pp.859-881.
Insurance Australia Official Website, “Annual Report 2017” available on
http://www.iag.com.au/investors/reports accessed on 05/09/2018
Lusardi, A., (2017), “Optimal financial knowledge and wealth inequality”. Journal of Political
Economy, 125(2), pp.431-477.
11
1 out of 11
Related Documents


Your All-in-One AI-Powered Toolkit for Academic Success.
+13062052269
info@desklib.com
Available 24*7 on WhatsApp / Email
![[object Object]](/_next/static/media/star-bottom.7253800d.svg)
Unlock your academic potential
Copyright © 2020–2026 A2Z Services. All Rights Reserved. Developed and managed by ZUCOL.