Insurance Australia Ltd: Financial Analysis and Performance Evaluation
VerifiedAdded on 2023/03/20
|17
|3802
|29
Report
AI Summary
This report provides a financial analysis of Insurance Australia Ltd, focusing on the company's performance using various financial ratios. The analysis covers profitability ratios (operating profit margin, net profit margin), gearing ratios (debt-to-equity ratio, debt ratio), and efficiency ratios, using data from the company's annual reports over a five-year period. The report examines trends in these ratios to assess the company's financial health, operational efficiency, and capital structure. The analysis includes graphical representations of key ratios, offering a visual understanding of the company's performance. The report aims to provide insights into the company's financial strengths and weaknesses, offering recommendations for improvement, particularly in maintaining and enhancing profitability and managing debt levels. The study highlights the importance of ratio analysis in evaluating a company's financial performance and making informed investment decisions.
Running head: FINANCE FOR BUSINESS
Finance for Business
Name of the Student:
Name of the University:
Author’s Note:
Finance for Business
Name of the Student:
Name of the University:
Author’s Note:
Paraphrase This Document
Need a fresh take? Get an instant paraphrase of this document with our AI Paraphraser
1
FINANCE FOR BUSINESS
Table of Contents
Introduction...............................................................................................................................2
Discussion..................................................................................................................................3
Ratio Analysis.......................................................................................................................3
Profitability Ratios.................................................................................................................3
Gearing Ratios.......................................................................................................................7
Efficiency Ratios.................................................................................................................10
Conclusion...............................................................................................................................14
Reference.................................................................................................................................15
2
FINANCE FOR BUSINESS
Introduction
The main purpose of the assessment is to analyse the business of assessment is to analyse
the financial performance of a business which is listed in stock exchange of Australia. The
company which is selected for the purpose of analysis is Insurance Australia ltd which is
engaged in the business of insurance sector in the country. The company is regarded to be one of
the leading providers of insurance coverage in the country and therefore the performance of the
business considered for the purpose ascertaining whether the business is doing appropriately or
not. In order to effectively analyse the performance of the business, certain key financial ratios
are computed which would covering different aspects of performance of the business such as
profitability efficiency and solvency of the business (Annualreports.com. 2019). The assessment
would also he including certain recommendations which can help the management of the
company to improve the financial structure of the business.
Overview of the Company
The company which is considered in the assessment is Insurance Australia Ltd is engaged
in the business of providing insurance products and different services to the customers of the
business. Insurance Australia Group (IAG) is the parent company which controls the operations
in insurance sectors in Australia and New Zealand. The company is regarded as one of the
leading providers of underwriting services in the country. businesses underwrite over $11 billion
of premium per annum, selling insurance under many leading brands (Iag.com.au. 2019). The
origin of the company dates back to 1920 when the company was established with a different
name and still then the company provided a range off insurance products to the customers of the
business.
⊘ This is a preview!⊘
Do you want full access?
Subscribe today to unlock all pages.
Trusted by 1+ million students worldwide
3
FINANCE FOR BUSINESS
As per the recent trend, the management of the company is trying to enhance the
profitability and overall services which is provided by the business for the purpose of enhancing
the revenue and profitability of the business. In addition to this, the management of the company
has made changes in the capital structure if the business in order improve the overall efficiency
of the business.
Discussion
Ratio Analysis
The financial performance of a business of Insurance Australia Group would be measured
from the annual report which is prepared by the management of the company depicting all the
income and expenses of the business. In order to appropriately analyse the performance of the
business relating to different areas some key financial ratio s are considered. Ratio analysis is a
tool which is used by the business to analyse the performance of a business in terms of different
aspects of performance (Babalola and Abiola 2013). Ratio analysis is used by the management of
the company to take vital decisions regarding the operational process of the business. In case of
Insurance Australia ltd, the key financial ratios of the business are computed for the profitability,
solvency and efficiency (Easton and Sommers 2018). The ratios for the company are for a period
of five years so that appropriate trend can be presented regarding the growth and development of
the business over a period of five years. The analysis of different ratios of the business are
appropriately presented in below:
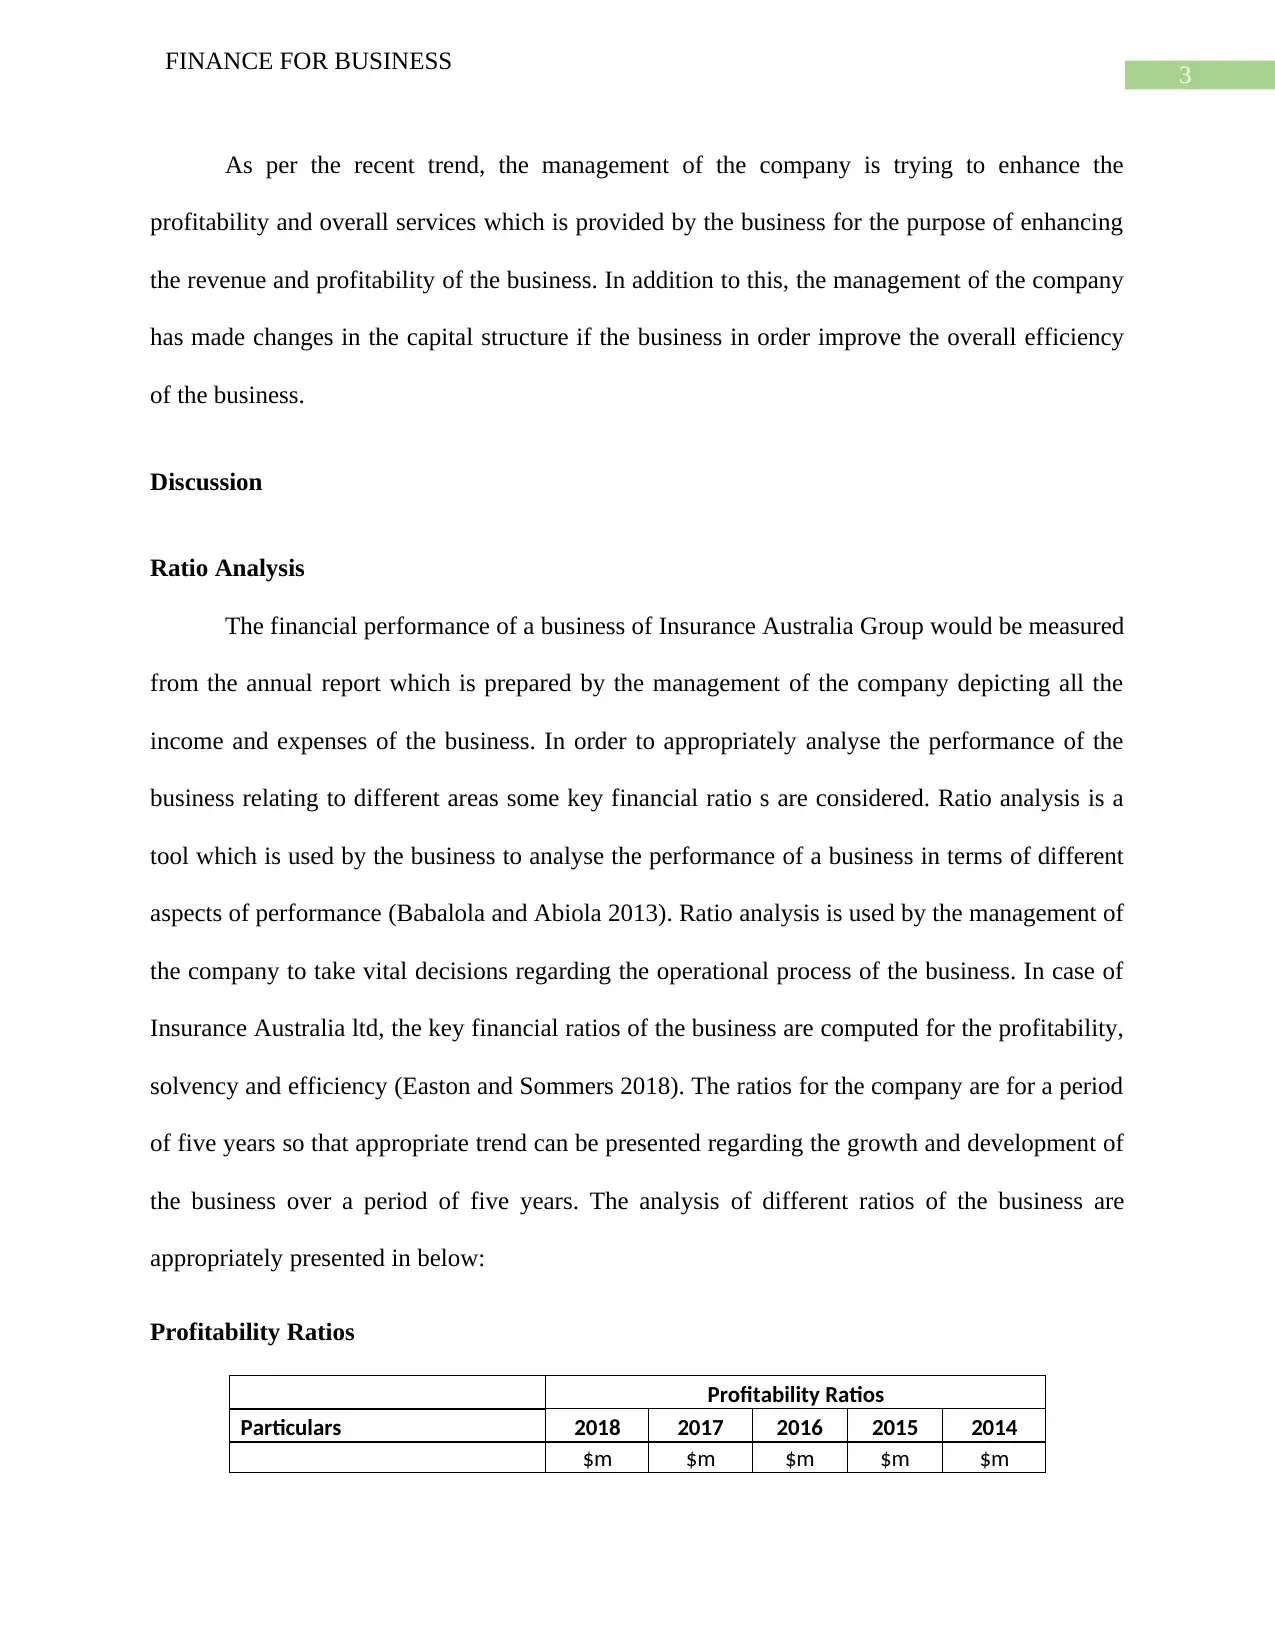
Profitability Ratios
Profitability Ratios
Particulars 2018 2017 2016 2015 2014
$m $m $m $m $m
FINANCE FOR BUSINESS
As per the recent trend, the management of the company is trying to enhance the
profitability and overall services which is provided by the business for the purpose of enhancing
the revenue and profitability of the business. In addition to this, the management of the company
has made changes in the capital structure if the business in order improve the overall efficiency
of the business.
Discussion
Ratio Analysis
The financial performance of a business of Insurance Australia Group would be measured
from the annual report which is prepared by the management of the company depicting all the
income and expenses of the business. In order to appropriately analyse the performance of the
business relating to different areas some key financial ratio s are considered. Ratio analysis is a
tool which is used by the business to analyse the performance of a business in terms of different
aspects of performance (Babalola and Abiola 2013). Ratio analysis is used by the management of
the company to take vital decisions regarding the operational process of the business. In case of
Insurance Australia ltd, the key financial ratios of the business are computed for the profitability,
solvency and efficiency (Easton and Sommers 2018). The ratios for the company are for a period
of five years so that appropriate trend can be presented regarding the growth and development of
the business over a period of five years. The analysis of different ratios of the business are
appropriately presented in below:
Profitability Ratios
Profitability Ratios
Particulars 2018 2017 2016 2015 2014
$m $m $m $m $m
Paraphrase This Document
Need a fresh take? Get an instant paraphrase of this document with our AI Paraphraser
4
FINANCE FOR BUSINESS
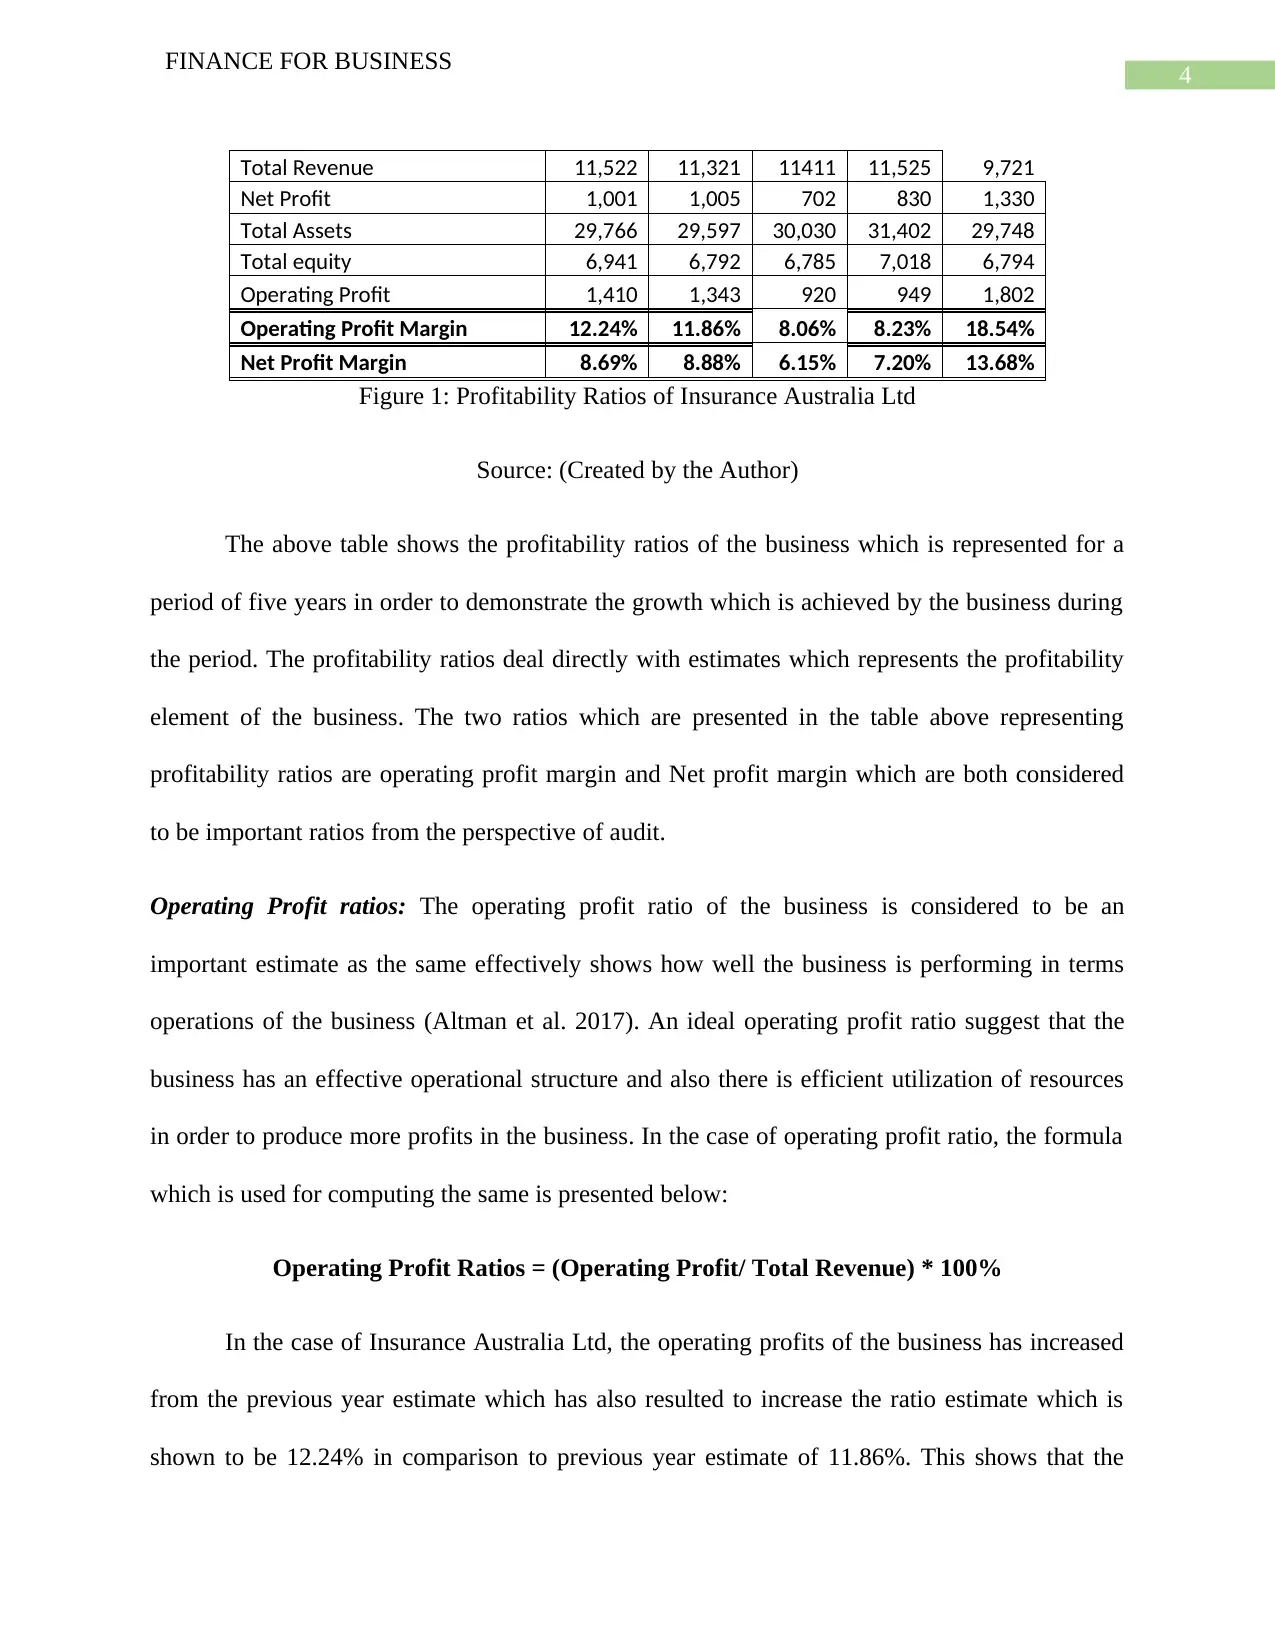
Total Revenue 11,522 11,321 11411 11,525 9,721
Net Profit 1,001 1,005 702 830 1,330
Total Assets 29,766 29,597 30,030 31,402 29,748
Total equity 6,941 6,792 6,785 7,018 6,794
Operating Profit 1,410 1,343 920 949 1,802
Operating Profit Margin 12.24% 11.86% 8.06% 8.23% 18.54%
Net Profit Margin 8.69% 8.88% 6.15% 7.20% 13.68%
Figure 1: Profitability Ratios of Insurance Australia Ltd
Source: (Created by the Author)
The above table shows the profitability ratios of the business which is represented for a
period of five years in order to demonstrate the growth which is achieved by the business during
the period. The profitability ratios deal directly with estimates which represents the profitability
element of the business. The two ratios which are presented in the table above representing
profitability ratios are operating profit margin and Net profit margin which are both considered
to be important ratios from the perspective of audit.
Operating Profit ratios: The operating profit ratio of the business is considered to be an
important estimate as the same effectively shows how well the business is performing in terms
operations of the business (Altman et al. 2017). An ideal operating profit ratio suggest that the
business has an effective operational structure and also there is efficient utilization of resources
in order to produce more profits in the business. In the case of operating profit ratio, the formula
which is used for computing the same is presented below:
Operating Profit Ratios = (Operating Profit/ Total Revenue) * 100%
In the case of Insurance Australia Ltd, the operating profits of the business has increased
from the previous year estimate which has also resulted to increase the ratio estimate which is
shown to be 12.24% in comparison to previous year estimate of 11.86%. This shows that the
FINANCE FOR BUSINESS
Total Revenue 11,522 11,321 11411 11,525 9,721
Net Profit 1,001 1,005 702 830 1,330
Total Assets 29,766 29,597 30,030 31,402 29,748
Total equity 6,941 6,792 6,785 7,018 6,794
Operating Profit 1,410 1,343 920 949 1,802
Operating Profit Margin 12.24% 11.86% 8.06% 8.23% 18.54%
Net Profit Margin 8.69% 8.88% 6.15% 7.20% 13.68%
Figure 1: Profitability Ratios of Insurance Australia Ltd
Source: (Created by the Author)
The above table shows the profitability ratios of the business which is represented for a
period of five years in order to demonstrate the growth which is achieved by the business during
the period. The profitability ratios deal directly with estimates which represents the profitability
element of the business. The two ratios which are presented in the table above representing
profitability ratios are operating profit margin and Net profit margin which are both considered
to be important ratios from the perspective of audit.
Operating Profit ratios: The operating profit ratio of the business is considered to be an
important estimate as the same effectively shows how well the business is performing in terms
operations of the business (Altman et al. 2017). An ideal operating profit ratio suggest that the
business has an effective operational structure and also there is efficient utilization of resources
in order to produce more profits in the business. In the case of operating profit ratio, the formula
which is used for computing the same is presented below:
Operating Profit Ratios = (Operating Profit/ Total Revenue) * 100%
In the case of Insurance Australia Ltd, the operating profits of the business has increased
from the previous year estimate which has also resulted to increase the ratio estimate which is
shown to be 12.24% in comparison to previous year estimate of 11.86%. This shows that the
5
FINANCE FOR BUSINESS
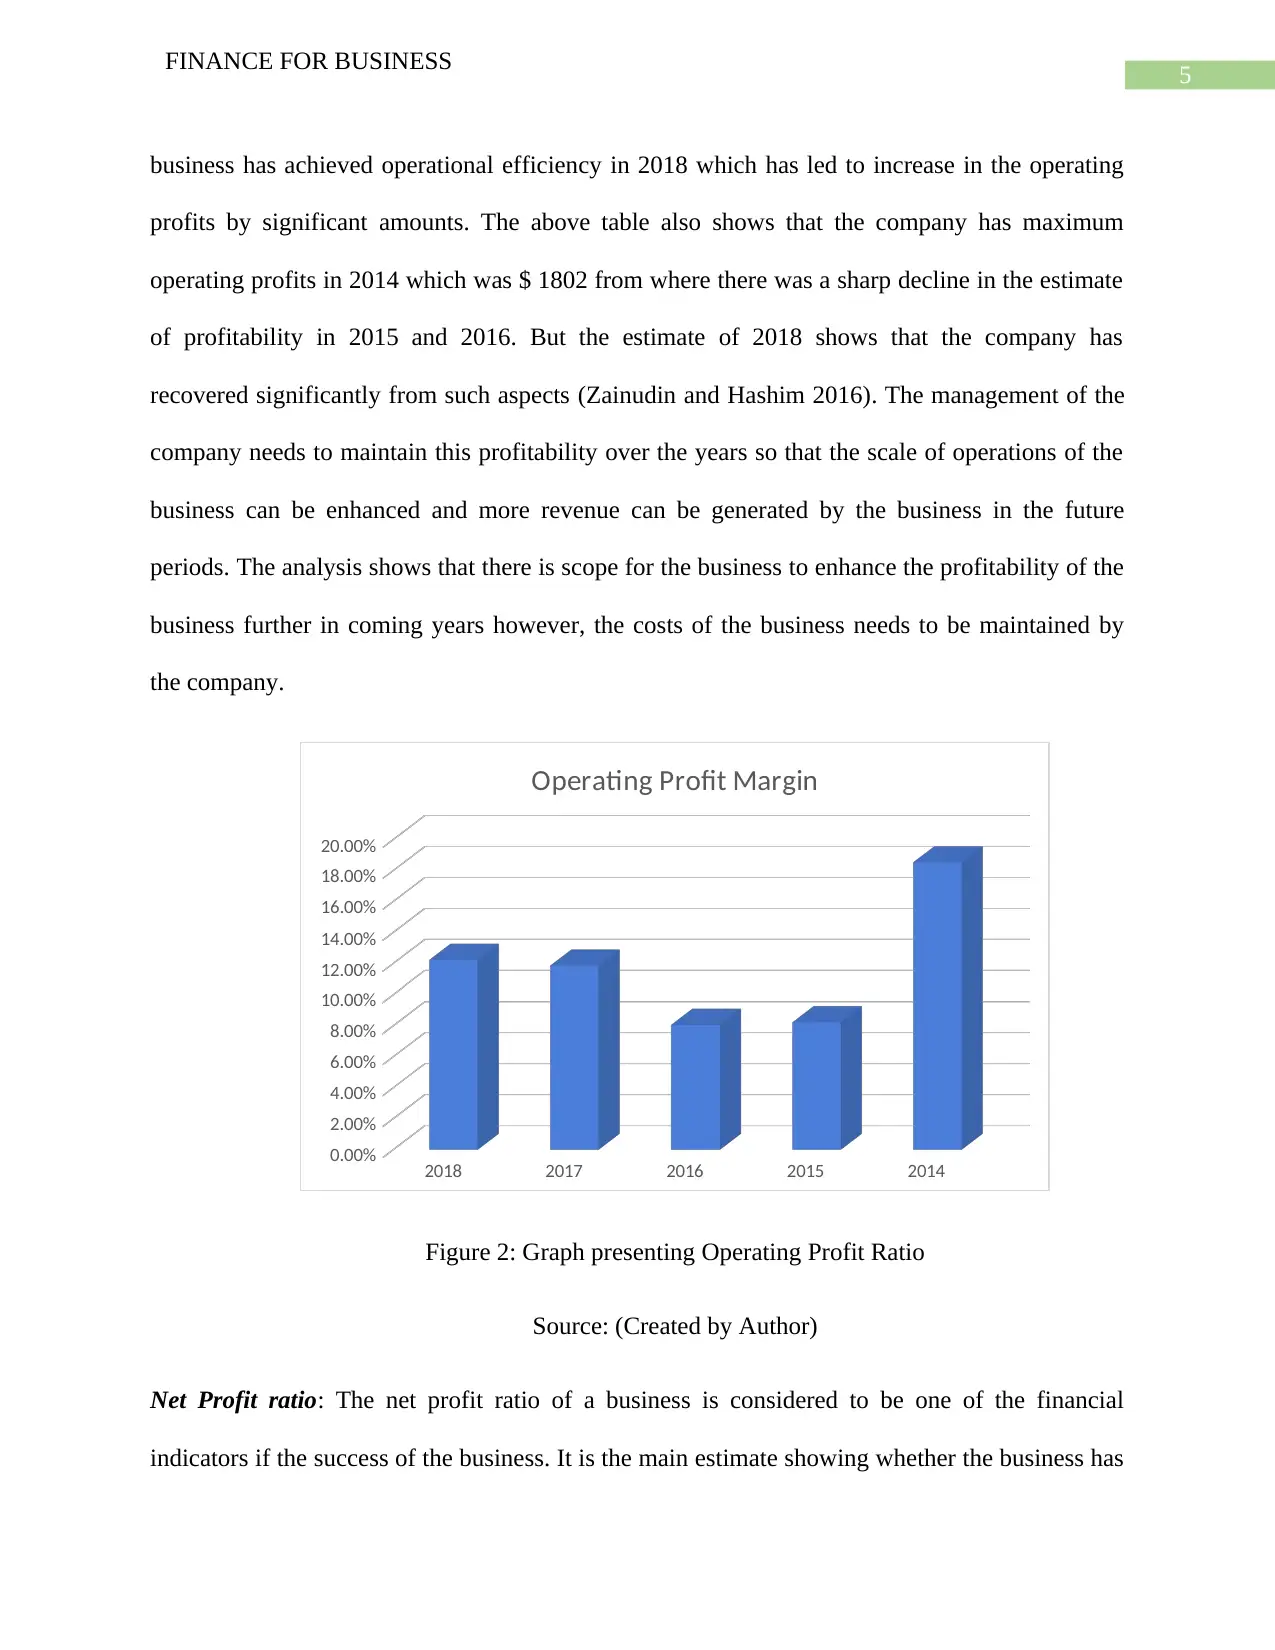
business has achieved operational efficiency in 2018 which has led to increase in the operating
profits by significant amounts. The above table also shows that the company has maximum
operating profits in 2014 which was $ 1802 from where there was a sharp decline in the estimate
of profitability in 2015 and 2016. But the estimate of 2018 shows that the company has
recovered significantly from such aspects (Zainudin and Hashim 2016). The management of the
company needs to maintain this profitability over the years so that the scale of operations of the
business can be enhanced and more revenue can be generated by the business in the future
periods. The analysis shows that there is scope for the business to enhance the profitability of the
business further in coming years however, the costs of the business needs to be maintained by
the company.
2018 2017 2016 2015 2014
0.00%
2.00%
4.00%
6.00%
8.00%
10.00%
12.00%
14.00%
16.00%
18.00%
20.00%
Operating Profit Margin
Figure 2: Graph presenting Operating Profit Ratio
Source: (Created by Author)
Net Profit ratio: The net profit ratio of a business is considered to be one of the financial
indicators if the success of the business. It is the main estimate showing whether the business has
FINANCE FOR BUSINESS
business has achieved operational efficiency in 2018 which has led to increase in the operating
profits by significant amounts. The above table also shows that the company has maximum
operating profits in 2014 which was $ 1802 from where there was a sharp decline in the estimate
of profitability in 2015 and 2016. But the estimate of 2018 shows that the company has
recovered significantly from such aspects (Zainudin and Hashim 2016). The management of the
company needs to maintain this profitability over the years so that the scale of operations of the
business can be enhanced and more revenue can be generated by the business in the future
periods. The analysis shows that there is scope for the business to enhance the profitability of the
business further in coming years however, the costs of the business needs to be maintained by
the company.
2018 2017 2016 2015 2014
0.00%
2.00%
4.00%
6.00%
8.00%
10.00%
12.00%
14.00%
16.00%
18.00%
20.00%
Operating Profit Margin
Figure 2: Graph presenting Operating Profit Ratio
Source: (Created by Author)
Net Profit ratio: The net profit ratio of a business is considered to be one of the financial
indicators if the success of the business. It is the main estimate showing whether the business has
⊘ This is a preview!⊘
Do you want full access?
Subscribe today to unlock all pages.
Trusted by 1+ million students worldwide
6
FINANCE FOR BUSINESS
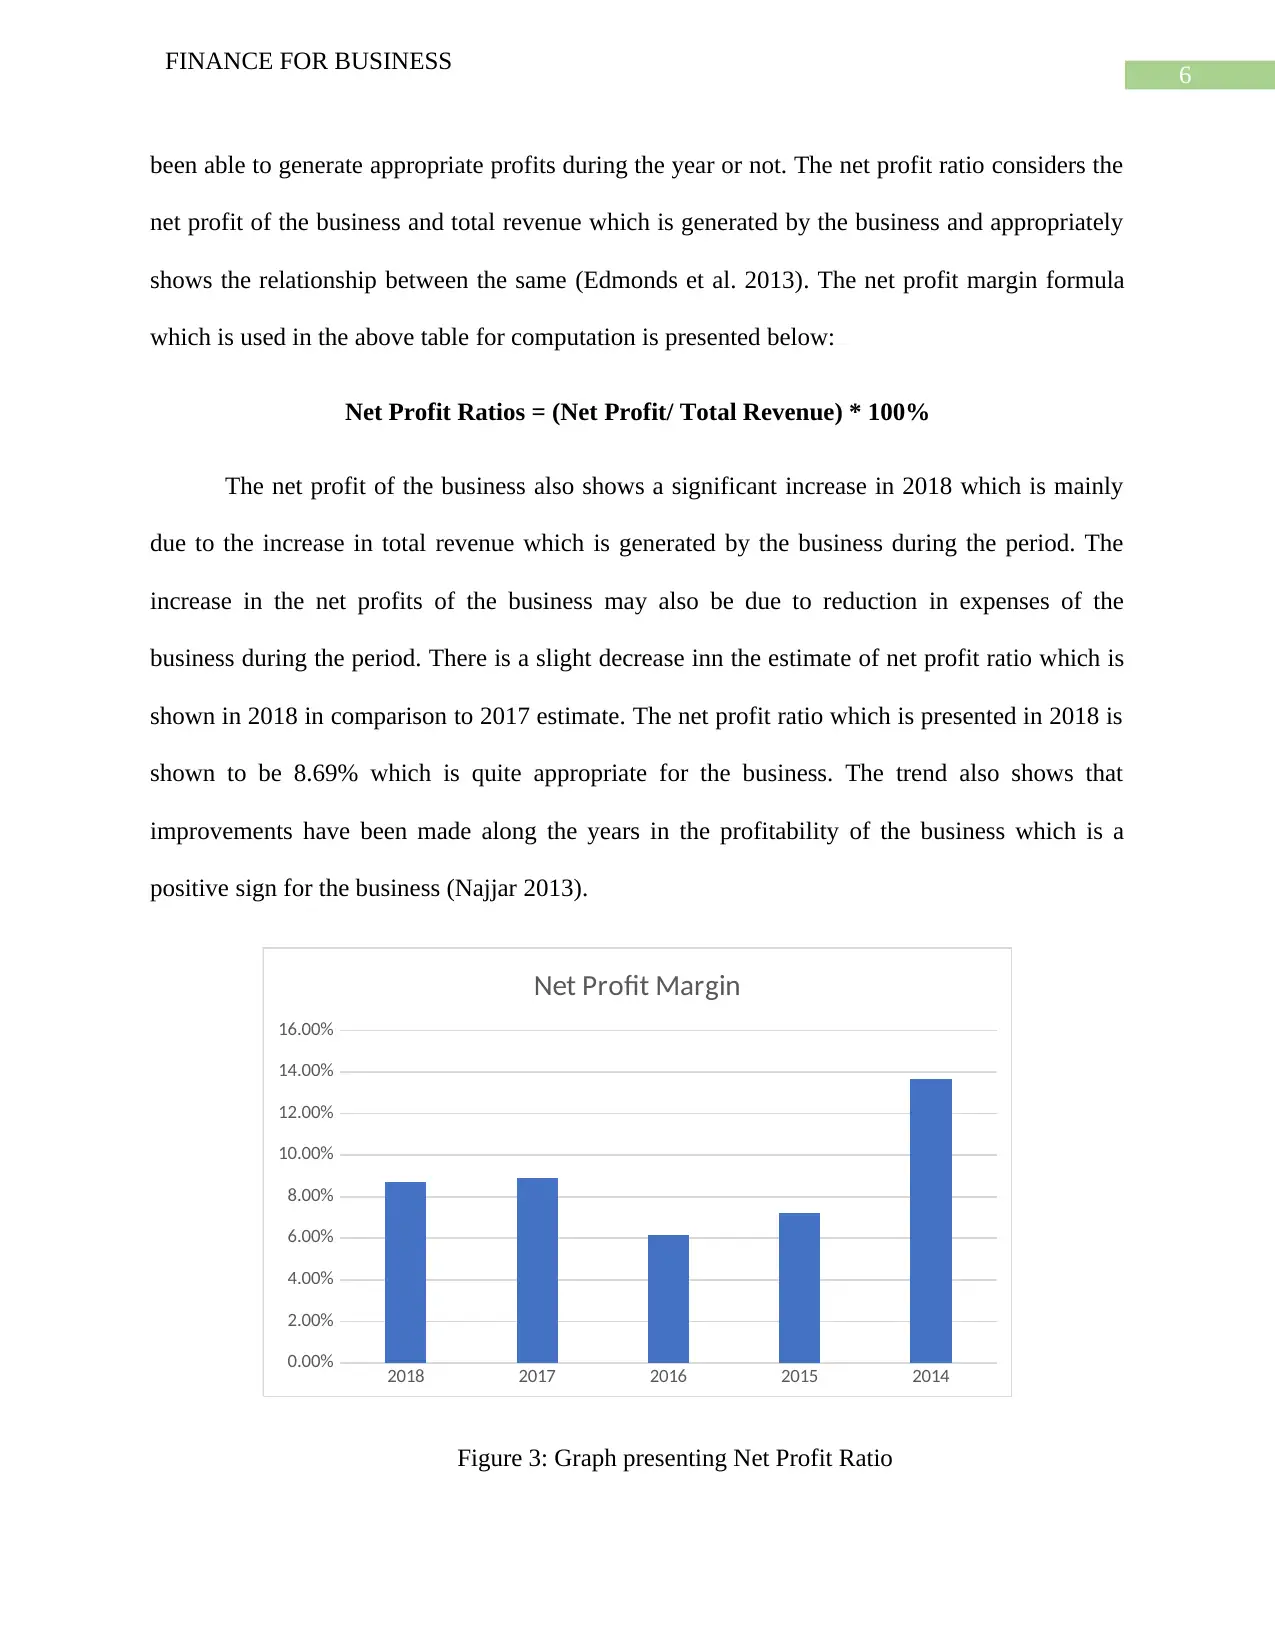
been able to generate appropriate profits during the year or not. The net profit ratio considers the
net profit of the business and total revenue which is generated by the business and appropriately
shows the relationship between the same (Edmonds et al. 2013). The net profit margin formula
which is used in the above table for computation is presented below:
Net Profit Ratios = (Net Profit/ Total Revenue) * 100%
The net profit of the business also shows a significant increase in 2018 which is mainly
due to the increase in total revenue which is generated by the business during the period. The
increase in the net profits of the business may also be due to reduction in expenses of the
business during the period. There is a slight decrease inn the estimate of net profit ratio which is
shown in 2018 in comparison to 2017 estimate. The net profit ratio which is presented in 2018 is
shown to be 8.69% which is quite appropriate for the business. The trend also shows that
improvements have been made along the years in the profitability of the business which is a
positive sign for the business (Najjar 2013).
2018 2017 2016 2015 2014
0.00%
2.00%
4.00%
6.00%
8.00%
10.00%
12.00%
14.00%
16.00%
Net Profit Margin
Figure 3: Graph presenting Net Profit Ratio
FINANCE FOR BUSINESS
been able to generate appropriate profits during the year or not. The net profit ratio considers the
net profit of the business and total revenue which is generated by the business and appropriately
shows the relationship between the same (Edmonds et al. 2013). The net profit margin formula
which is used in the above table for computation is presented below:
Net Profit Ratios = (Net Profit/ Total Revenue) * 100%
The net profit of the business also shows a significant increase in 2018 which is mainly
due to the increase in total revenue which is generated by the business during the period. The
increase in the net profits of the business may also be due to reduction in expenses of the
business during the period. There is a slight decrease inn the estimate of net profit ratio which is
shown in 2018 in comparison to 2017 estimate. The net profit ratio which is presented in 2018 is
shown to be 8.69% which is quite appropriate for the business. The trend also shows that
improvements have been made along the years in the profitability of the business which is a
positive sign for the business (Najjar 2013).
2018 2017 2016 2015 2014
0.00%
2.00%
4.00%
6.00%
8.00%
10.00%
12.00%
14.00%
16.00%
Net Profit Margin
Figure 3: Graph presenting Net Profit Ratio
Paraphrase This Document
Need a fresh take? Get an instant paraphrase of this document with our AI Paraphraser
7
FINANCE FOR BUSINESS
Source: (Created by Author)
The management of the company needs to further improve the profitability of the
business so that it can add more to the financial strengths of the business. In addition to this, it is
also to be noted that such profitability ratios are considered by the potential investors before they
take any decision regarding investment in a business.
Gearing Ratios
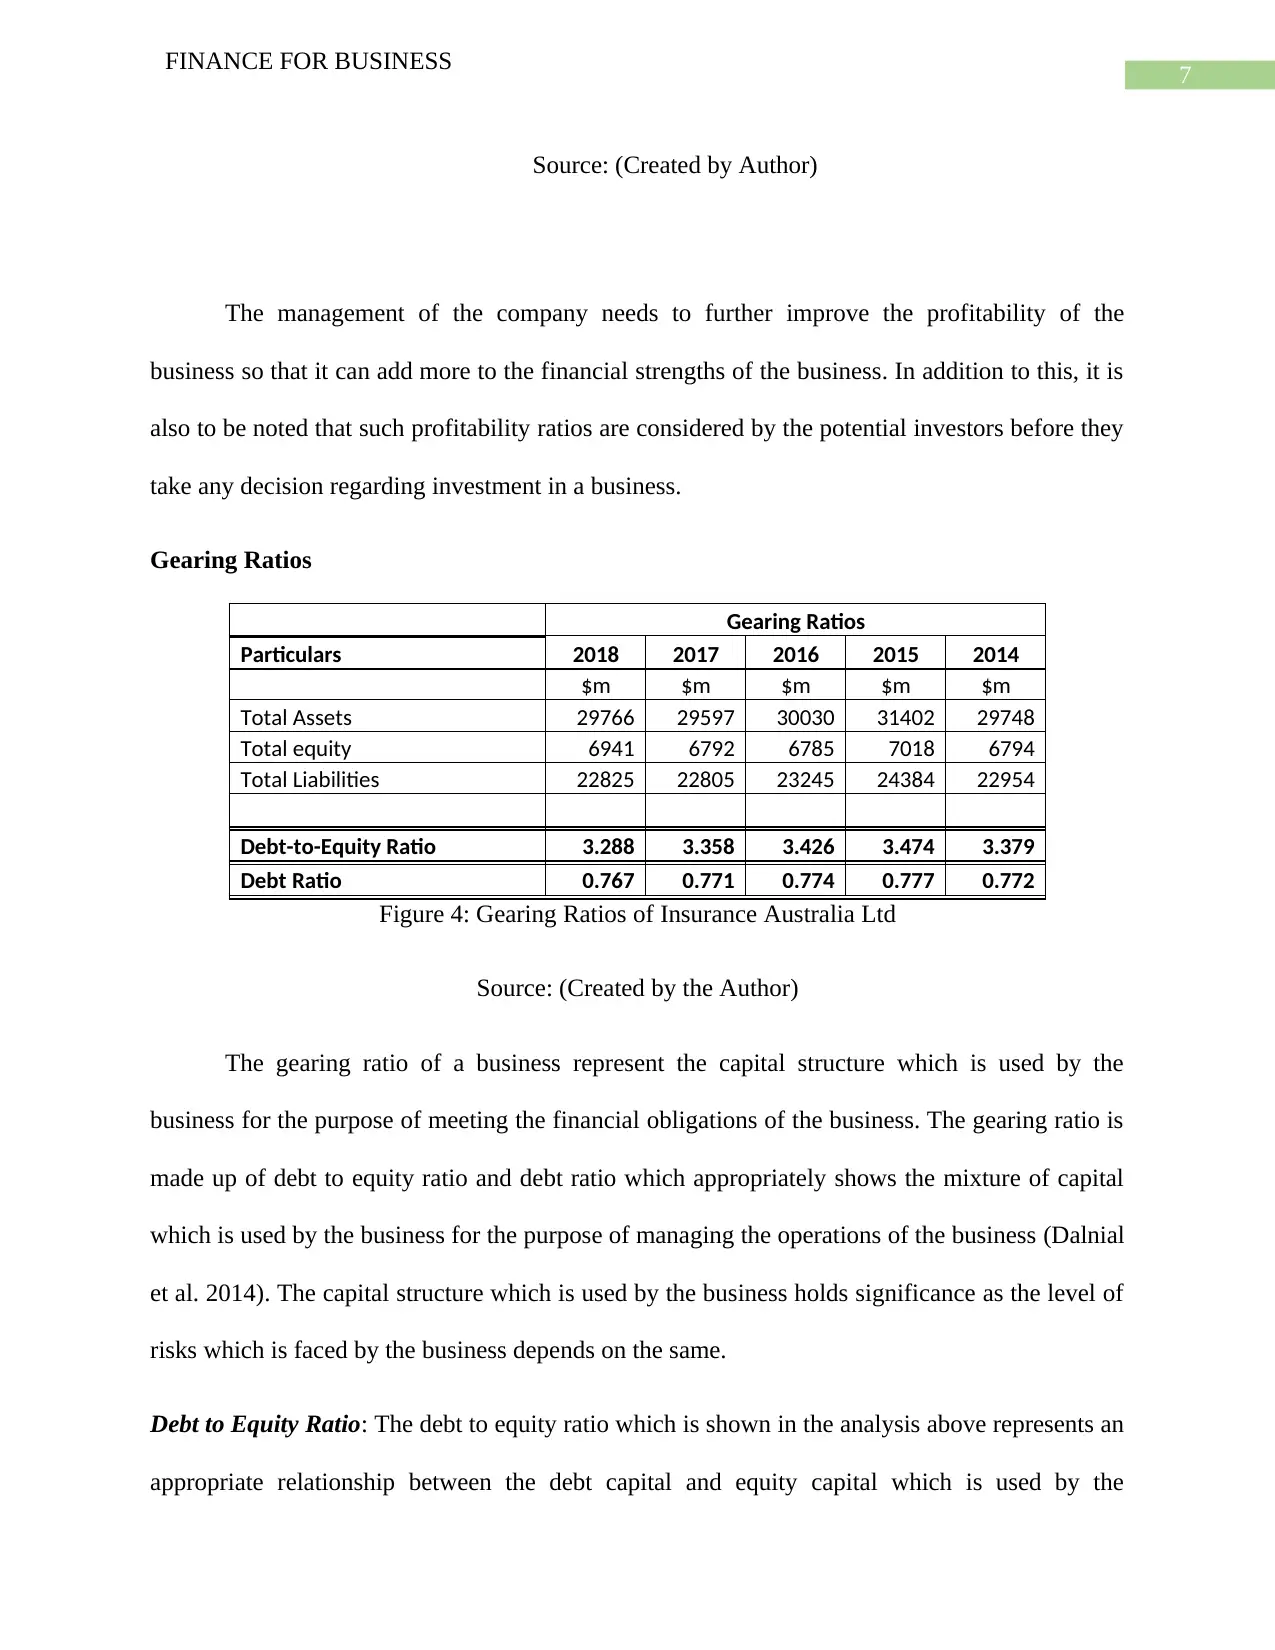
Gearing Ratios
Particulars 2018 2017 2016 2015 2014
$m $m $m $m $m
Total Assets 29766 29597 30030 31402 29748
Total equity 6941 6792 6785 7018 6794
Total Liabilities 22825 22805 23245 24384 22954
Debt-to-Equity Ratio 3.288 3.358 3.426 3.474 3.379
Debt Ratio 0.767 0.771 0.774 0.777 0.772
Figure 4: Gearing Ratios of Insurance Australia Ltd
Source: (Created by the Author)
The gearing ratio of a business represent the capital structure which is used by the
business for the purpose of meeting the financial obligations of the business. The gearing ratio is
made up of debt to equity ratio and debt ratio which appropriately shows the mixture of capital
which is used by the business for the purpose of managing the operations of the business (Dalnial
et al. 2014). The capital structure which is used by the business holds significance as the level of
risks which is faced by the business depends on the same.
Debt to Equity Ratio: The debt to equity ratio which is shown in the analysis above represents an
appropriate relationship between the debt capital and equity capital which is used by the
FINANCE FOR BUSINESS
Source: (Created by Author)
The management of the company needs to further improve the profitability of the
business so that it can add more to the financial strengths of the business. In addition to this, it is
also to be noted that such profitability ratios are considered by the potential investors before they
take any decision regarding investment in a business.
Gearing Ratios
Gearing Ratios
Particulars 2018 2017 2016 2015 2014
$m $m $m $m $m
Total Assets 29766 29597 30030 31402 29748
Total equity 6941 6792 6785 7018 6794
Total Liabilities 22825 22805 23245 24384 22954
Debt-to-Equity Ratio 3.288 3.358 3.426 3.474 3.379
Debt Ratio 0.767 0.771 0.774 0.777 0.772
Figure 4: Gearing Ratios of Insurance Australia Ltd
Source: (Created by the Author)
The gearing ratio of a business represent the capital structure which is used by the
business for the purpose of meeting the financial obligations of the business. The gearing ratio is
made up of debt to equity ratio and debt ratio which appropriately shows the mixture of capital
which is used by the business for the purpose of managing the operations of the business (Dalnial
et al. 2014). The capital structure which is used by the business holds significance as the level of
risks which is faced by the business depends on the same.
Debt to Equity Ratio: The debt to equity ratio which is shown in the analysis above represents an
appropriate relationship between the debt capital and equity capital which is used by the
8
FINANCE FOR BUSINESS
business. The debt equity ratio provides an appropriate estimation regarding the portion of debt
and equity which is used by the business (Zeytinoglu and Akarim 2013). The formula which is
used for computing the debt equity ratio is given below:
Debt Equity ratio = Total Liabilities/ Total Equity
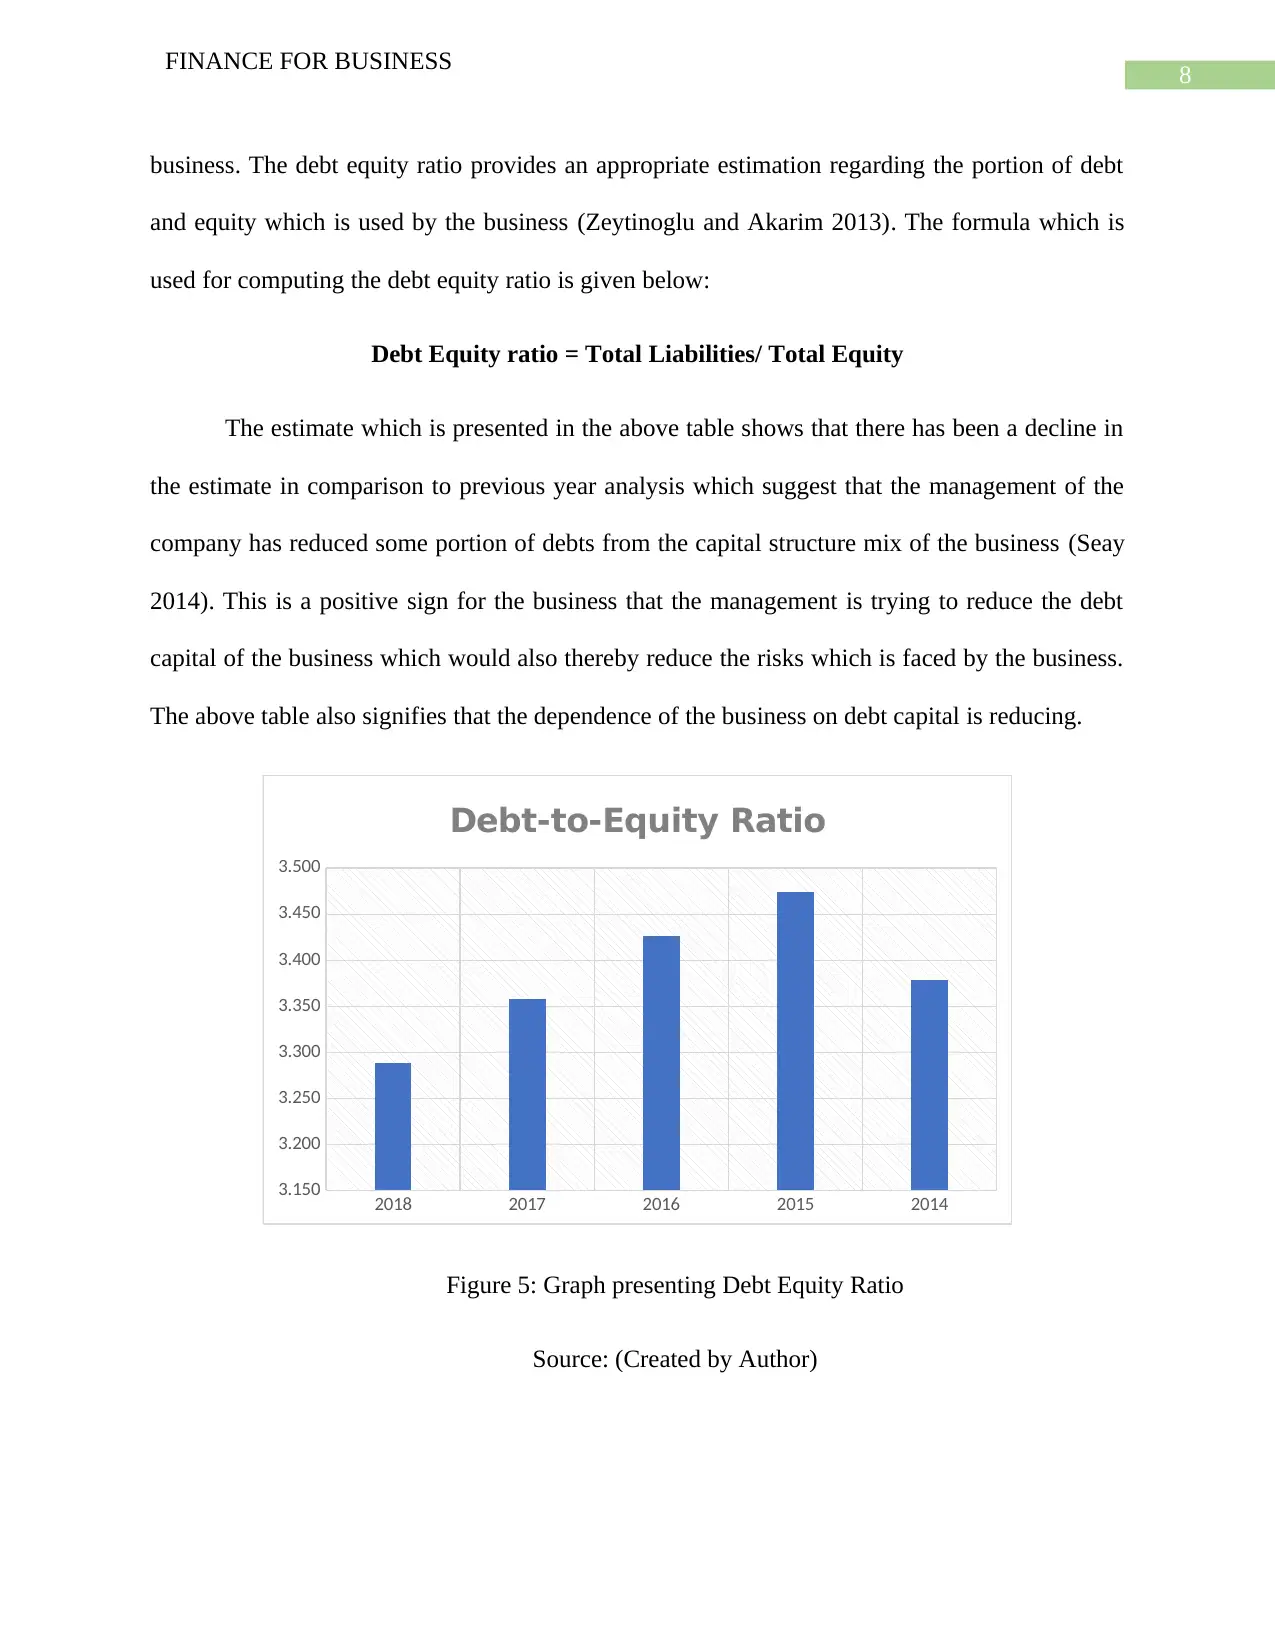
The estimate which is presented in the above table shows that there has been a decline in
the estimate in comparison to previous year analysis which suggest that the management of the
company has reduced some portion of debts from the capital structure mix of the business (Seay
2014). This is a positive sign for the business that the management is trying to reduce the debt
capital of the business which would also thereby reduce the risks which is faced by the business.
The above table also signifies that the dependence of the business on debt capital is reducing.
2018 2017 2016 2015 2014
3.150
3.200
3.250
3.300
3.350
3.400
3.450
3.500
Debt-to-Equity Ratio
Figure 5: Graph presenting Debt Equity Ratio
Source: (Created by Author)
FINANCE FOR BUSINESS
business. The debt equity ratio provides an appropriate estimation regarding the portion of debt
and equity which is used by the business (Zeytinoglu and Akarim 2013). The formula which is
used for computing the debt equity ratio is given below:
Debt Equity ratio = Total Liabilities/ Total Equity
The estimate which is presented in the above table shows that there has been a decline in
the estimate in comparison to previous year analysis which suggest that the management of the
company has reduced some portion of debts from the capital structure mix of the business (Seay
2014). This is a positive sign for the business that the management is trying to reduce the debt
capital of the business which would also thereby reduce the risks which is faced by the business.
The above table also signifies that the dependence of the business on debt capital is reducing.
2018 2017 2016 2015 2014
3.150
3.200
3.250
3.300
3.350
3.400
3.450
3.500
Debt-to-Equity Ratio
Figure 5: Graph presenting Debt Equity Ratio
Source: (Created by Author)
⊘ This is a preview!⊘
Do you want full access?
Subscribe today to unlock all pages.
Trusted by 1+ million students worldwide
9
FINANCE FOR BUSINESS
The above chart shows that there is a decline in the debt equity ratio of the business
which is a positive sign for the business. The maximum debt equity ratio as presented in the
graph above is shown for 2015.
Debt Ratio: The debt ratio of the business represents the overall debt capital which is used by the
business for managing the operational process of the business. The ratio forms a part of the
capital structure of the business. Most of the businesses use debt capital in an appropriate mix
with the equity capital of the business. The formula which is used for computing the debt ratio is
given below:
Debt ratio = Total Liabilities/ Total Assets
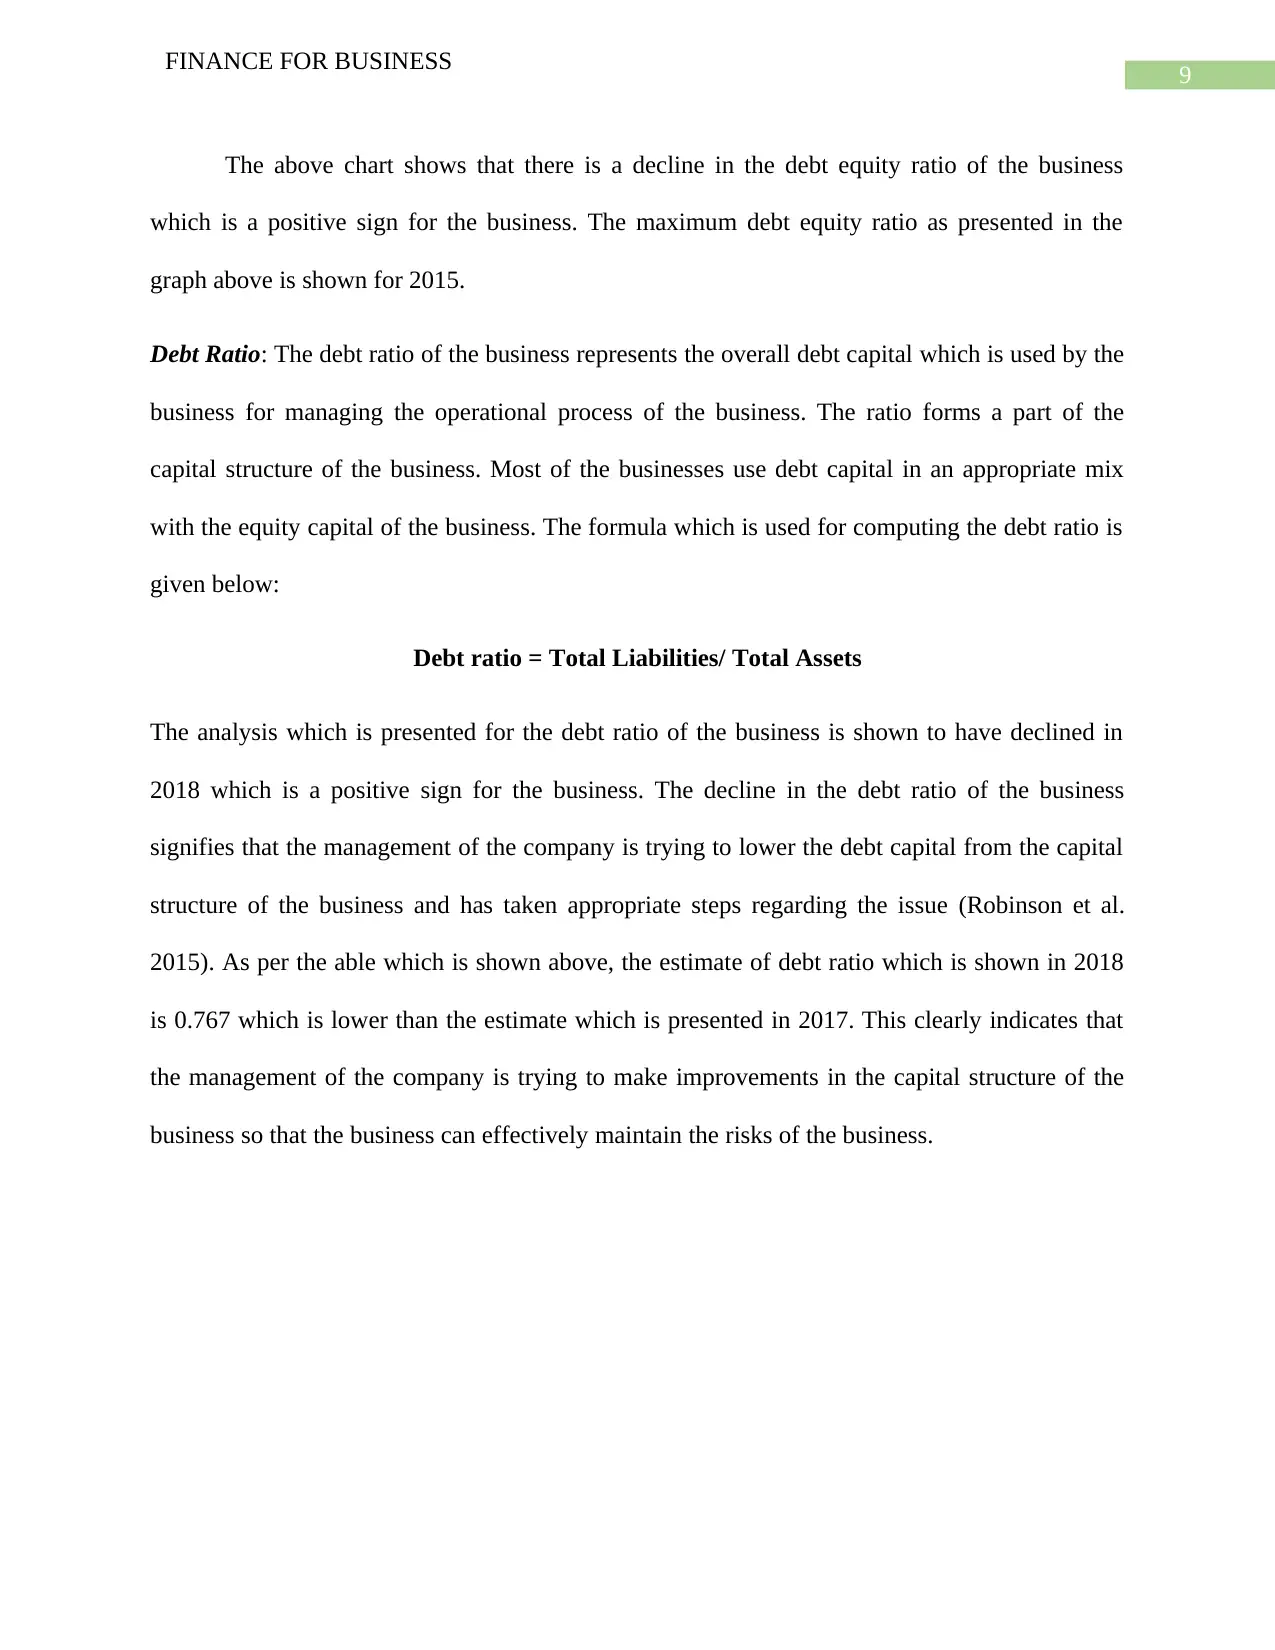
The analysis which is presented for the debt ratio of the business is shown to have declined in
2018 which is a positive sign for the business. The decline in the debt ratio of the business
signifies that the management of the company is trying to lower the debt capital from the capital
structure of the business and has taken appropriate steps regarding the issue (Robinson et al.
2015). As per the able which is shown above, the estimate of debt ratio which is shown in 2018
is 0.767 which is lower than the estimate which is presented in 2017. This clearly indicates that
the management of the company is trying to make improvements in the capital structure of the
business so that the business can effectively maintain the risks of the business.
FINANCE FOR BUSINESS
The above chart shows that there is a decline in the debt equity ratio of the business
which is a positive sign for the business. The maximum debt equity ratio as presented in the
graph above is shown for 2015.
Debt Ratio: The debt ratio of the business represents the overall debt capital which is used by the
business for managing the operational process of the business. The ratio forms a part of the
capital structure of the business. Most of the businesses use debt capital in an appropriate mix
with the equity capital of the business. The formula which is used for computing the debt ratio is
given below:
Debt ratio = Total Liabilities/ Total Assets
The analysis which is presented for the debt ratio of the business is shown to have declined in
2018 which is a positive sign for the business. The decline in the debt ratio of the business
signifies that the management of the company is trying to lower the debt capital from the capital
structure of the business and has taken appropriate steps regarding the issue (Robinson et al.
2015). As per the able which is shown above, the estimate of debt ratio which is shown in 2018
is 0.767 which is lower than the estimate which is presented in 2017. This clearly indicates that
the management of the company is trying to make improvements in the capital structure of the
business so that the business can effectively maintain the risks of the business.
Paraphrase This Document
Need a fresh take? Get an instant paraphrase of this document with our AI Paraphraser
10
FINANCE FOR BUSINESS
2018 2017 2016 2015 2014
0.760
0.762
0.764
0.766
0.768
0.770
0.772
0.774
0.776
0.778
0.767
0.771
0.774
0.777
0.772
Debt Ratio
Figure 6: Graph presenting Debt Ratio
Source: (Created by Author)
The above figure also shows that the level of debts which was used by the business has
declined over the years and the same is show to be lowest in 2018.
The management of the company needs to take appropriate steps in order to manage the
capital structure of the business as the same is considered to be determining factor in the success
of the business (Kuzey, Uyar and Delen 2014). In addition to this, it also is related to the level of
risks which is faced by the business during the period.
Efficiency Ratios
Efficiency Ratio
Particulars 2018 2017 2016 2015 2014
$m $m $m $m $m
Total Assets 29,766 29,597 30,030 31,402 29,748
Trade Receivables 4,085 4,153 6,622 653 628
Sales Revenue 11522 11321 11411 11525 9721
Total Asset Turnover ratio 0.387 0.383 0.380 0.367 0.327
11
FINANCE FOR BUSINESS
Receivables Turnover Ratio 2.821 2.726 1.723 17.649 15.479
Figure 7: Efficiency Ratios of Insurance Australia Ltd
Source: (Created by the Author)
The efficiency ratio of the business represents the effectiveness of the policies which are
implemented in the business by the management of the company. The efficiency ratio of the
business covers total asset turnover ratio and debtor’s turnover ratio which are considered to be
important estimates which helps the management of the company to take important decisions
regarding the business. The efficiency ratio of the business is also considered to be important as
the same is directly related to the profitability of the business.
Total Asset Turnover Ratio: The total asset turnover ratio is used by the management of the
company for estimating the assets which are used by the management of the company for the
purpose of generating revenue for the business. The total asset turnover ratio also shows the
policies which is followed by the business for managing the operations of the business and also
the total assets which is used by the business. The formula which is used for the purpose of
computing the ratio is shown below:
Total Asset Turnover ratio = Total Revenue/ Total Assets
The estimate which is presented in the table above shows that the estimate for total asset
turnover ratio has slightly increased during the period in comparison to previous year which is an
favorable factor for the business (Warren, Reeve and Duchac 2013). The management of the
company needs to improve the same in order to make improvements in the efficiency of the
business. This could have a direct impact on the profits which is generated by the business.
⊘ This is a preview!⊘
Do you want full access?
Subscribe today to unlock all pages.
Trusted by 1+ million students worldwide
1 out of 17
Related Documents


Your All-in-One AI-Powered Toolkit for Academic Success.
+13062052269
info@desklib.com
Available 24*7 on WhatsApp / Email
![[object Object]](/_next/static/media/star-bottom.7253800d.svg)
Unlock your academic potential
Copyright © 2020–2026 A2Z Services. All Rights Reserved. Developed and managed by ZUCOL.