Financial Review Magazine: Data Analysis Report on Insurance Brokers
VerifiedAdded on 2022/11/25
|9
|2093
|496
Report
AI Summary
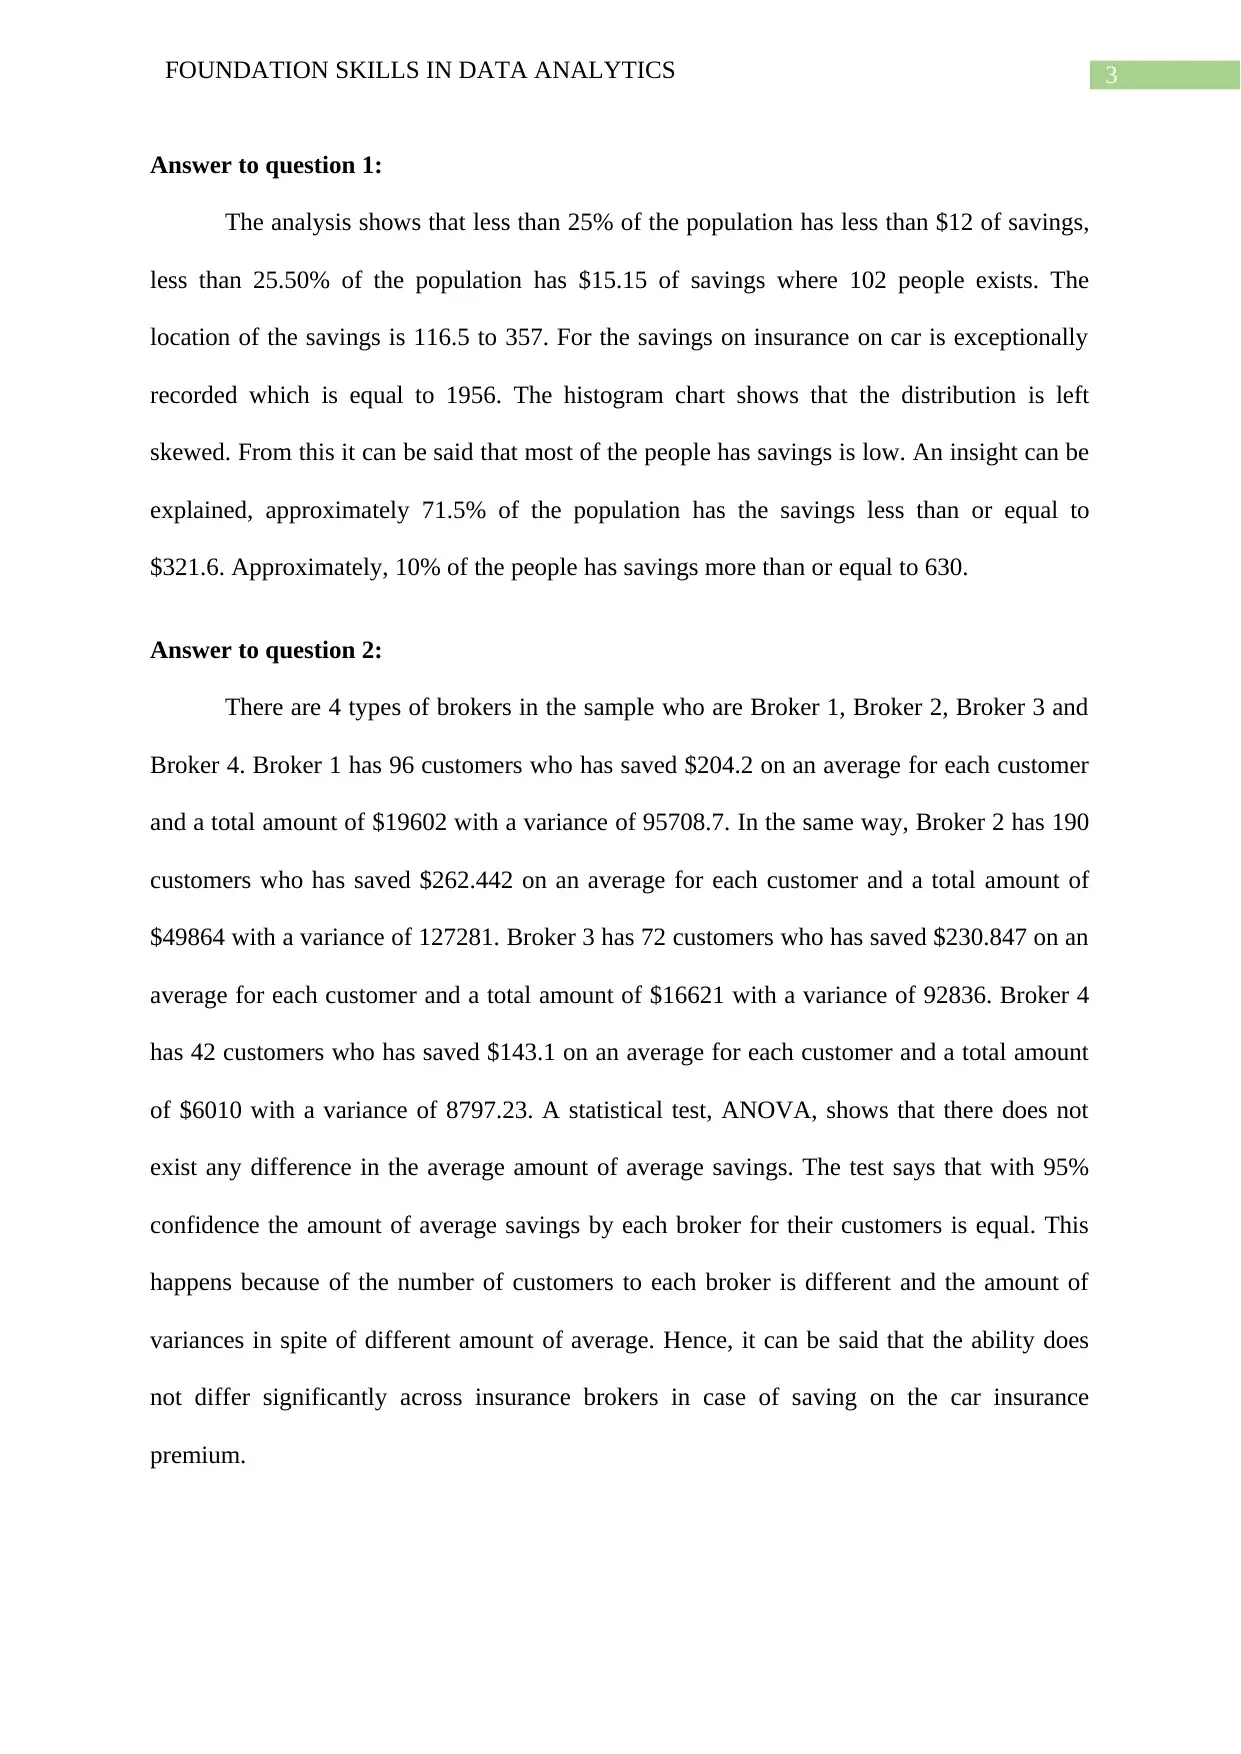
This report, prepared for Financial Review Magazine, presents a comprehensive data analysis of car insurance brokerage services. The analysis examines various aspects, including customer savings, satisfaction levels, and factors influencing insurance premiums. The study investigates the savings achieved by different brokers, revealing that the average savings is $230.24 and a significant variation exists across the sample. The report also assesses customer satisfaction, finding that most customers are satisfied with their brokers' services. Statistical tests, such as ANOVA and regression analysis, are employed to identify key factors affecting premiums, with car value emerging as a significant predictor. The analysis also addresses the proportion of customers worse off using a broker and evaluates the validity of previous industry reports. The findings suggest that while brokers offer savings, the extent varies, and not all customers benefit equally. The report concludes with recommendations for the magazine's innovative business feature section, offering valuable insights into the car insurance brokerage market.

Running head: FOUNDATION SKILLS IN DATA ANALYTICS
Foundation Skills in Data Analytics
Name of the Student:
Name of the University:
Author Note:
Foundation Skills in Data Analytics
Name of the Student:
Name of the University:
Author Note:
Paraphrase This Document
Need a fresh take? Get an instant paraphrase of this document with our AI Paraphraser

1FOUNDATION SKILLS IN DATA ANALYTICS
Table of Contents
Memorandum.............................................................................................................................2
Answer to question 1:.................................................................................................................2
Answer to question 2:.................................................................................................................3
Answer to question 3:.................................................................................................................3
Answer to question 4:.................................................................................................................4
Answer to question 5:.................................................................................................................5
Answer to question 6:.................................................................................................................5
Answer to question 7:.................................................................................................................5
Answer to question 8:.................................................................................................................5
Answer to question 9:.................................................................................................................6

2FOUNDATION SKILLS IN DATA ANALYTICS
Memorandum
To: Paul Anderson
From: Emma Thomson
Subject: Analysis of car insurance brokerage services
Dear Paul,
Emma Thomson, as a data analyst in the Research and Analysis Group at Financial
Review Magazine, needs to report results of data analysis to senior editors at the Magazine.
Primary role of the Research and Analysis Group is to evaluate new financial products and
services and provide advice on matters affecting the company. Of specific interest to
Financial Review magazine is the increasing numbers of companies that offer brokerage
services for car insurance and potentially what this means for consumers. As, an insurance
broker and an independent insurance agent who works with many insurance companies to
find the very best available policies for his or her customers. Most of these brokers are
advertising that they are able to save owners of motor vehicles hundreds of dollars each year
on insurance.
In response of the specific concern regarding the purchased dataset, several analytical
tests and techniques are used to calculate, estimate and the evidences for previously asked
questions. The outputs are extracted using the Excel and the answers are discussed in the
below section which will help to write about Car Insurance Brokerage in the innovative
business feature section of the next issue.
⊘ This is a preview!⊘
Do you want full access?
Subscribe today to unlock all pages.

Trusted by 1+ million students worldwide

3FOUNDATION SKILLS IN DATA ANALYTICS
Answer to question 1:
The analysis shows that less than 25% of the population has less than $12 of savings,
less than 25.50% of the population has $15.15 of savings where 102 people exists. The
location of the savings is 116.5 to 357. For the savings on insurance on car is exceptionally
recorded which is equal to 1956. The histogram chart shows that the distribution is left
skewed. From this it can be said that most of the people has savings is low. An insight can be
explained, approximately 71.5% of the population has the savings less than or equal to
$321.6. Approximately, 10% of the people has savings more than or equal to 630.
Answer to question 2:
There are 4 types of brokers in the sample who are Broker 1, Broker 2, Broker 3 and
Broker 4. Broker 1 has 96 customers who has saved $204.2 on an average for each customer
and a total amount of $19602 with a variance of 95708.7. In the same way, Broker 2 has 190
customers who has saved $262.442 on an average for each customer and a total amount of
$49864 with a variance of 127281. Broker 3 has 72 customers who has saved $230.847 on an
average for each customer and a total amount of $16621 with a variance of 92836. Broker 4
has 42 customers who has saved $143.1 on an average for each customer and a total amount
of $6010 with a variance of 8797.23. A statistical test, ANOVA, shows that there does not
exist any difference in the average amount of average savings. The test says that with 95%
confidence the amount of average savings by each broker for their customers is equal. This
happens because of the number of customers to each broker is different and the amount of
variances in spite of different amount of average. Hence, it can be said that the ability does
not differ significantly across insurance brokers in case of saving on the car insurance
premium.
Paraphrase This Document
Need a fresh take? Get an instant paraphrase of this document with our AI Paraphraser

4FOUNDATION SKILLS IN DATA ANALYTICS
Answer to question 3:
In the sample, there are 25.5% of customers are very satisfied and 5.5% of the total
customers are very dissatisfied with the insurance broker. Proportionately, most of the
customers responded as they are satisfied with the insurance broker. The minimum response
is recoded for very dissatisfied level of satisfaction which is equal to 5.5%. This simply
implies that the service of the brokers are performing well according to the customers of the
car insurance.
Next, there is a statistical test that checks whether the gender and the area of living
changes the level of satisfaction. First, it is checked with the variable gender and the
satisfaction level. The result says there is no change in the satisfaction level depending on the
gender of the customer. Further there is another test to check the change in the satisfaction
level depending on the area of living of the customer. In this case, the test shows some results
that explains no significant change in the satisfaction level depending on the area of living.
In this case, it can be said that the gender and the area of living does not change the
customers rating for their broking services.
Answer to question 4:
A regression analysis is conducted which says that the factors like, car age, car value,
license held (years) and excess can explain 69.87% of the variation in the current insurance
premiums. Another statistics of the test result shows that these variables are important enough
in order to predict the current insurance premium. The variable car value is the only variable
that has a significant impact on the current insurance premium. It can be said from result that
there is a positive relation between car value and the insurance premium which says if there is
a rise in car value then the insurance premium will also rise. It is also found that if there will
be a rise of $0.005 in the current insurance premium due to one unit rise in the value of car

5FOUNDATION SKILLS IN DATA ANALYTICS
while other factors remain same. Moreover, there is a fixed effect which is equal to $388.8 on
the current insurance premium which is significant and does not depend on the other
variables.
Answer to question 5:
Based on the sample of 400 insurance customers, it is found that the range is $2043
which lies between worse of $87 and a savings of $1956. In the sample, the average amount
of annual savings on car insurance premium is $230.24 and 50% of the customers’ savings is
less than $116.50 while $0 is the most frequent amount of savings recorded in the sample.
Moreover, there exist a huge variation in the sample which is $320.42 on an average.
Answer to question 6:
The number of customers that are worse off using a broker is 72 which is 18% of the
sample where the sample size is 400. Hence the proportion of the customers that are worse
off using a broker is 0.18. The 95% confidence interval for the customers who are worse off
using a broker is computed and it is (0.1423, 0.2177). This implies that the proportion of
customers that are worse off using a broker with 95% confidence will between 0.1423 and
0.2177.
Answer to question 7:
There is a statistical test which is conducted on the given data set to find evidences for
the report of National Insurance Brokers Association which was published two years ago and
states that the average savings on car insurance premium is around $260. The test statistical
test is one sample t-test which and it considers the hypothesized mean as $260 as the reported
mean is to be checked. The test result provides evidences against the argument of the report
⊘ This is a preview!⊘
Do you want full access?
Subscribe today to unlock all pages.

Trusted by 1+ million students worldwide

6FOUNDATION SKILLS IN DATA ANALYTICS
published by National Insurance Brokers Association. The mean value of savings on car
insurance premium is not around $260 and the estimated mean is $230.42.
Answer to question 8:
The study says male customers of car insurance are less likely to wish to get the
services of an insurance broker than the females and they have estimated the proportion of
males which is less than 40% who use the car insurance brokers. On the response of the study
a statistical test is conducted where the null hypothesis is like 40% of male uses the car
insurance broker and the alternative hypothesis is like less than 40% of male uses the car
insurance broker. This means that the test is one tailed. The sample proportion test is
conducted. The test is conducted with 0.05 significance level. The computed z-stat is 0.7097
with a p-value of 0.7611. The z-stat is not greater than the critical z-stat at 0.05 level of
significance. Hence, the test result does not provide enough evidence to reject the null
hypothesis. So, it is not possible to conclude that the males are less likely to wish to get the
services of an insurance broker than females.
Answer to question 9:
In order to sample sufficient customers for estimation of the average amount of saving
by the brokers on car insurance premiums to less than $50, sample size is determined by
using the statistical methods. The sampling error is said to be 5%. Using the formula of
calculating sample size with margin error gives a number in fraction. Hence, the approximate
minimum amount of sample is 352 which is needed to estimate the average amount of saving
by the brokers on car insurance premiums to less than $50.
The above analysis is done in Excel and here, the short report presents the summary
of the analysis. This includes the finding that 10% of the people has savings more than or
equal to 630. This implies brokers are saving only for few people with a huge amount which
Paraphrase This Document
Need a fresh take? Get an instant paraphrase of this document with our AI Paraphraser

7FOUNDATION SKILLS IN DATA ANALYTICS
affects the sample mean. Again, the amount of average savings by each broker for their
customers is equal though the number of customers is different. Most of the customers
responded as they are satisfied with the insurance broker. The analysis says that the factors
like, car age, car value, license held (years) and excess can explain 69.87% of the variation in
the current insurance premiums.
The minimum response is recoded for very dissatisfied level of satisfaction which is
equal to 5.5%. This implies that the service from the brokers is very good and reliable. The
proportion of customers that are worse off using a broker with 95% confidence will lie
between 0.1423 and 0.2177. This implies that maximum of 20% and a minimum of 14.23%
customers may get negative amount of savings with 95% confidence. The variable car value
is the only variable that has a significant impact on the current insurance premium. There will
be a rise of $0.005 in the current insurance premium due to one unit rise in the value of car
while other factors remain same. Moreover, there is a fixed effect which is equal to $388.8 on
the current insurance premium which is significant and does not depend on the other
variables. The statement in the study, “Male customers of car insurance are less likely to wish
to get the services of an insurance broker than the females and they have estimated the
proportion of males which is less than 40% who use the car insurance brokers”. This
statement may not be true with 95% significance level as per the statistical results. The
approximate minimum amount of sample is 352 which is needed to estimate the average
amount of saving by the brokers on car insurance premiums to less than $50.

8FOUNDATION SKILLS IN DATA ANALYTICS
.
.
⊘ This is a preview!⊘
Do you want full access?
Subscribe today to unlock all pages.

Trusted by 1+ million students worldwide
1 out of 9
Related Documents

Your All-in-One AI-Powered Toolkit for Academic Success.
+13062052269
info@desklib.com
Available 24*7 on WhatsApp / Email
Unlock your academic potential
Copyright © 2020–2025 A2Z Services. All Rights Reserved. Developed and managed by ZUCOL.