Intermediate Management Accounting Case Study: Financial Analysis
VerifiedAdded on 2023/04/19
|14
|2267
|106
Case Study
AI Summary
This case study provides a comprehensive analysis of intermediate management accounting principles, focusing on cost allocation methods and break-even analysis. The scenario involves Digital Electronics, a New Zealand manufacturer, and its Canadian subsidiary producing two products, Delta 1 and Delta 2. Part I examines traditional cost allocation, calculating break-even sales volume and target profit achievement. It identifies issues in fixed versus variable cost bifurcation and offers quantitative analysis. Part II explores activity-based costing (ABC) for more accurate overhead allocation, identifying cost drivers and recalculating product costs. The study concludes that careful process analysis is crucial for precise indirect manufacturing overhead allocation, essential for informed budgeting and decision-making. The complete solution is available on Desklib.

Intermediate Management
Accounting
Accounting
Assignment
Accounting
Accounting
Assignment
Paraphrase This Document
Need a fresh take? Get an instant paraphrase of this document with our AI Paraphraser

Prepared By
Student’s Name:
Date:
Page 1
Student’s Name:
Date:
Page 1
Table of Contents
Introduction................................................................................................................ 3
Background................................................................................................................ 4
Main Body................................................................................................................... 4
Part-I........................................................................................................................... 4
Issue Identification..................................................................................................... 4
Identification of Key Success Factors.........................................................................5
Identification of Alternatives...................................................................................... 5
Quantitative Analysis.................................................................................................. 5
Recommendation....................................................................................................... 7
Part-II.......................................................................................................................... 8
Issue Identification..................................................................................................... 8
Identification of Key Success Factors.........................................................................8
Identification of Alternatives...................................................................................... 8
Quantitative Analysis.................................................................................................. 8
Answer to Question No.1............................................................................................ 8
Recommendation..................................................................................................... 12
Conclusion................................................................................................................ 12
References................................................................................................................... 13
Page 2
⊘ This is a preview!⊘
Do you want full access?
Subscribe today to unlock all pages.
Trusted by 1+ million students worldwide
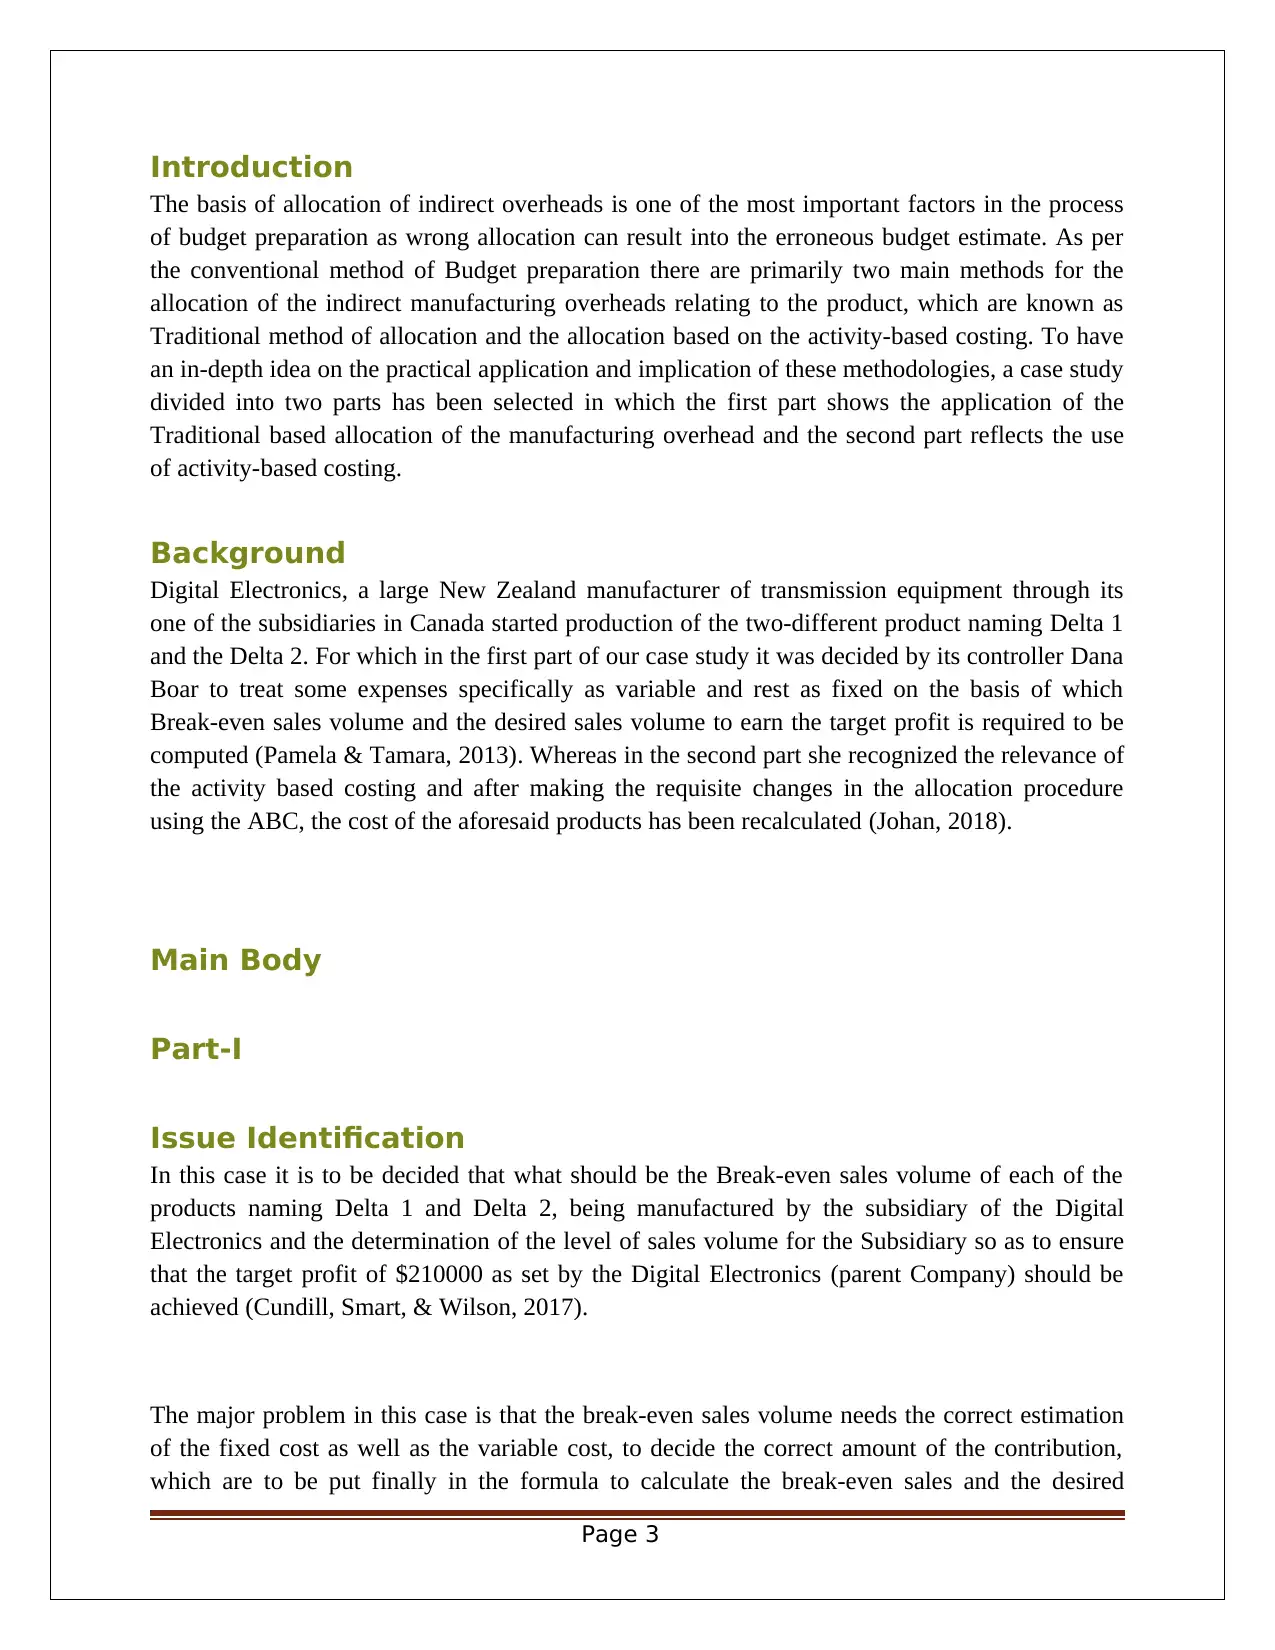
Introduction
The basis of allocation of indirect overheads is one of the most important factors in the process
of budget preparation as wrong allocation can result into the erroneous budget estimate. As per
the conventional method of Budget preparation there are primarily two main methods for the
allocation of the indirect manufacturing overheads relating to the product, which are known as
Traditional method of allocation and the allocation based on the activity-based costing. To have
an in-depth idea on the practical application and implication of these methodologies, a case study
divided into two parts has been selected in which the first part shows the application of the
Traditional based allocation of the manufacturing overhead and the second part reflects the use
of activity-based costing.
Background
Digital Electronics, a large New Zealand manufacturer of transmission equipment through its
one of the subsidiaries in Canada started production of the two-different product naming Delta 1
and the Delta 2. For which in the first part of our case study it was decided by its controller Dana
Boar to treat some expenses specifically as variable and rest as fixed on the basis of which
Break-even sales volume and the desired sales volume to earn the target profit is required to be
computed (Pamela & Tamara, 2013). Whereas in the second part she recognized the relevance of
the activity based costing and after making the requisite changes in the allocation procedure
using the ABC, the cost of the aforesaid products has been recalculated (Johan, 2018).
Main Body
Part-I
Issue Identification
In this case it is to be decided that what should be the Break-even sales volume of each of the
products naming Delta 1 and Delta 2, being manufactured by the subsidiary of the Digital
Electronics and the determination of the level of sales volume for the Subsidiary so as to ensure
that the target profit of $210000 as set by the Digital Electronics (parent Company) should be
achieved (Cundill, Smart, & Wilson, 2017).
The major problem in this case is that the break-even sales volume needs the correct estimation
of the fixed cost as well as the variable cost, to decide the correct amount of the contribution,
which are to be put finally in the formula to calculate the break-even sales and the desired
Page 3
Paraphrase This Document
Need a fresh take? Get an instant paraphrase of this document with our AI Paraphraser
volume of sales to earn the target profit. Hence in the given case the wrong bifurcation of the
expenses between fixed and variable overhead shall provide the wrong amount of the BEP sales
volume and the desired sales volume to achieve the target profit (Charles H, Giovanna, Dennis
M, & Robin W, 2015).
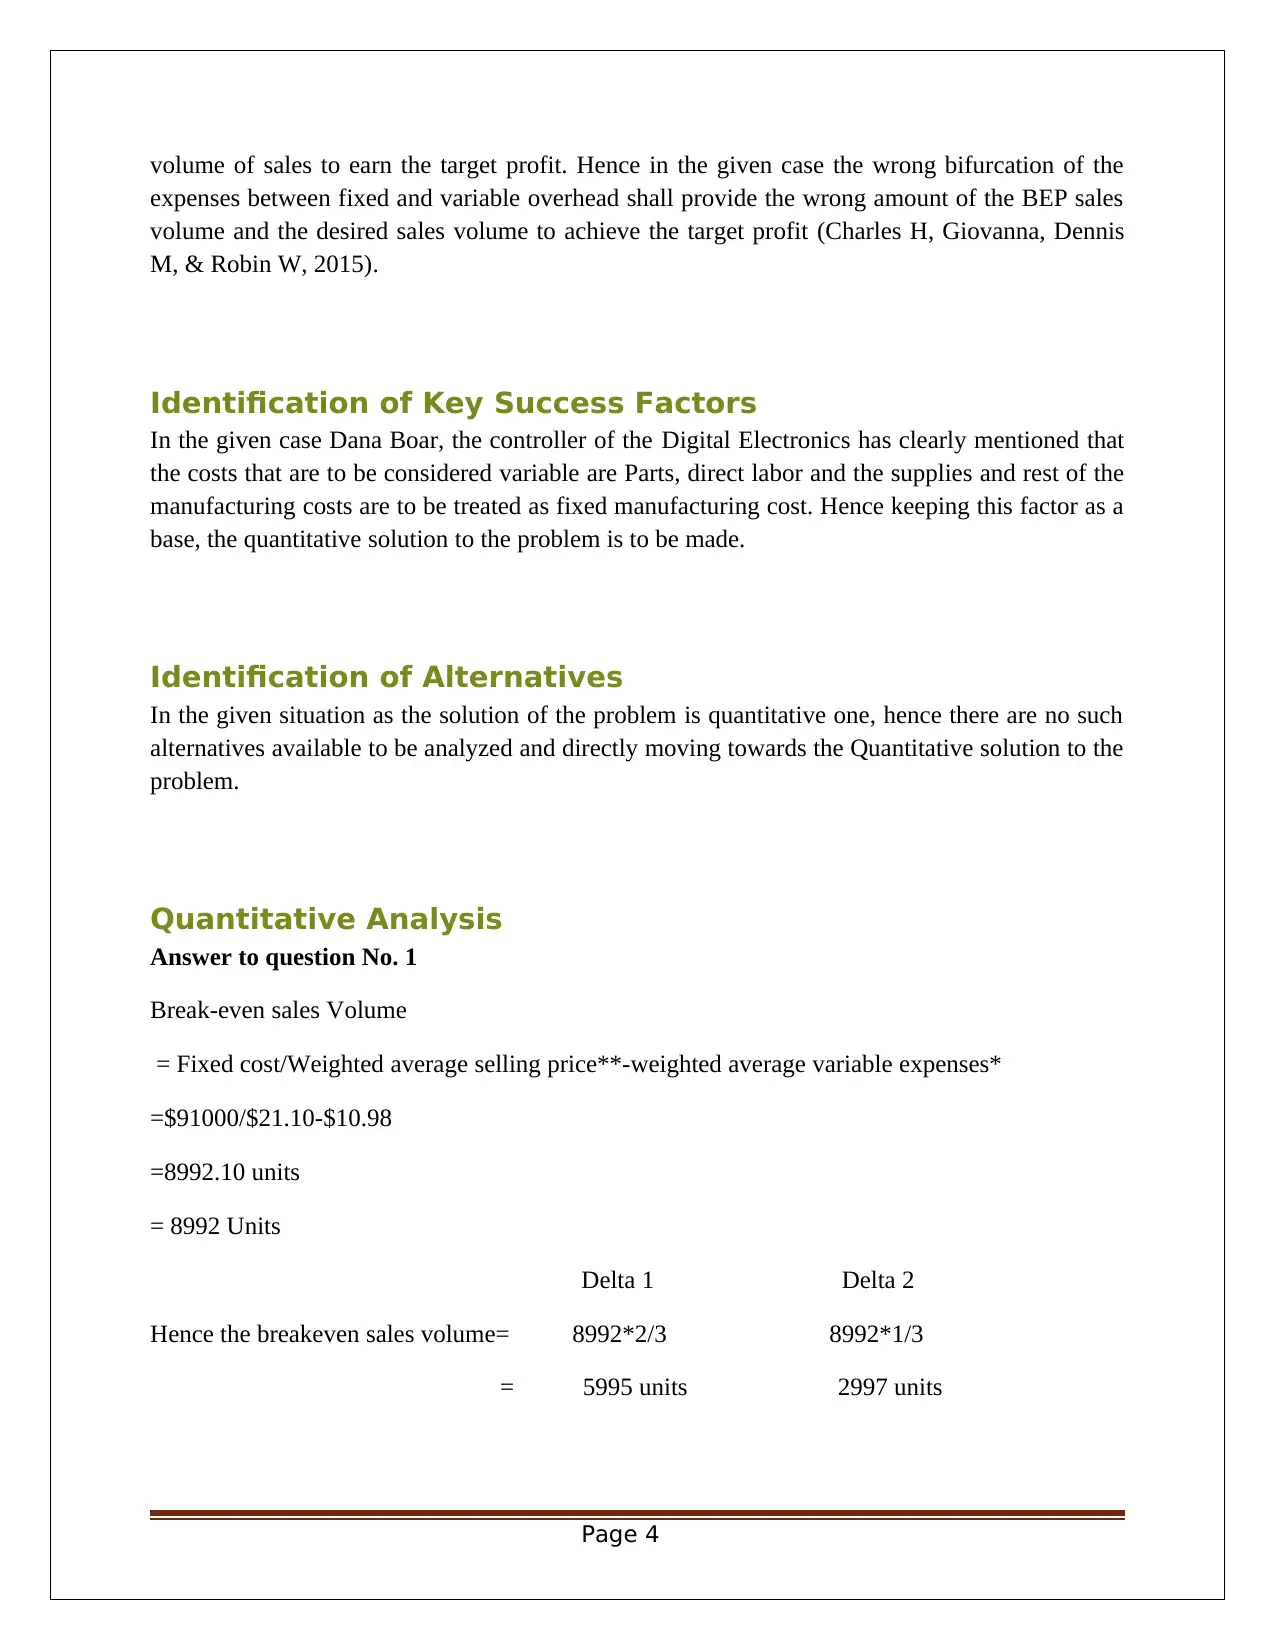
Identification of Key Success Factors
In the given case Dana Boar, the controller of the Digital Electronics has clearly mentioned that
the costs that are to be considered variable are Parts, direct labor and the supplies and rest of the
manufacturing costs are to be treated as fixed manufacturing cost. Hence keeping this factor as a
base, the quantitative solution to the problem is to be made.
Identification of Alternatives
In the given situation as the solution of the problem is quantitative one, hence there are no such
alternatives available to be analyzed and directly moving towards the Quantitative solution to the
problem.
Quantitative Analysis
Answer to question No. 1
Break-even sales Volume
= Fixed cost/Weighted average selling price**-weighted average variable expenses*
=$91000/$21.10-$10.98
=8992.10 units
= 8992 Units
Delta 1 Delta 2
Hence the breakeven sales volume= 8992*2/3 8992*1/3
= 5995 units 2997 units
Page 4
expenses between fixed and variable overhead shall provide the wrong amount of the BEP sales
volume and the desired sales volume to achieve the target profit (Charles H, Giovanna, Dennis
M, & Robin W, 2015).
Identification of Key Success Factors
In the given case Dana Boar, the controller of the Digital Electronics has clearly mentioned that
the costs that are to be considered variable are Parts, direct labor and the supplies and rest of the
manufacturing costs are to be treated as fixed manufacturing cost. Hence keeping this factor as a
base, the quantitative solution to the problem is to be made.
Identification of Alternatives
In the given situation as the solution of the problem is quantitative one, hence there are no such
alternatives available to be analyzed and directly moving towards the Quantitative solution to the
problem.
Quantitative Analysis
Answer to question No. 1
Break-even sales Volume
= Fixed cost/Weighted average selling price**-weighted average variable expenses*
=$91000/$21.10-$10.98
=8992.10 units
= 8992 Units
Delta 1 Delta 2
Hence the breakeven sales volume= 8992*2/3 8992*1/3
= 5995 units 2997 units
Page 4
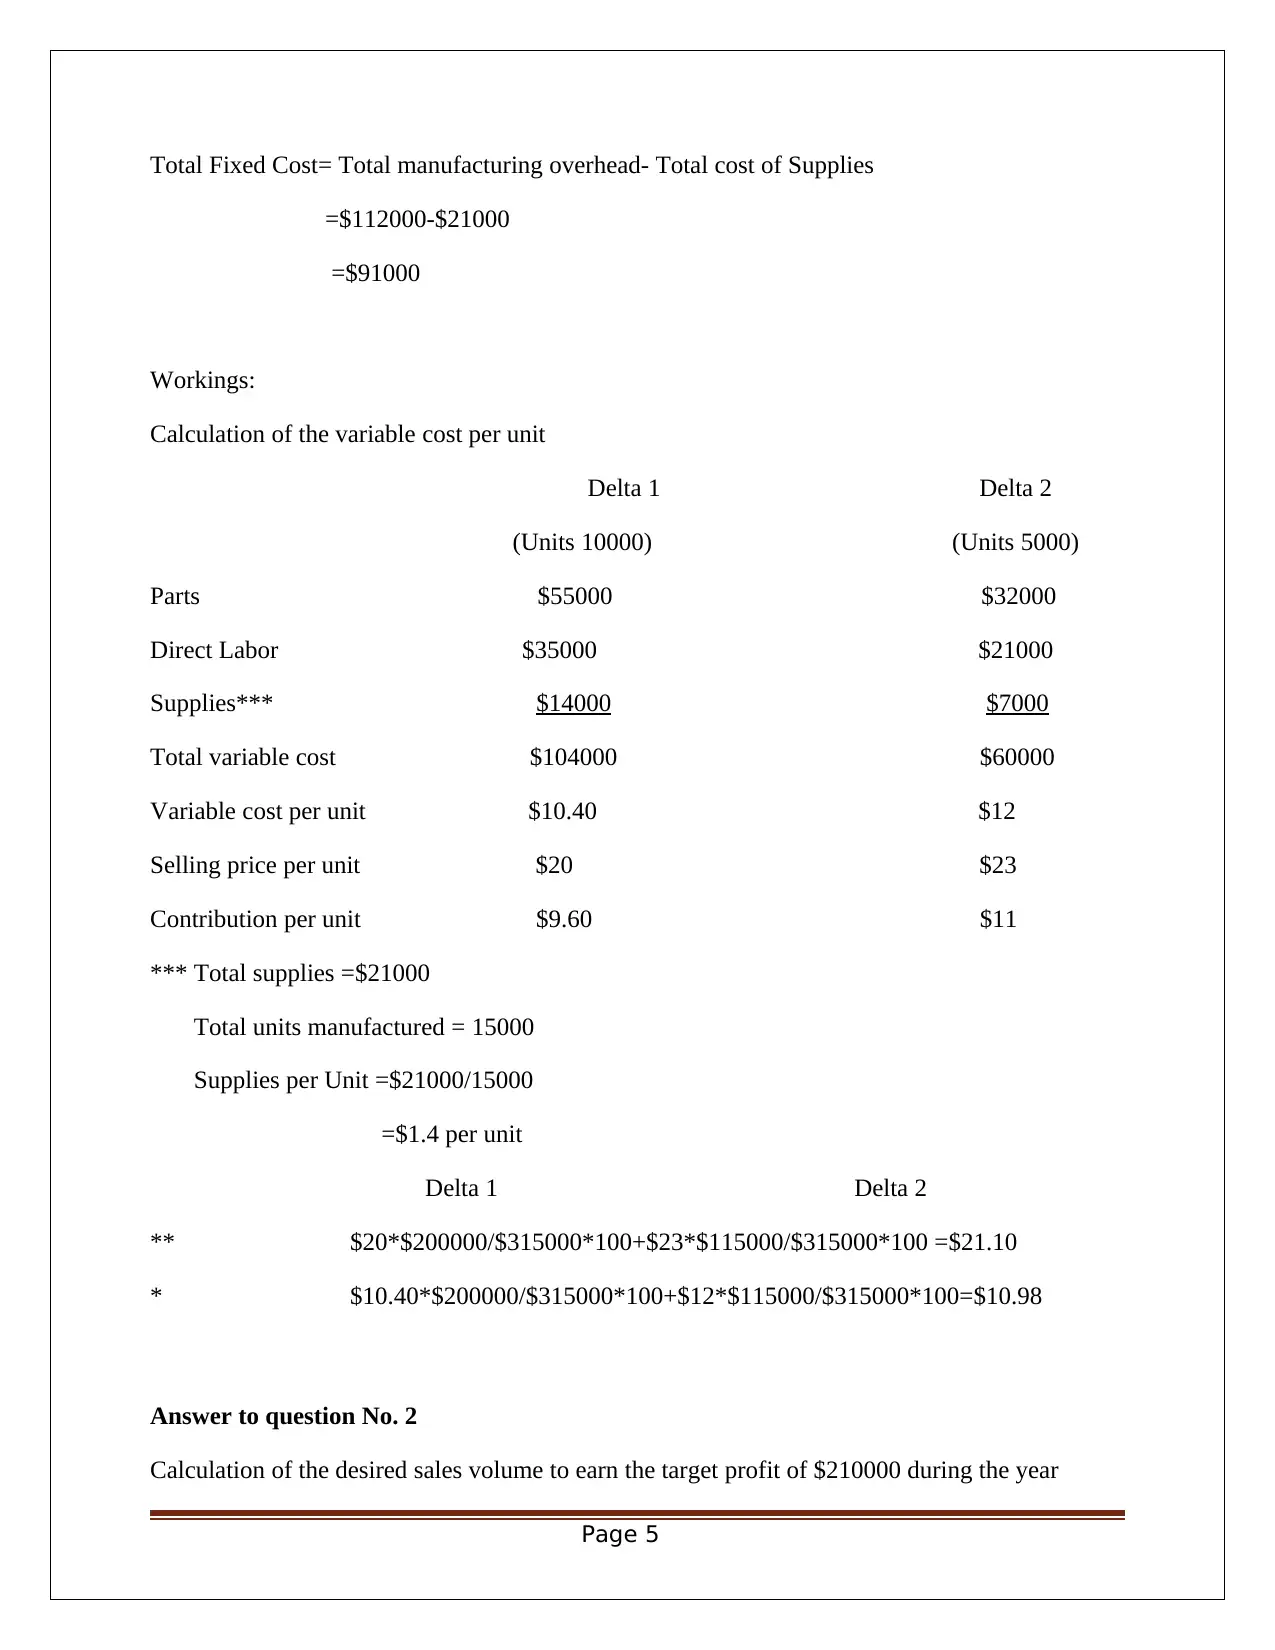
Total Fixed Cost= Total manufacturing overhead- Total cost of Supplies
=$112000-$21000
=$91000
Workings:
Calculation of the variable cost per unit
Delta 1 Delta 2
(Units 10000) (Units 5000)
Parts $55000 $32000
Direct Labor $35000 $21000
Supplies*** $14000 $7000
Total variable cost $104000 $60000
Variable cost per unit $10.40 $12
Selling price per unit $20 $23
Contribution per unit $9.60 $11
*** Total supplies =$21000
Total units manufactured = 15000
Supplies per Unit =$21000/15000
=$1.4 per unit
Delta 1 Delta 2
** $20*$200000/$315000*100+$23*$115000/$315000*100 =$21.10
* $10.40*$200000/$315000*100+$12*$115000/$315000*100=$10.98
Answer to question No. 2
Calculation of the desired sales volume to earn the target profit of $210000 during the year
Page 5
⊘ This is a preview!⊘
Do you want full access?
Subscribe today to unlock all pages.
Trusted by 1+ million students worldwide
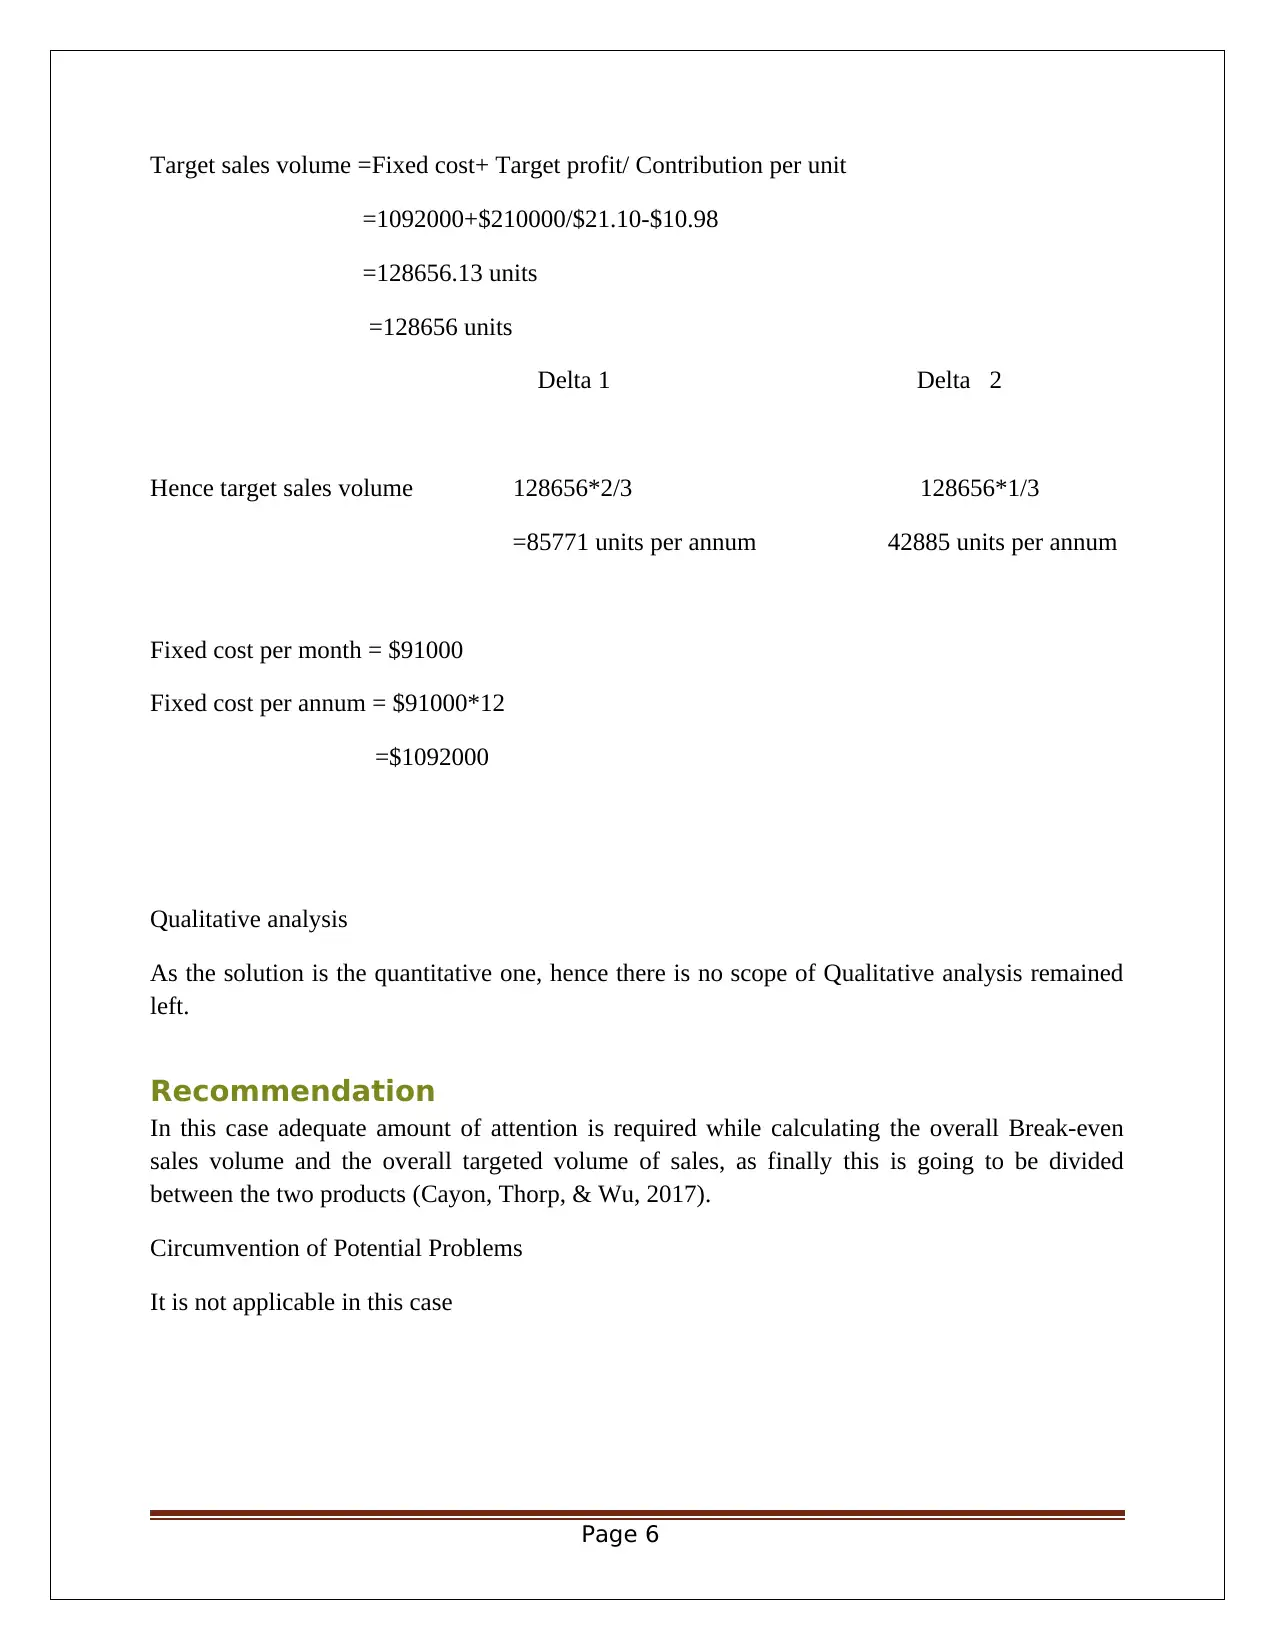
Target sales volume =Fixed cost+ Target profit/ Contribution per unit
=1092000+$210000/$21.10-$10.98
=128656.13 units
=128656 units
Delta 1 Delta 2
Hence target sales volume 128656*2/3 128656*1/3
=85771 units per annum 42885 units per annum
Fixed cost per month = $91000
Fixed cost per annum = $91000*12
=$1092000
Qualitative analysis
As the solution is the quantitative one, hence there is no scope of Qualitative analysis remained
left.
Recommendation
In this case adequate amount of attention is required while calculating the overall Break-even
sales volume and the overall targeted volume of sales, as finally this is going to be divided
between the two products (Cayon, Thorp, & Wu, 2017).
Circumvention of Potential Problems
It is not applicable in this case
Page 6
Paraphrase This Document
Need a fresh take? Get an instant paraphrase of this document with our AI Paraphraser
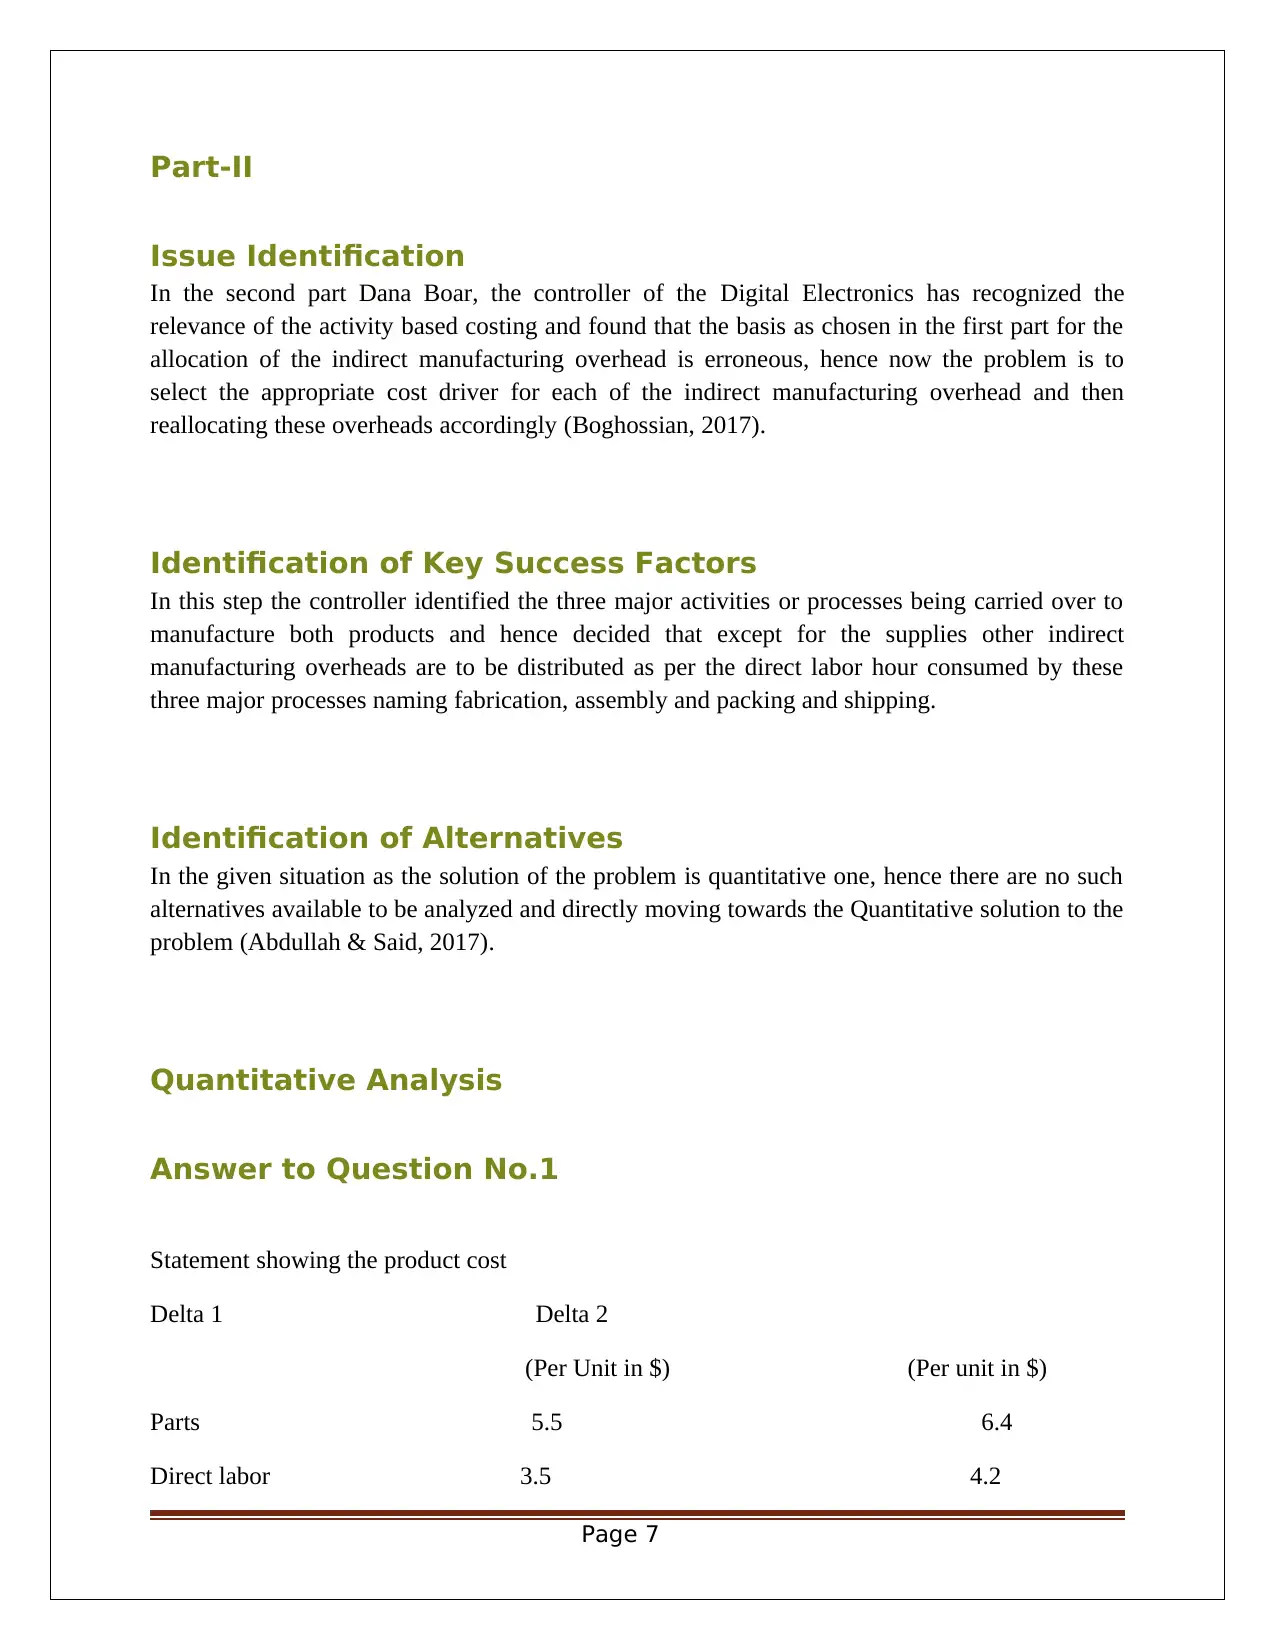
Part-II
Issue Identification
In the second part Dana Boar, the controller of the Digital Electronics has recognized the
relevance of the activity based costing and found that the basis as chosen in the first part for the
allocation of the indirect manufacturing overhead is erroneous, hence now the problem is to
select the appropriate cost driver for each of the indirect manufacturing overhead and then
reallocating these overheads accordingly (Boghossian, 2017).
Identification of Key Success Factors
In this step the controller identified the three major activities or processes being carried over to
manufacture both products and hence decided that except for the supplies other indirect
manufacturing overheads are to be distributed as per the direct labor hour consumed by these
three major processes naming fabrication, assembly and packing and shipping.
Identification of Alternatives
In the given situation as the solution of the problem is quantitative one, hence there are no such
alternatives available to be analyzed and directly moving towards the Quantitative solution to the
problem (Abdullah & Said, 2017).
Quantitative Analysis
Answer to Question No.1
Statement showing the product cost
Delta 1 Delta 2
(Per Unit in $) (Per unit in $)
Parts 5.5 6.4
Direct labor 3.5 4.2
Page 7
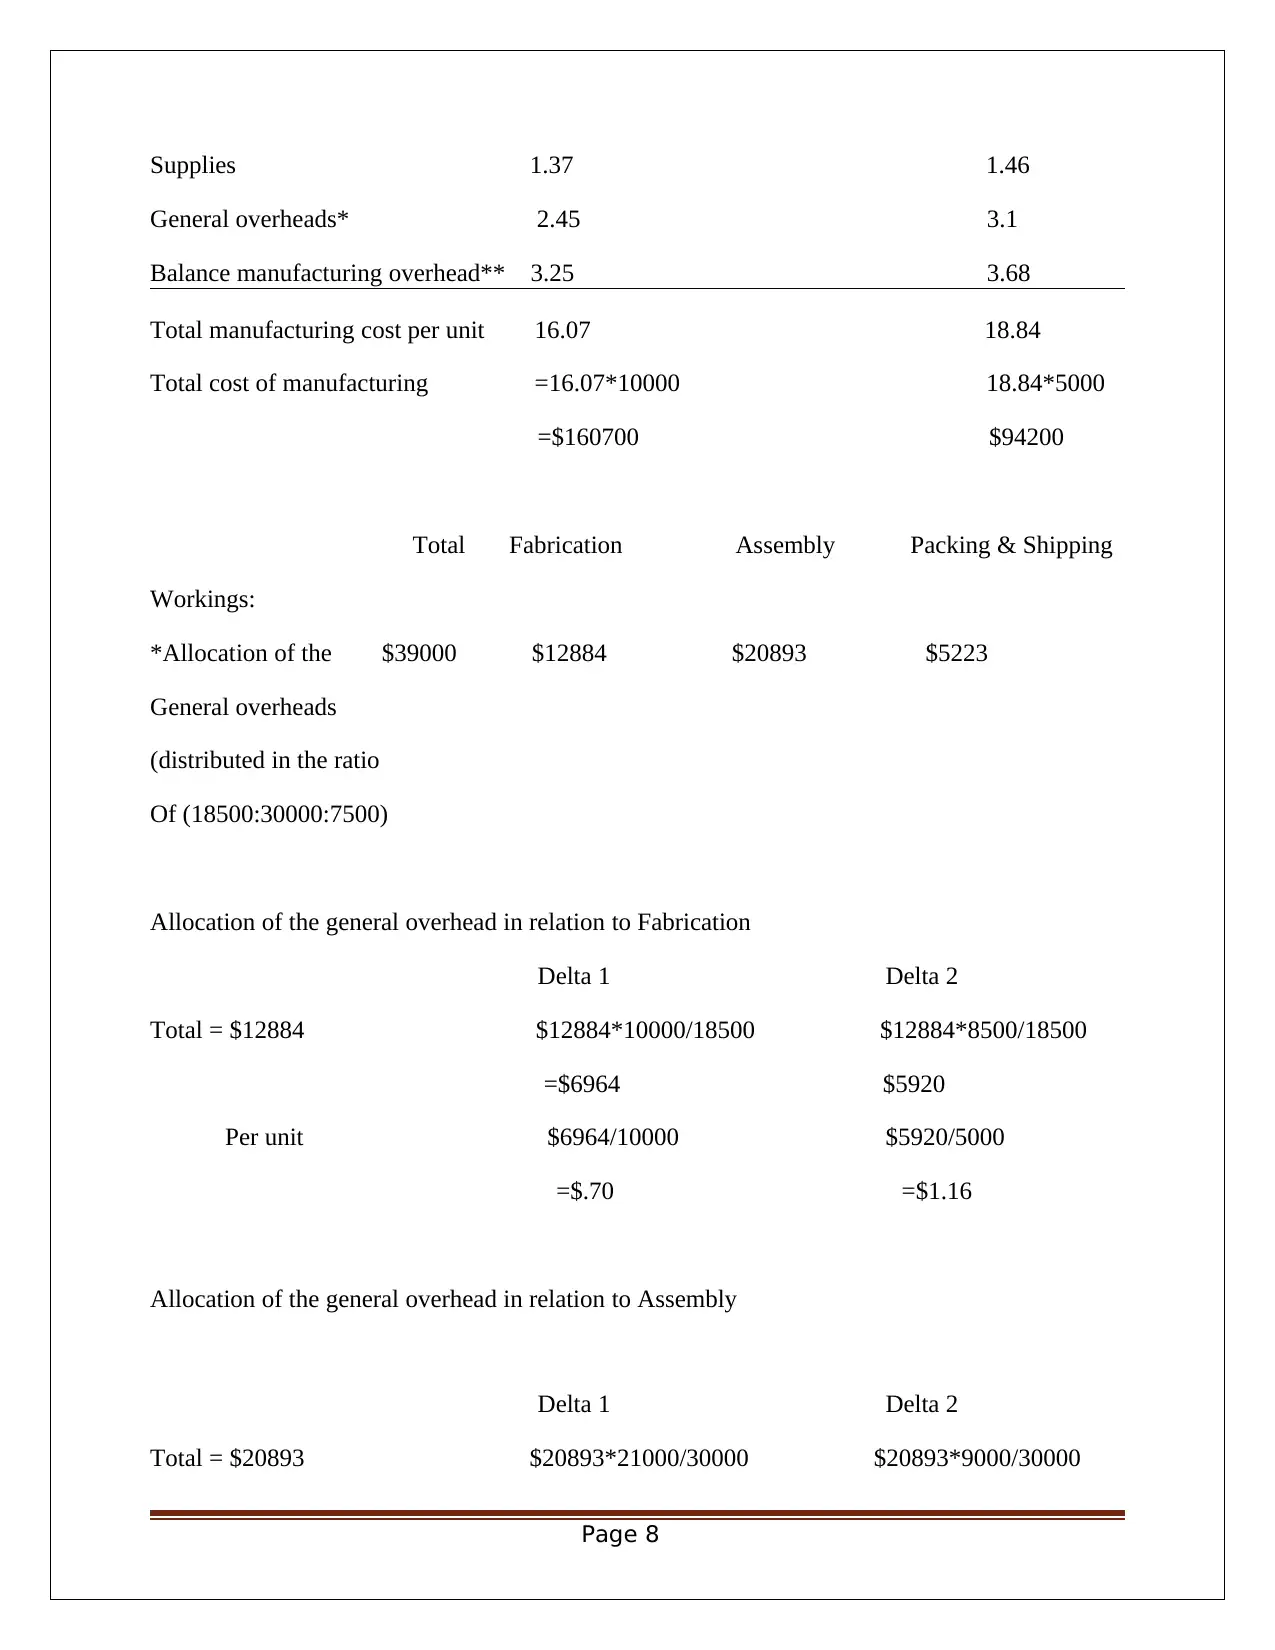
Supplies 1.37 1.46
General overheads* 2.45 3.1
Balance manufacturing overhead** 3.25 3.68
Total manufacturing cost per unit 16.07 18.84
Total cost of manufacturing =16.07*10000 18.84*5000
=$160700 $94200
Total Fabrication Assembly Packing & Shipping
Workings:
*Allocation of the $39000 $12884 $20893 $5223
General overheads
(distributed in the ratio
Of (18500:30000:7500)
Allocation of the general overhead in relation to Fabrication
Delta 1 Delta 2
Total = $12884 $12884*10000/18500 $12884*8500/18500
=$6964 $5920
Per unit $6964/10000 $5920/5000
=$.70 =$1.16
Allocation of the general overhead in relation to Assembly
Delta 1 Delta 2
Total = $20893 $20893*21000/30000 $20893*9000/30000
Page 8
⊘ This is a preview!⊘
Do you want full access?
Subscribe today to unlock all pages.
Trusted by 1+ million students worldwide
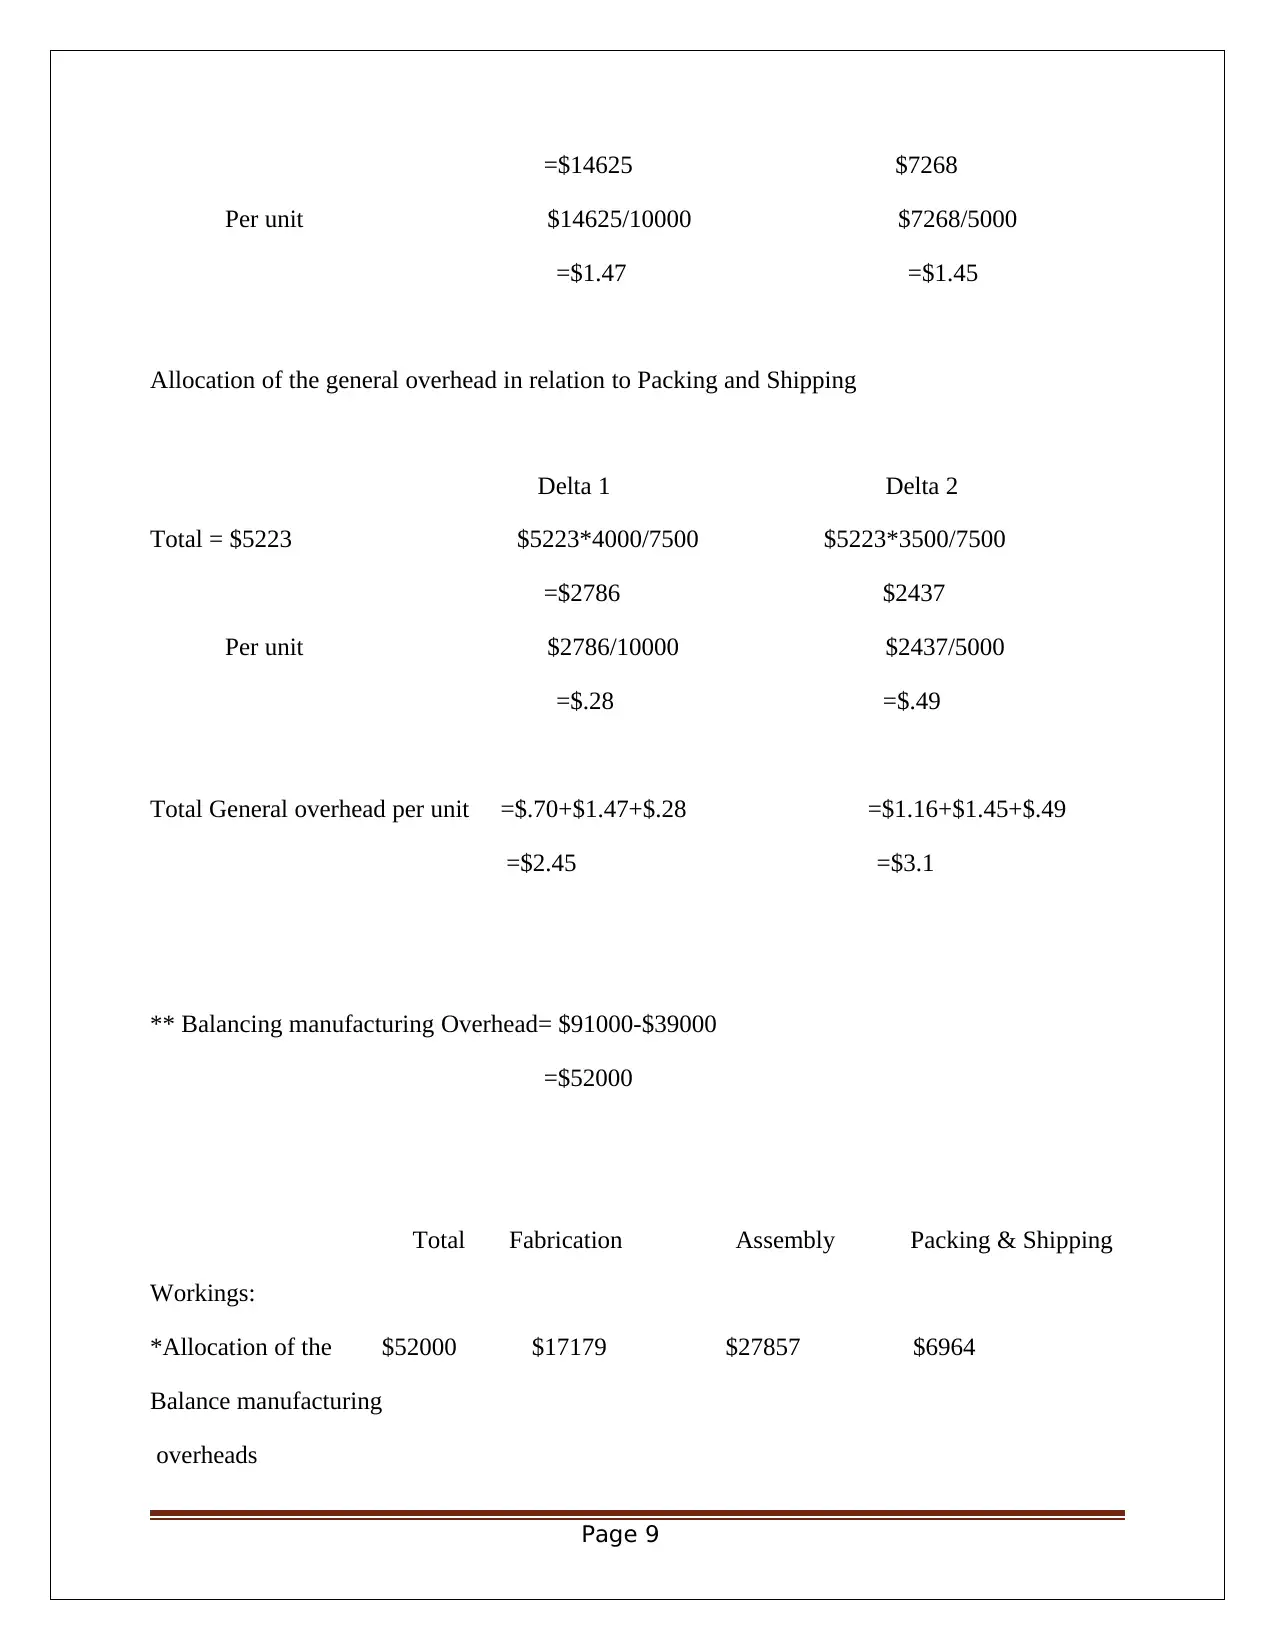
=$14625 $7268
Per unit $14625/10000 $7268/5000
=$1.47 =$1.45
Allocation of the general overhead in relation to Packing and Shipping
Delta 1 Delta 2
Total = $5223 $5223*4000/7500 $5223*3500/7500
=$2786 $2437
Per unit $2786/10000 $2437/5000
=$.28 =$.49
Total General overhead per unit =$.70+$1.47+$.28 =$1.16+$1.45+$.49
=$2.45 =$3.1
** Balancing manufacturing Overhead= $91000-$39000
=$52000
Total Fabrication Assembly Packing & Shipping
Workings:
*Allocation of the $52000 $17179 $27857 $6964
Balance manufacturing
overheads
Page 9
Paraphrase This Document
Need a fresh take? Get an instant paraphrase of this document with our AI Paraphraser
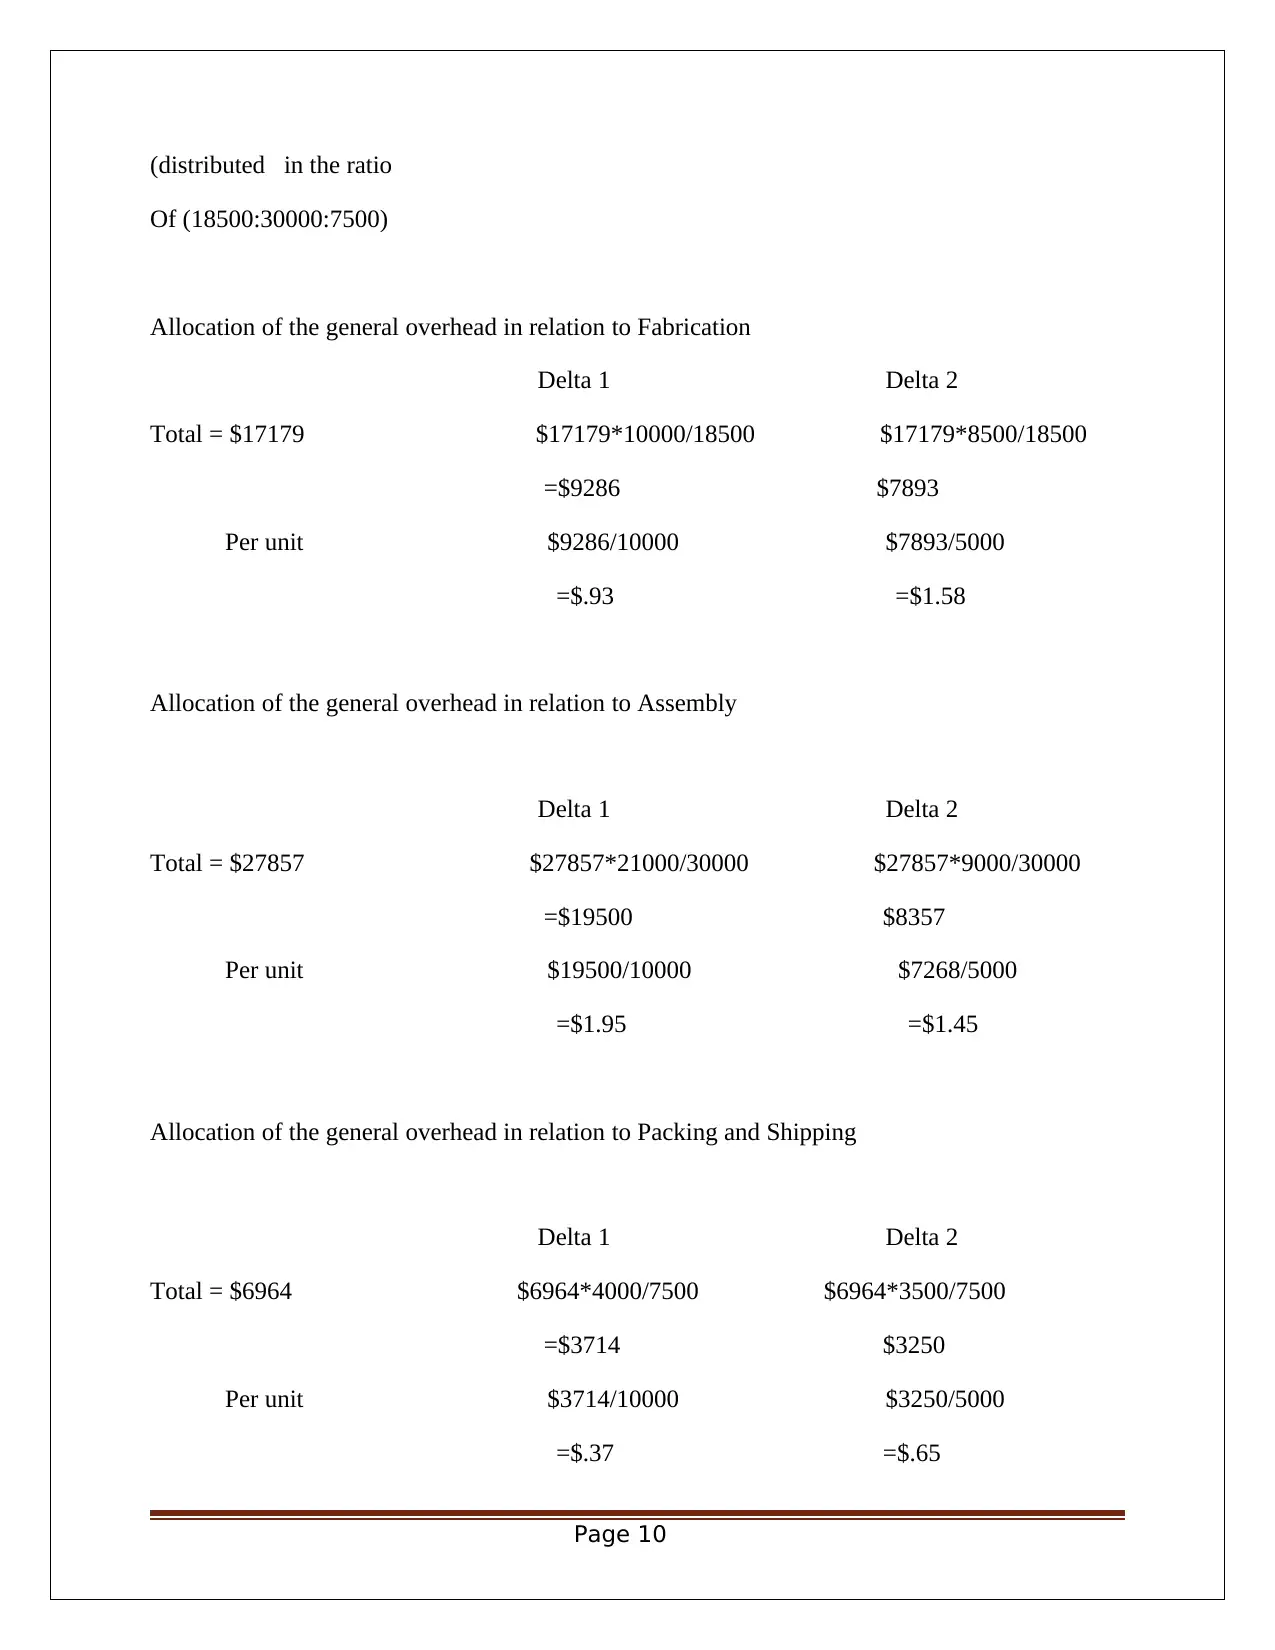
(distributed in the ratio
Of (18500:30000:7500)
Allocation of the general overhead in relation to Fabrication
Delta 1 Delta 2
Total = $17179 $17179*10000/18500 $17179*8500/18500
=$9286 $7893
Per unit $9286/10000 $7893/5000
=$.93 =$1.58
Allocation of the general overhead in relation to Assembly
Delta 1 Delta 2
Total = $27857 $27857*21000/30000 $27857*9000/30000
=$19500 $8357
Per unit $19500/10000 $7268/5000
=$1.95 =$1.45
Allocation of the general overhead in relation to Packing and Shipping
Delta 1 Delta 2
Total = $6964 $6964*4000/7500 $6964*3500/7500
=$3714 $3250
Per unit $3714/10000 $3250/5000
=$.37 =$.65
Page 10
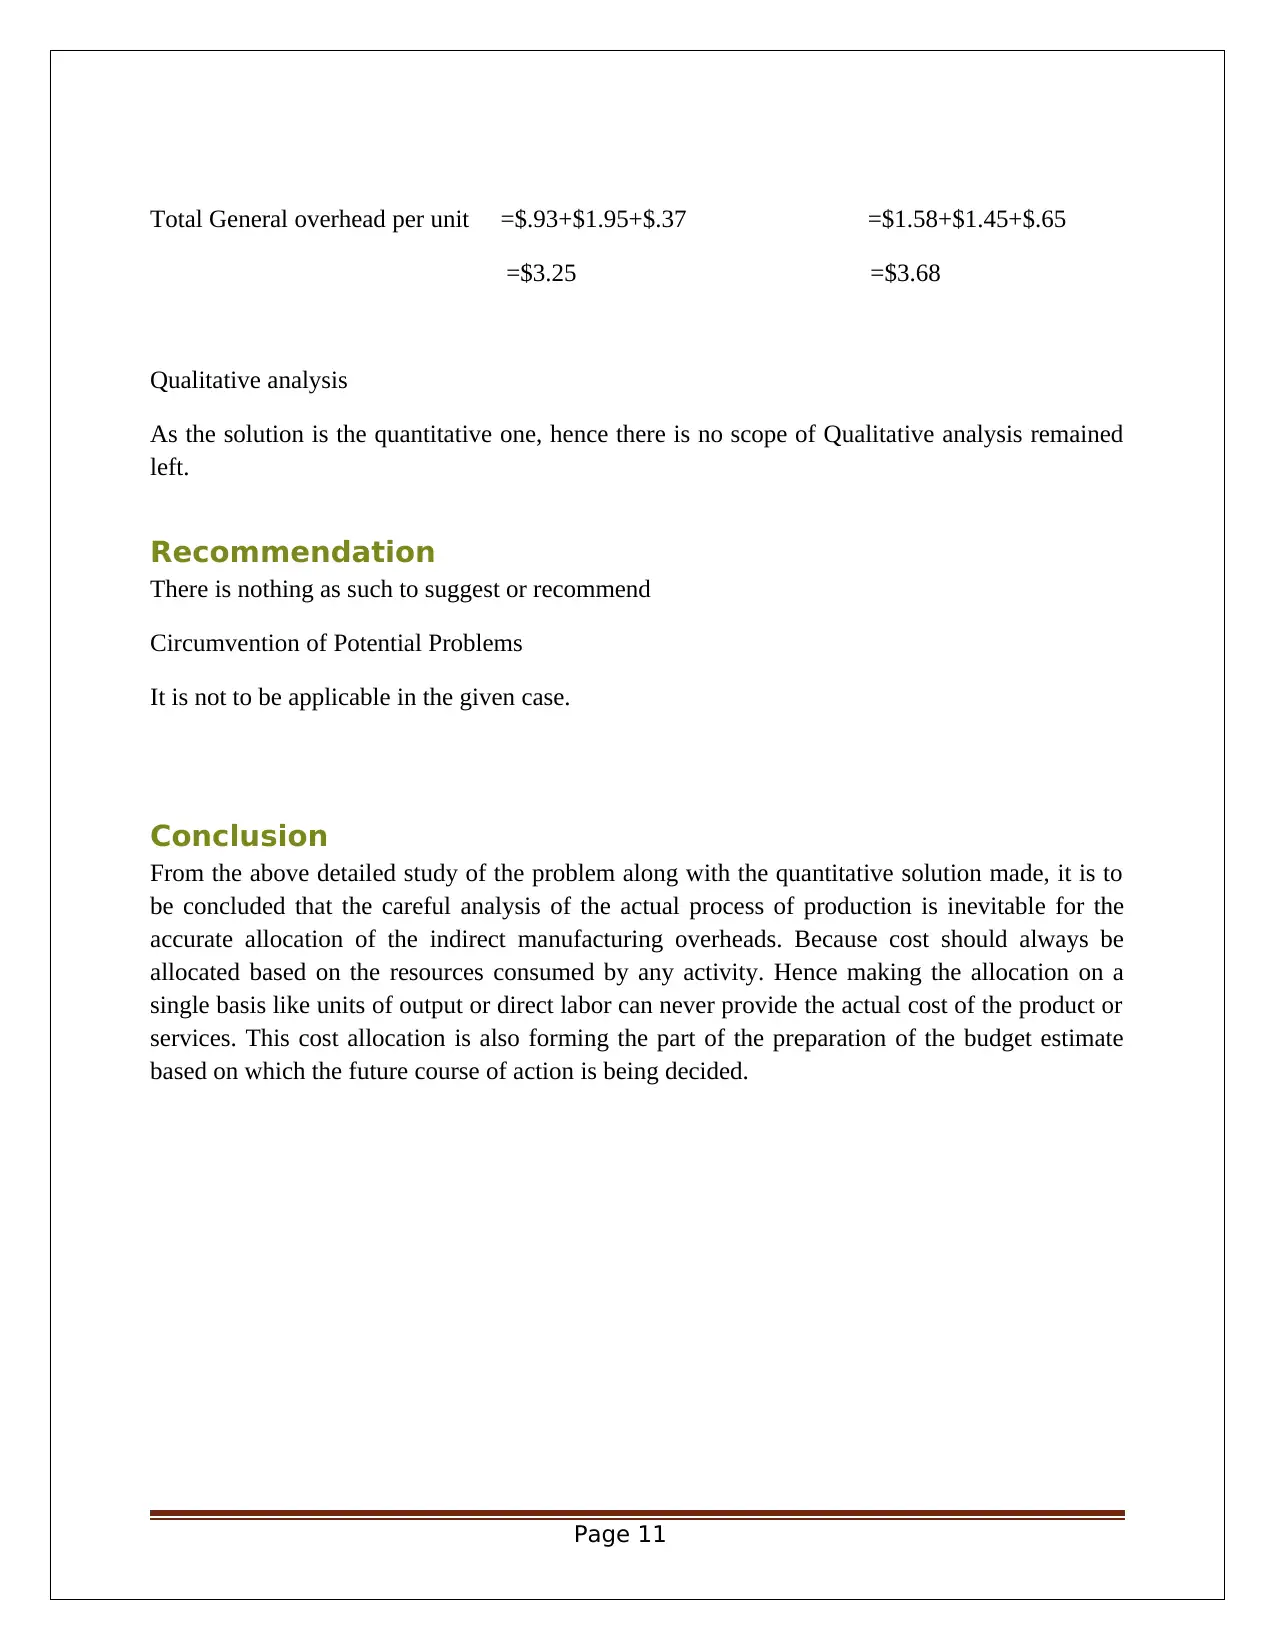
Total General overhead per unit =$.93+$1.95+$.37 =$1.58+$1.45+$.65
=$3.25 =$3.68
Qualitative analysis
As the solution is the quantitative one, hence there is no scope of Qualitative analysis remained
left.
Recommendation
There is nothing as such to suggest or recommend
Circumvention of Potential Problems
It is not to be applicable in the given case.
Conclusion
From the above detailed study of the problem along with the quantitative solution made, it is to
be concluded that the careful analysis of the actual process of production is inevitable for the
accurate allocation of the indirect manufacturing overheads. Because cost should always be
allocated based on the resources consumed by any activity. Hence making the allocation on a
single basis like units of output or direct labor can never provide the actual cost of the product or
services. This cost allocation is also forming the part of the preparation of the budget estimate
based on which the future course of action is being decided.
Page 11
⊘ This is a preview!⊘
Do you want full access?
Subscribe today to unlock all pages.
Trusted by 1+ million students worldwide
1 out of 14
Related Documents


Your All-in-One AI-Powered Toolkit for Academic Success.
+13062052269
info@desklib.com
Available 24*7 on WhatsApp / Email
![[object Object]](/_next/static/media/star-bottom.7253800d.svg)
Unlock your academic potential
Copyright © 2020–2026 A2Z Services. All Rights Reserved. Developed and managed by ZUCOL.