Economics 12: Intermediate Microeconomics Assignment - Spring 2020
VerifiedAdded on 2022/09/09
|12
|2531
|23
Homework Assignment
AI Summary
This economics assignment delves into key microeconomic concepts, including indifference curves, budget lines, and the impact of various taxes on consumer behavior. The assignment explores the choice between subsidies and monetary payments, analyzing how consumers make decisions based on budget constraints and the availability of substitute goods like bananas and apples. It examines the effects of quantity and income taxes on indifference curves, production levels, and consumer purchasing power. Furthermore, the assignment investigates the income and substitution effects, explaining how changes in income and prices influence consumer demand. Finally, it discusses the implications of a carbon tax on petrol, considering the use of tax rebates and the application of the Slutsky identity to understand how tax policies affect consumer choices and market outcomes, emphasizing the importance of considering both income and substitution effects when analyzing economic policies. The assignment is a comprehensive analysis of microeconomic principles, offering insights into consumer behavior, taxation, and market dynamics.

ECONOMICS 1
Intermediate Economics Assignment
By name
Course name and code
Professor’s name
City
Date of submission
Intermediate Economics Assignment
By name
Course name and code
Professor’s name
City
Date of submission
Paraphrase This Document
Need a fresh take? Get an instant paraphrase of this document with our AI Paraphraser
ECONOMICS 2
Question 1
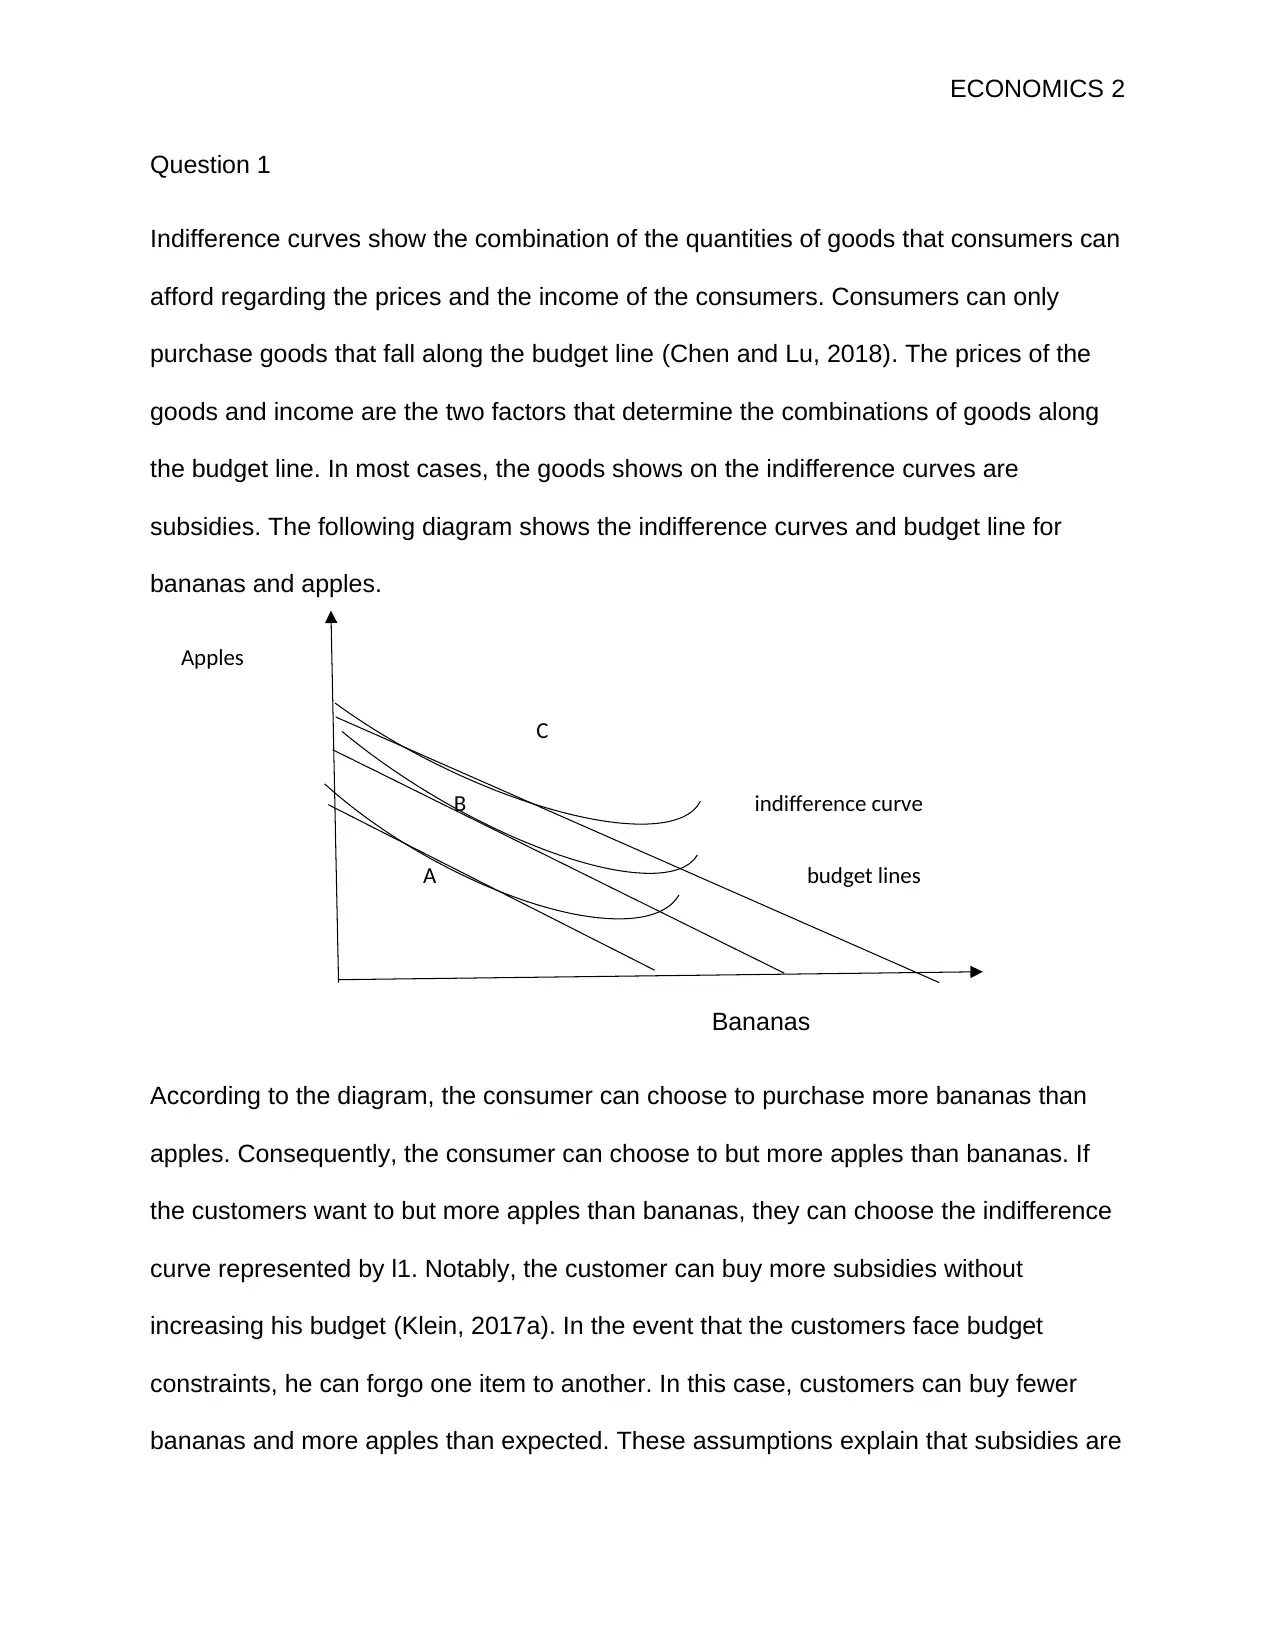
Indifference curves show the combination of the quantities of goods that consumers can
afford regarding the prices and the income of the consumers. Consumers can only
purchase goods that fall along the budget line (Chen and Lu, 2018). The prices of the
goods and income are the two factors that determine the combinations of goods along
the budget line. In most cases, the goods shows on the indifference curves are
subsidies. The following diagram shows the indifference curves and budget line for
bananas and apples.
Apples
C
B indifference curve
A budget lines
Bananas
According to the diagram, the consumer can choose to purchase more bananas than
apples. Consequently, the consumer can choose to but more apples than bananas. If
the customers want to but more apples than bananas, they can choose the indifference
curve represented by l1. Notably, the customer can buy more subsidies without
increasing his budget (Klein, 2017a). In the event that the customers face budget
constraints, he can forgo one item to another. In this case, customers can buy fewer
bananas and more apples than expected. These assumptions explain that subsidies are
Question 1
Indifference curves show the combination of the quantities of goods that consumers can
afford regarding the prices and the income of the consumers. Consumers can only
purchase goods that fall along the budget line (Chen and Lu, 2018). The prices of the
goods and income are the two factors that determine the combinations of goods along
the budget line. In most cases, the goods shows on the indifference curves are
subsidies. The following diagram shows the indifference curves and budget line for
bananas and apples.
Apples
C
B indifference curve
A budget lines
Bananas
According to the diagram, the consumer can choose to purchase more bananas than
apples. Consequently, the consumer can choose to but more apples than bananas. If
the customers want to but more apples than bananas, they can choose the indifference
curve represented by l1. Notably, the customer can buy more subsidies without
increasing his budget (Klein, 2017a). In the event that the customers face budget
constraints, he can forgo one item to another. In this case, customers can buy fewer
bananas and more apples than expected. These assumptions explain that subsidies are
ECONOMICS 3
better than monetary payments in terms of budget constraints. Mainly, this strategy is
applicable where the customer purchases substitute. Both bananas and apples are
fruits; therefore, customers can choose the more suitable one.
Substitutes present quasi-liners preferences are such that one increase in substitute
results in decline in one subsidy. If the customers increase the number of apples, the
number of bananas will automatically reduce as far as the indifference curves are
concerned (Ma et al., 2016). A change in the number of items can result in a shift from
indifference curves, depending on the customers’ budget. The linear nature of the
budget line implies that using subsidies is better for individuals than monetary
payments.
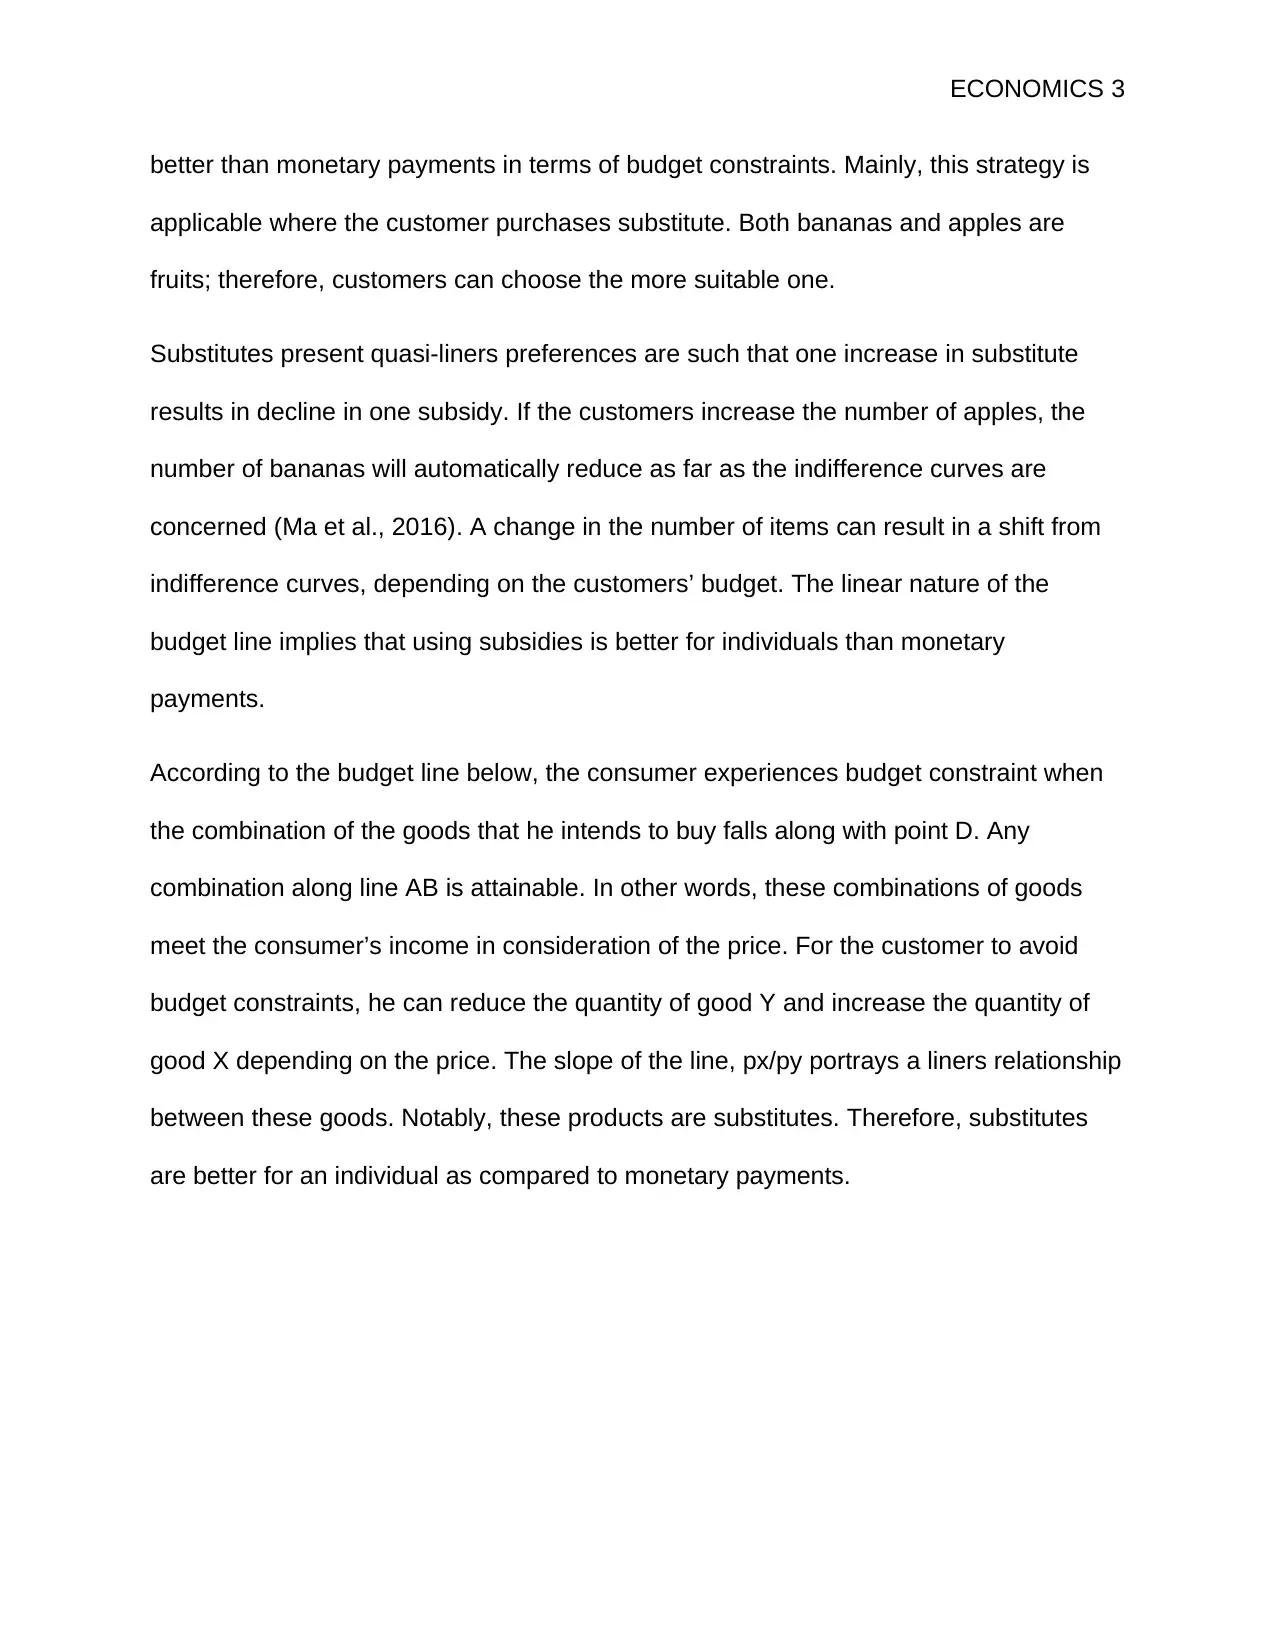
According to the budget line below, the consumer experiences budget constraint when
the combination of the goods that he intends to buy falls along with point D. Any
combination along line AB is attainable. In other words, these combinations of goods
meet the consumer’s income in consideration of the price. For the customer to avoid
budget constraints, he can reduce the quantity of good Y and increase the quantity of
good X depending on the price. The slope of the line, px/py portrays a liners relationship
between these goods. Notably, these products are substitutes. Therefore, substitutes
are better for an individual as compared to monetary payments.
better than monetary payments in terms of budget constraints. Mainly, this strategy is
applicable where the customer purchases substitute. Both bananas and apples are
fruits; therefore, customers can choose the more suitable one.
Substitutes present quasi-liners preferences are such that one increase in substitute
results in decline in one subsidy. If the customers increase the number of apples, the
number of bananas will automatically reduce as far as the indifference curves are
concerned (Ma et al., 2016). A change in the number of items can result in a shift from
indifference curves, depending on the customers’ budget. The linear nature of the
budget line implies that using subsidies is better for individuals than monetary
payments.
According to the budget line below, the consumer experiences budget constraint when
the combination of the goods that he intends to buy falls along with point D. Any
combination along line AB is attainable. In other words, these combinations of goods
meet the consumer’s income in consideration of the price. For the customer to avoid
budget constraints, he can reduce the quantity of good Y and increase the quantity of
good X depending on the price. The slope of the line, px/py portrays a liners relationship
between these goods. Notably, these products are substitutes. Therefore, substitutes
are better for an individual as compared to monetary payments.
⊘ This is a preview!⊘
Do you want full access?
Subscribe today to unlock all pages.
Trusted by 1+ million students worldwide
ECONOMICS 4
Source: Economics Discussion
Question 2
Quantity tax affects the value of each unit of product produced by the firm. On the other
hand. Income tax affects the consumer’s income. The two taxes affect consumer’s
indifference curves in one aspect or another. Mainly, taxes affect the prices of the
products. Quantity tax may result in price subsidy if the government reduces the tax
imposed on the production of a unit of a product (Provencher and Ramnarain, 2019). As
a result, the producers will reduce the prices hence attracting many consumers.
Consequently, income tax affects the income subsidy. If the government reduces the
income tax charged on consumers, the consumers’ disposable income will increase
hence enabling them to spend more money.
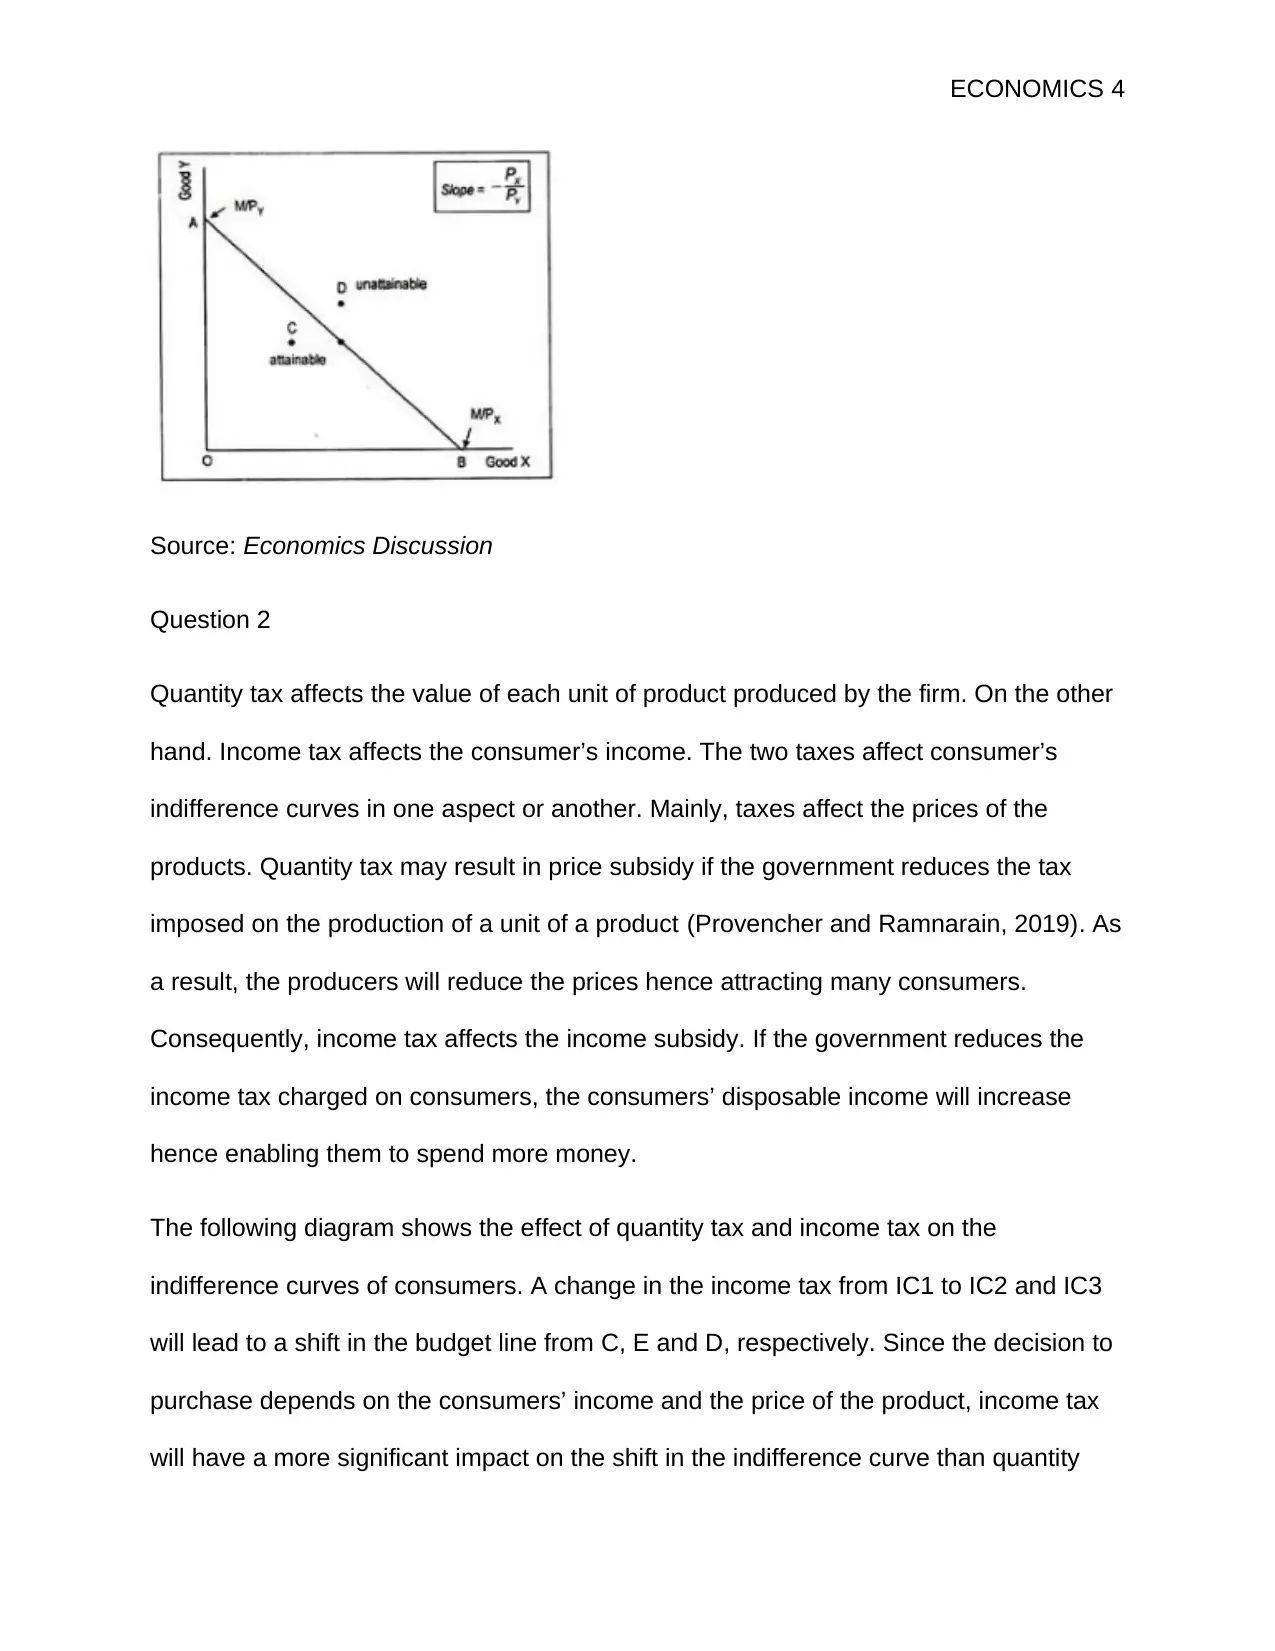
The following diagram shows the effect of quantity tax and income tax on the
indifference curves of consumers. A change in the income tax from IC1 to IC2 and IC3
will lead to a shift in the budget line from C, E and D, respectively. Since the decision to
purchase depends on the consumers’ income and the price of the product, income tax
will have a more significant impact on the shift in the indifference curve than quantity
Source: Economics Discussion
Question 2
Quantity tax affects the value of each unit of product produced by the firm. On the other
hand. Income tax affects the consumer’s income. The two taxes affect consumer’s
indifference curves in one aspect or another. Mainly, taxes affect the prices of the
products. Quantity tax may result in price subsidy if the government reduces the tax
imposed on the production of a unit of a product (Provencher and Ramnarain, 2019). As
a result, the producers will reduce the prices hence attracting many consumers.
Consequently, income tax affects the income subsidy. If the government reduces the
income tax charged on consumers, the consumers’ disposable income will increase
hence enabling them to spend more money.
The following diagram shows the effect of quantity tax and income tax on the
indifference curves of consumers. A change in the income tax from IC1 to IC2 and IC3
will lead to a shift in the budget line from C, E and D, respectively. Since the decision to
purchase depends on the consumers’ income and the price of the product, income tax
will have a more significant impact on the shift in the indifference curve than quantity
Paraphrase This Document
Need a fresh take? Get an instant paraphrase of this document with our AI Paraphraser
ECONOMICS 5
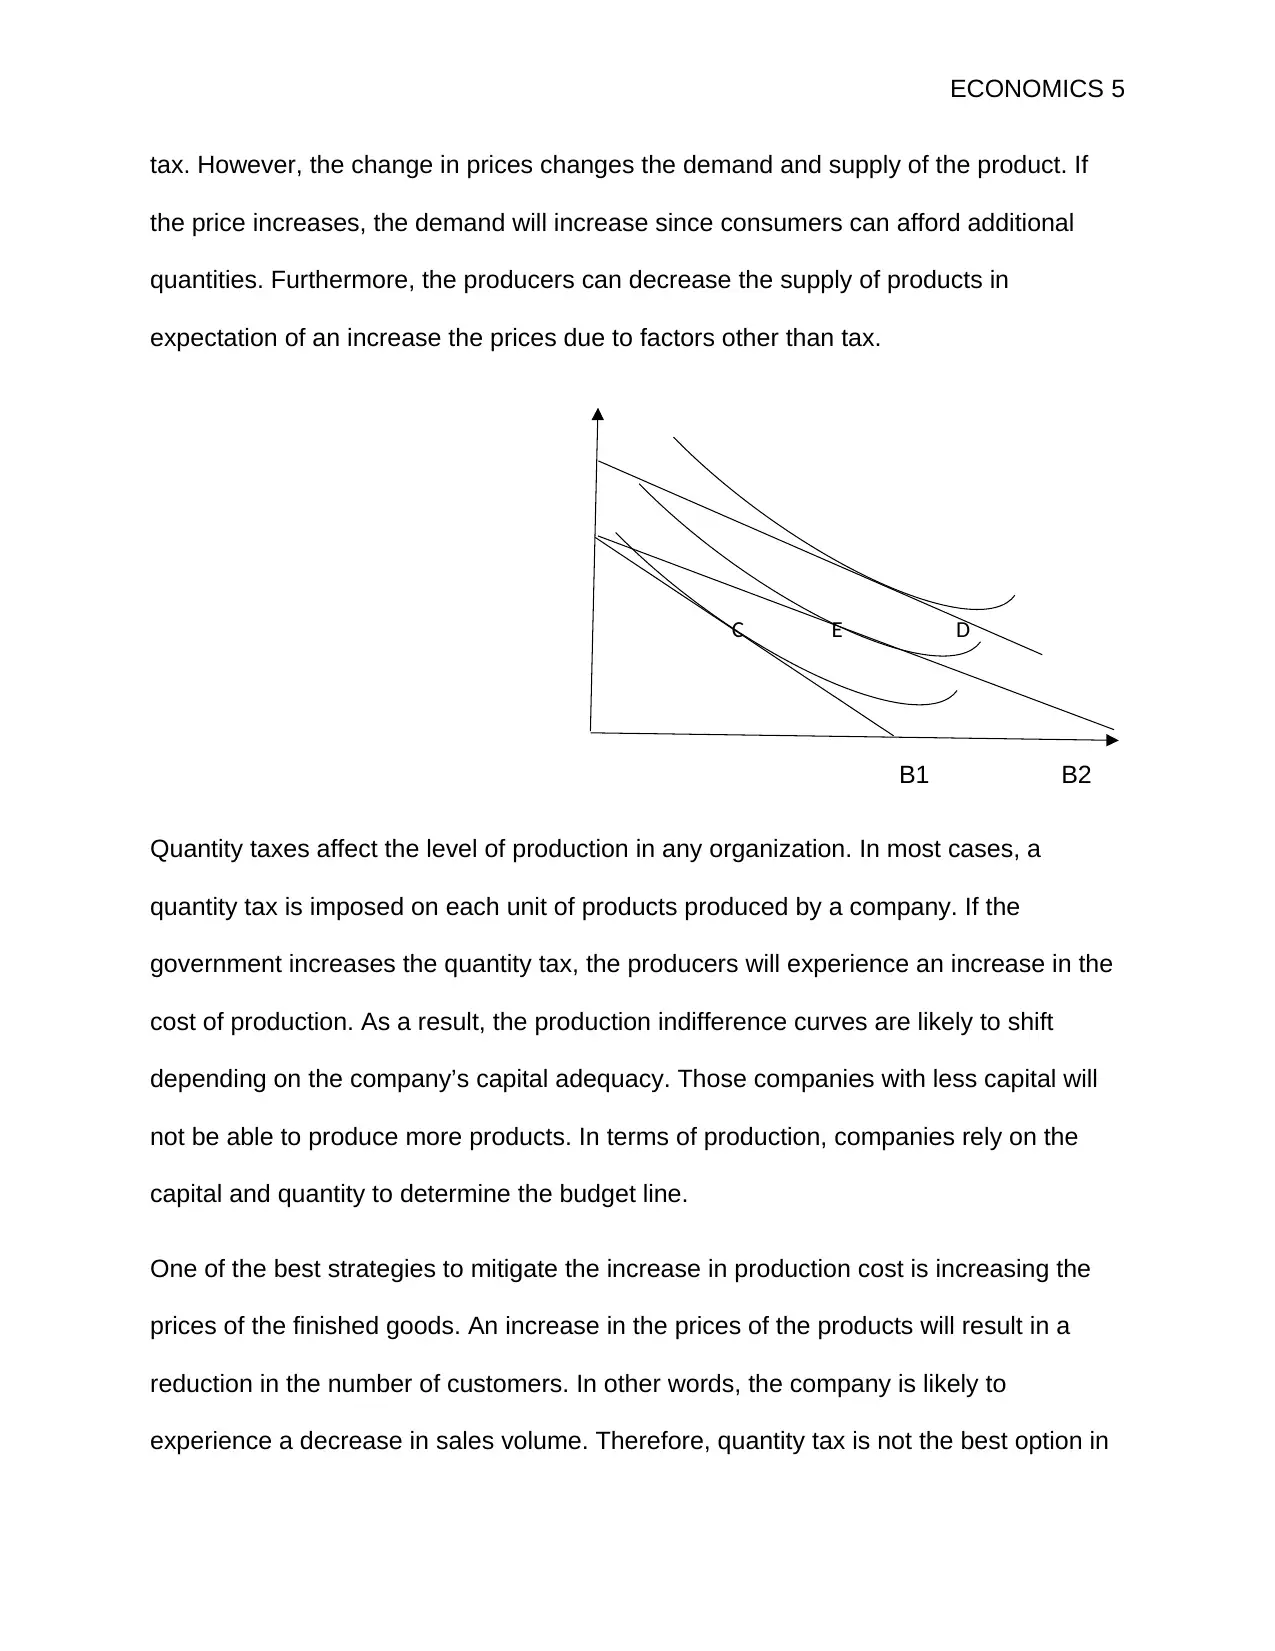
tax. However, the change in prices changes the demand and supply of the product. If
the price increases, the demand will increase since consumers can afford additional
quantities. Furthermore, the producers can decrease the supply of products in
expectation of an increase the prices due to factors other than tax.
C E D
B1 B2
Quantity taxes affect the level of production in any organization. In most cases, a
quantity tax is imposed on each unit of products produced by a company. If the
government increases the quantity tax, the producers will experience an increase in the
cost of production. As a result, the production indifference curves are likely to shift
depending on the company’s capital adequacy. Those companies with less capital will
not be able to produce more products. In terms of production, companies rely on the
capital and quantity to determine the budget line.
One of the best strategies to mitigate the increase in production cost is increasing the
prices of the finished goods. An increase in the prices of the products will result in a
reduction in the number of customers. In other words, the company is likely to
experience a decrease in sales volume. Therefore, quantity tax is not the best option in
ECONOMICS 6
regards to the demand and supply of products. Besides, the imposition of income tax
will not affect the rate of production. Ideally, companies will not experience a direct
impact on the cost of production due to an increase in a decrease in the level of income
taxes.
In many countries, income tax is imposed depending on the income of the individual.
Those who earn more tend to pay more than low-income earners. If the government
increases the rate of income tax, the high-income earners will more be affected than the
low-income earners. In most economies, most high-income earners tend to shop more
frequently than low-income earners (Mehta et al., 2018). The government may also
decide to lower the income tax as a relief to the consumers. In such a case, consumers
will have the opportunity to buy more products. Income tax reduction will force the
companies to produce more products to meet the increasing demand.
By considering the impacts of both quantity tax and income tax, the indifference curve of
the consumers is more likely to be affected by the changes in income tax. The
customers have the opportunity to decide on the quantity of the goods that they can
buy. A change in income tax will allow consumers to make wise decisions regarding the
number of products. Therefore, the income tax is more important than quality tax.
Income tax has a direct impact on the demand and supply of the products, especially on
the side of consumers.
Question 3
The income effect explains the changes in consumption as a result of a change in
consumers’ purchasing power. The demand for any type of product is attributable to the
⊘ This is a preview!⊘
Do you want full access?
Subscribe today to unlock all pages.
Trusted by 1+ million students worldwide
ECONOMICS 7
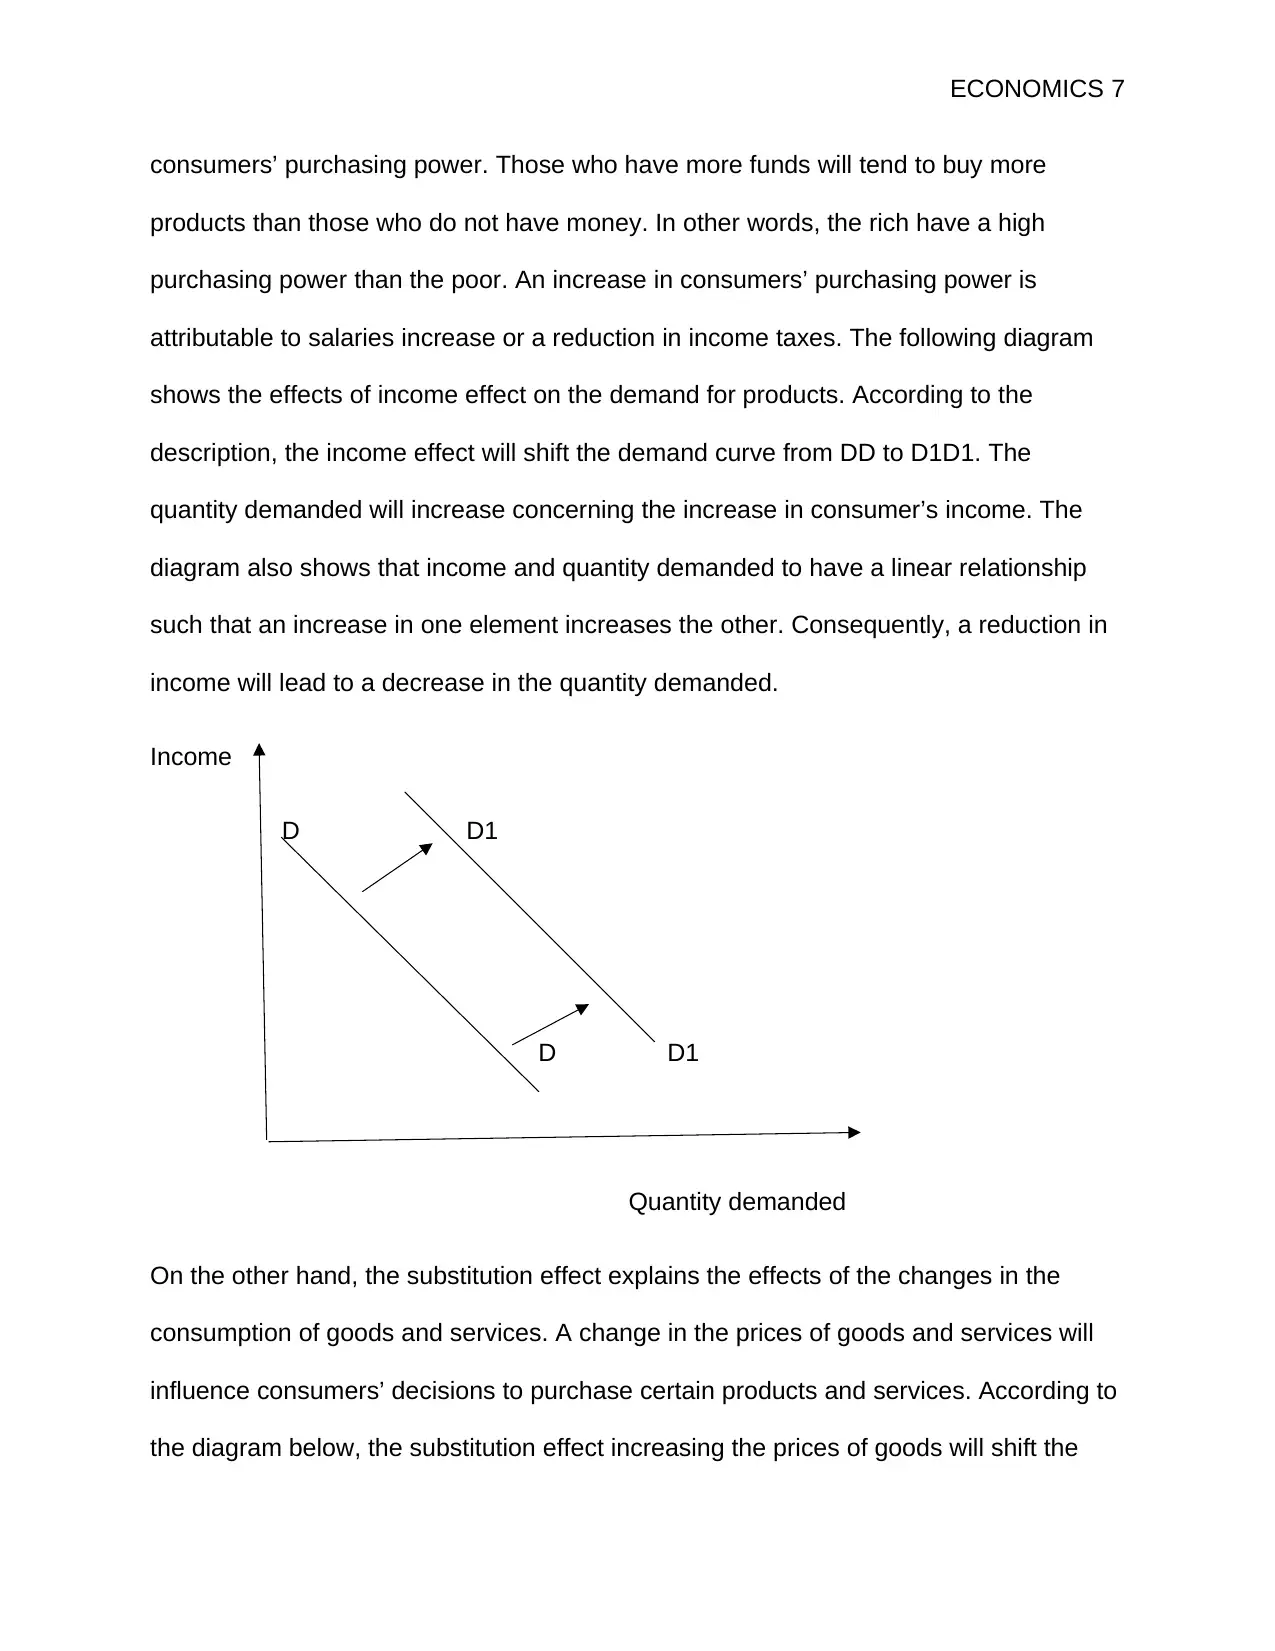
consumers’ purchasing power. Those who have more funds will tend to buy more
products than those who do not have money. In other words, the rich have a high
purchasing power than the poor. An increase in consumers’ purchasing power is
attributable to salaries increase or a reduction in income taxes. The following diagram
shows the effects of income effect on the demand for products. According to the
description, the income effect will shift the demand curve from DD to D1D1. The
quantity demanded will increase concerning the increase in consumer’s income. The
diagram also shows that income and quantity demanded to have a linear relationship
such that an increase in one element increases the other. Consequently, a reduction in
income will lead to a decrease in the quantity demanded.
Income
D D1
D D1
Quantity demanded
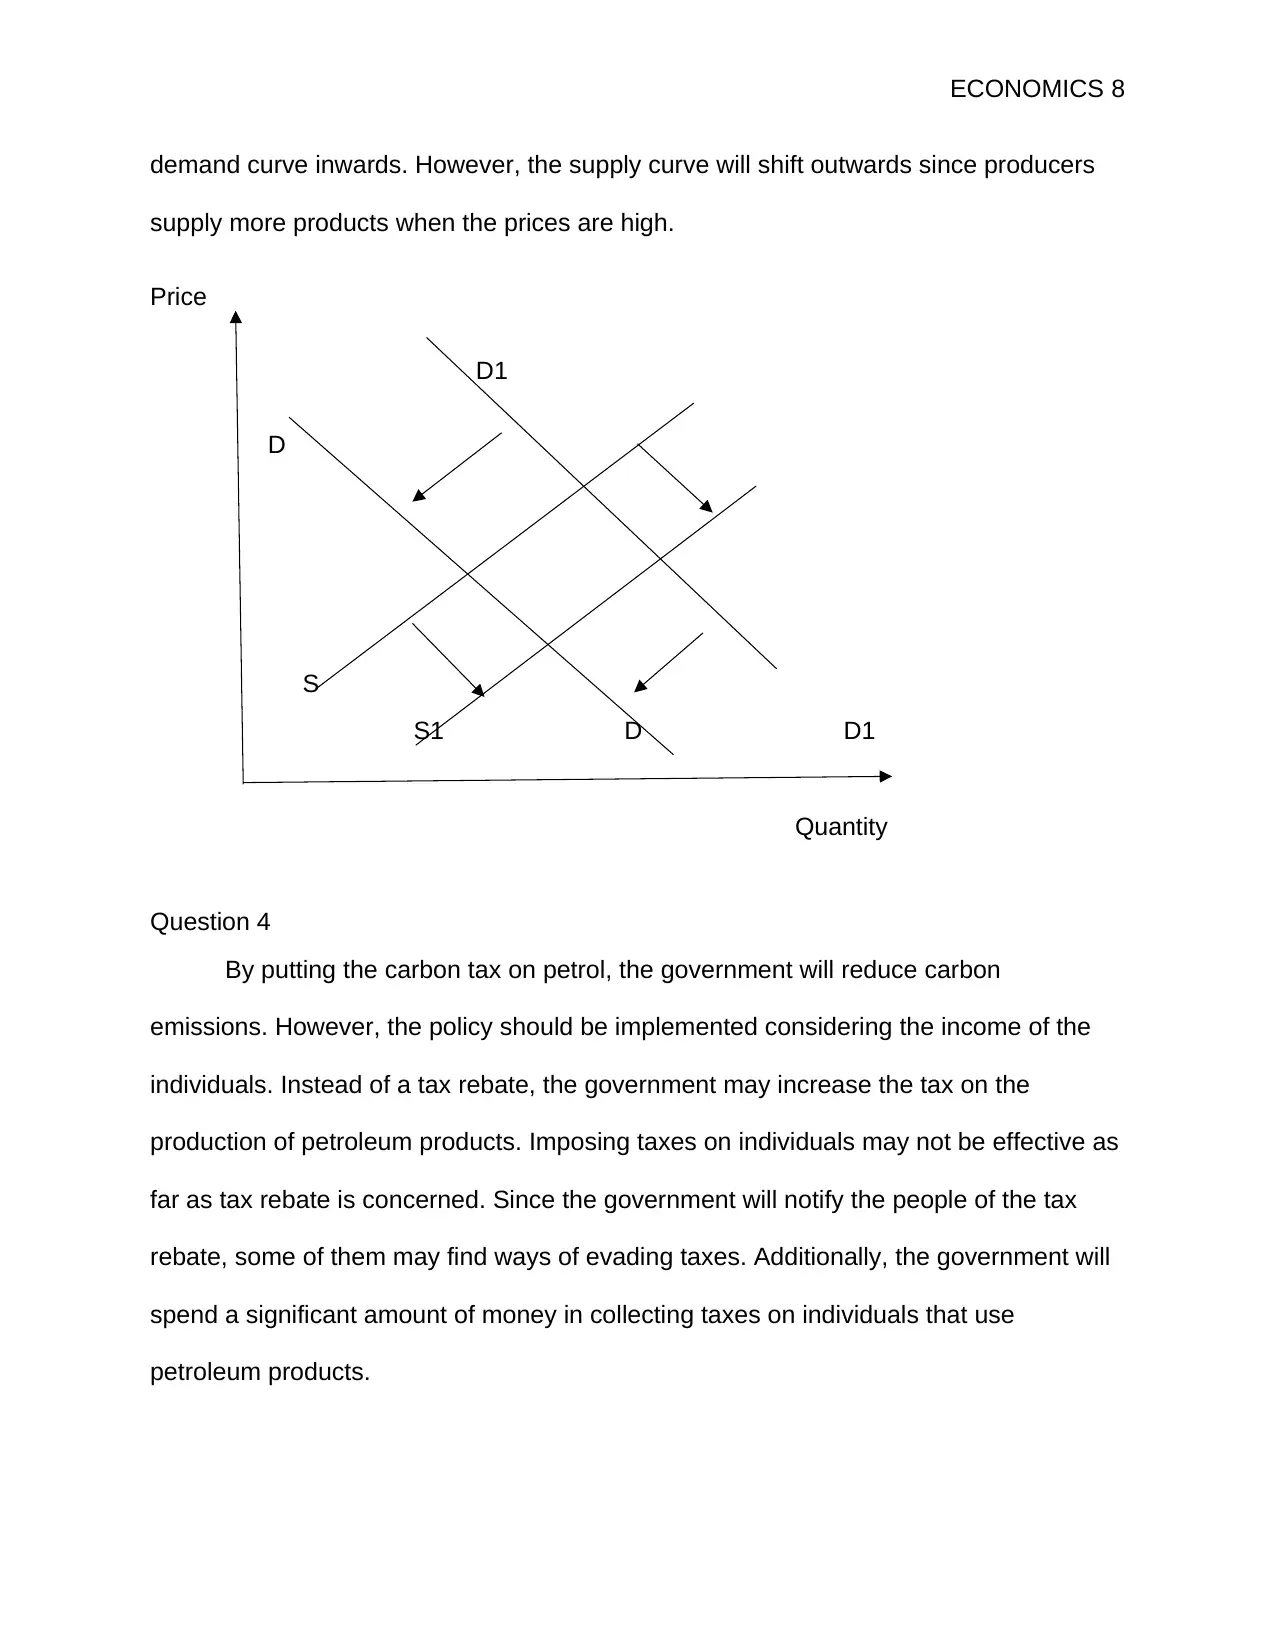
On the other hand, the substitution effect explains the effects of the changes in the
consumption of goods and services. A change in the prices of goods and services will
influence consumers’ decisions to purchase certain products and services. According to
the diagram below, the substitution effect increasing the prices of goods will shift the
consumers’ purchasing power. Those who have more funds will tend to buy more
products than those who do not have money. In other words, the rich have a high
purchasing power than the poor. An increase in consumers’ purchasing power is
attributable to salaries increase or a reduction in income taxes. The following diagram
shows the effects of income effect on the demand for products. According to the
description, the income effect will shift the demand curve from DD to D1D1. The
quantity demanded will increase concerning the increase in consumer’s income. The
diagram also shows that income and quantity demanded to have a linear relationship
such that an increase in one element increases the other. Consequently, a reduction in
income will lead to a decrease in the quantity demanded.
Income
D D1
D D1
Quantity demanded
On the other hand, the substitution effect explains the effects of the changes in the
consumption of goods and services. A change in the prices of goods and services will
influence consumers’ decisions to purchase certain products and services. According to
the diagram below, the substitution effect increasing the prices of goods will shift the
Paraphrase This Document
Need a fresh take? Get an instant paraphrase of this document with our AI Paraphraser
ECONOMICS 8
demand curve inwards. However, the supply curve will shift outwards since producers
supply more products when the prices are high.
Price
D1
D
S
S1 D D1
Quantity
Question 4
By putting the carbon tax on petrol, the government will reduce carbon
emissions. However, the policy should be implemented considering the income of the
individuals. Instead of a tax rebate, the government may increase the tax on the
production of petroleum products. Imposing taxes on individuals may not be effective as
far as tax rebate is concerned. Since the government will notify the people of the tax
rebate, some of them may find ways of evading taxes. Additionally, the government will
spend a significant amount of money in collecting taxes on individuals that use
petroleum products.
ECONOMICS 9
The carbon tax should be imposed on the producers of petroleum products. The
government will quickly compel the companies to pay taxes than following individual
consumers. Since an increase in the carbon tax will affect the prices of petroleum
products, consumers will suffer the rise as well. If the carbon taxes are imposed on the
producers, customers will bear the burden as a result of increased fuel prices. The
increase in the price of petroleum products will reduce the consumers’ purchasing
power (Klein, 2017b). As the number of petroleum products demanded reduces, the
environment will be exposed to less carbon emission. The implications of this policy will
have a long term effect on the environment. The tax rebate will play an essential role in
restoring the consumers’ purchasing power. The tax imposition policy can be explained
using the Slutsky identity.
According to the Slutsky identity, the demand for products and services depends
on the income and substitution effects. The identity also states that the two effects can
be experienced at the same time. It implies that both substitution and income effects will
affect the demand for a product at the same time. In most economies, the demand and
supply of products are influenced by various factors such as consumers’ purchasing
power, tax rates, and prices of the products as well as the prices of the substitutes.
Consumers need to make reliable decisions regarding purchase.
The Slutsky identity holds that when the price of goods changes, the consumers’
real income, and purchasing power will also change. Such changes can be negative or
positive. An increase in the prices of goods will result in a negative impact on the
consumer’s purchasing power and real income. In such a case, the consumers will have
to spend an additional amount of money on the same quantity of items that they used to
⊘ This is a preview!⊘
Do you want full access?
Subscribe today to unlock all pages.
Trusted by 1+ million students worldwide
ECONOMICS 10
buy before the price increase. Some consumers will not be able to purchase a given
quantity of goods that they could buy before the price increase. The reduction in
affordable amount to a consumer reduces their purchasing power. On the other hand, a
positive change will result from a reduction in the price of the products. The law of
demand holds that many consumers will purchase more products when the prices are
the law.
Consequently, a reduction in the prices of goods and services will allow
consumers to save extra money they would have used to buy the same quantity. For
instance, if the price of products reduces from $50 to $46, consumers will be able to
save $4 on each unit of product that they buy. These savings imply that the consumers’
purchasing power will increase (Harvey, 2016). The Slutsky equation considers both the
income and substitution effects to illustrate the consequences that the economy will
experience if the price or income changes.
Slutsky proposed a consumption strategy that will enable consumers to afford
their previous bundles of products. Even though the policy is aimed at changing the
consumption pattern, consumers should still be in a position to afford the bundle of
products that they could buy before. Such attributes of Slutsky has enabled many
organizations to come up with effective strategies to deal with economical situations.
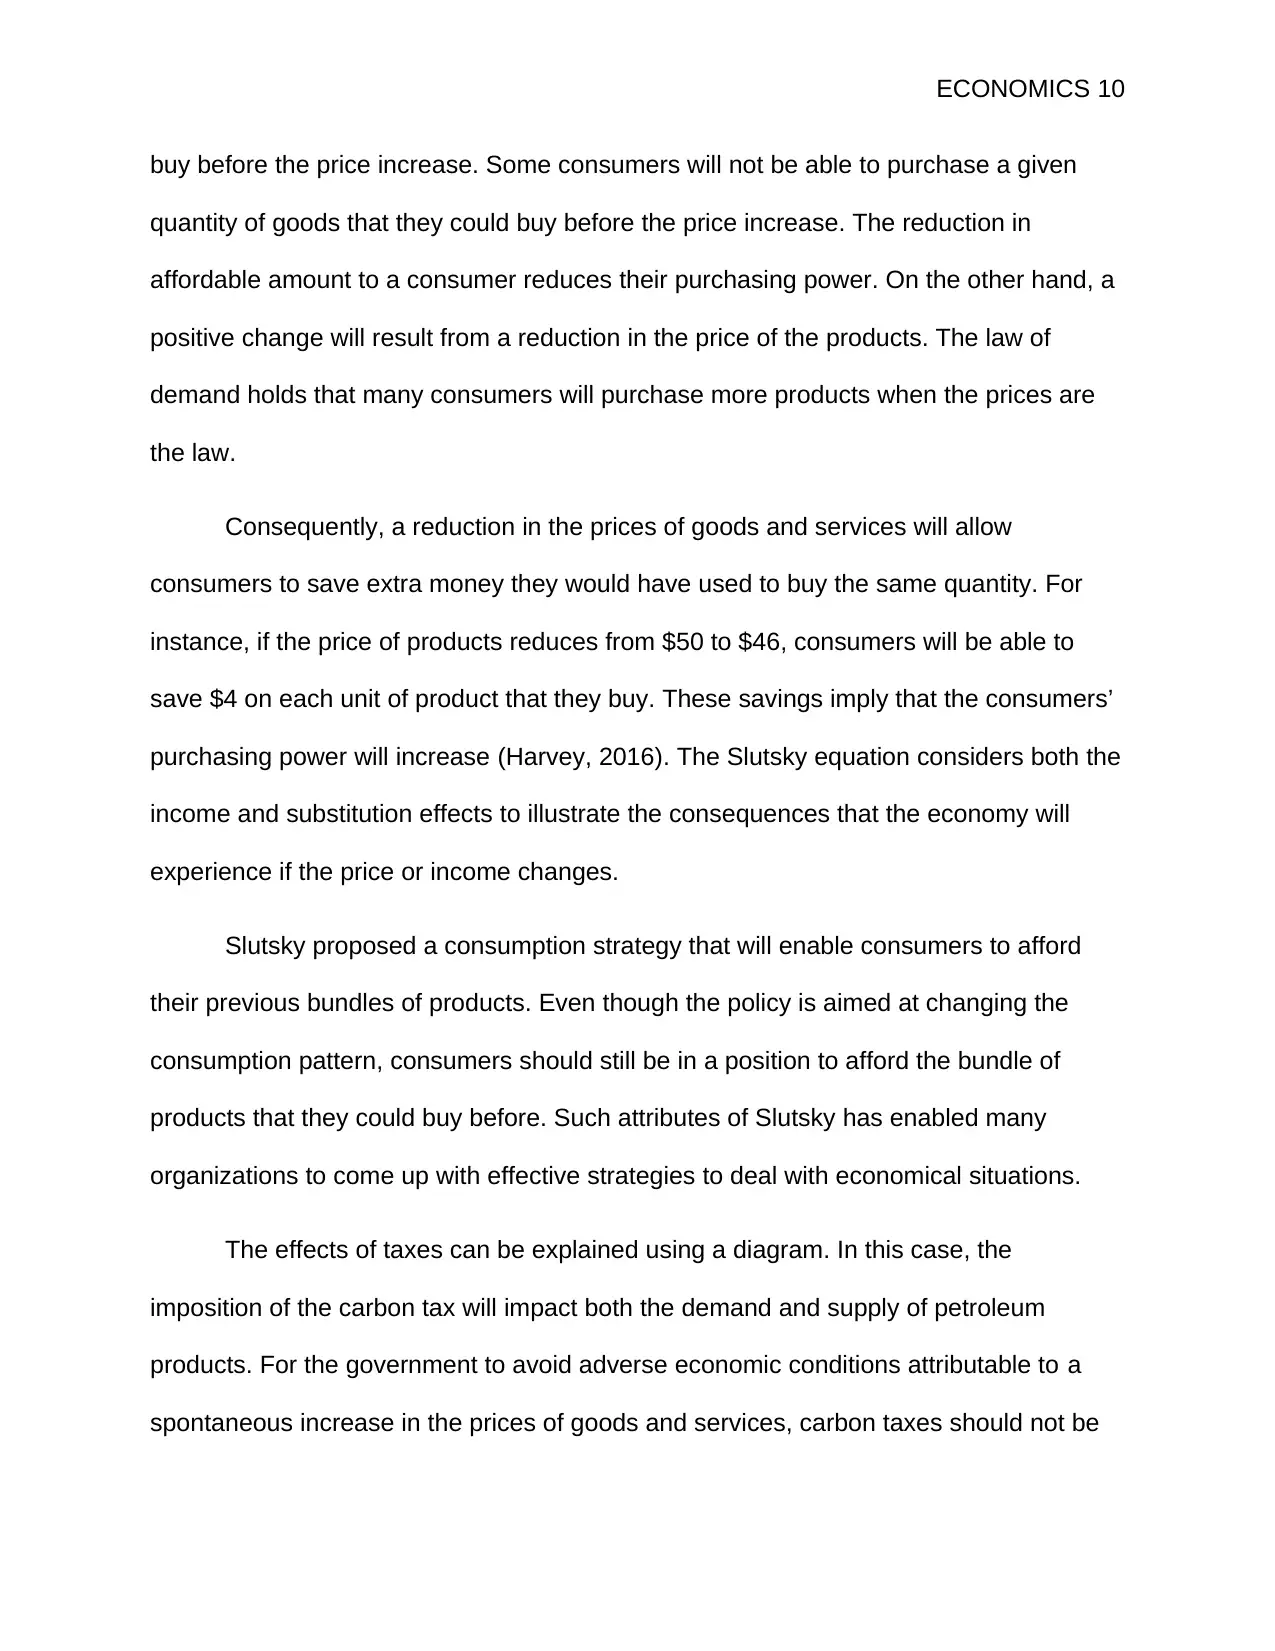
The effects of taxes can be explained using a diagram. In this case, the
imposition of the carbon tax will impact both the demand and supply of petroleum
products. For the government to avoid adverse economic conditions attributable to a
spontaneous increase in the prices of goods and services, carbon taxes should not be
buy before the price increase. Some consumers will not be able to purchase a given
quantity of goods that they could buy before the price increase. The reduction in
affordable amount to a consumer reduces their purchasing power. On the other hand, a
positive change will result from a reduction in the price of the products. The law of
demand holds that many consumers will purchase more products when the prices are
the law.
Consequently, a reduction in the prices of goods and services will allow
consumers to save extra money they would have used to buy the same quantity. For
instance, if the price of products reduces from $50 to $46, consumers will be able to
save $4 on each unit of product that they buy. These savings imply that the consumers’
purchasing power will increase (Harvey, 2016). The Slutsky equation considers both the
income and substitution effects to illustrate the consequences that the economy will
experience if the price or income changes.
Slutsky proposed a consumption strategy that will enable consumers to afford
their previous bundles of products. Even though the policy is aimed at changing the
consumption pattern, consumers should still be in a position to afford the bundle of
products that they could buy before. Such attributes of Slutsky has enabled many
organizations to come up with effective strategies to deal with economical situations.
The effects of taxes can be explained using a diagram. In this case, the
imposition of the carbon tax will impact both the demand and supply of petroleum
products. For the government to avoid adverse economic conditions attributable to a
spontaneous increase in the prices of goods and services, carbon taxes should not be
Paraphrase This Document
Need a fresh take? Get an instant paraphrase of this document with our AI Paraphraser
ECONOMICS 11
higher. In other words, the imposition of the carbon tax should not limit the consumers
from their initial capacity.
Y
Substitution effect x
higher. In other words, the imposition of the carbon tax should not limit the consumers
from their initial capacity.
Y
Substitution effect x
ECONOMICS 12
References
Chen, Y., Lu, F., 2018. Brief Analysis on the Teaching Methods of Intermediate
Macroeconomics of Economics and Management Majors, in: 2018 5th
International Conference on Education, Management, Arts, Economics and
Social Science (ICEMAESS 2018). Atlantis Press.
Harvey, J., 2016. Urban land economics. Macmillan International Higher Education.
Klein, P., 2017a. Economics 2201 Intermediate Macroeconomics Fall 2017.
Klein, P., 2017b. Economics 2201 Intermediate Macroeconomics Fall 2018 Course
outline.
Ma, J., Li, W., Ni, C., Li, Y., Huang, S., Shen, C., Xu, C., 2016. Investigation of
distillation systems using heavy or intermediate entrainers for separating
toluene–methanol: process economics and control. J. Chem. Technol.
Biotechnol. 91, 2111–2124.
Mehta, G., Kumar, R., Wali, V.K., Sharma, A., Mehta, S.K., Bhat, A., Lal, M., 2018.
Economics of Different Grafting Methods on Pecan Nut (Carya illinoensis
Wangenh) under Intermediate Agro-Climatic Conditions of Jammu and Kashmir.
Int J Curr Microbiol App Sci 7, 3305–3309.
Provencher, A.J., Ramnarain, S., 2019. Class Debates in Intermediate Microeconomics:
Social Economics and Pluralist Perspectives, in: Forum for Social Economics.
Taylor & Francis, pp. 354–372.
⊘ This is a preview!⊘
Do you want full access?
Subscribe today to unlock all pages.
Trusted by 1+ million students worldwide
1 out of 12
Related Documents


Your All-in-One AI-Powered Toolkit for Academic Success.
+13062052269
info@desklib.com
Available 24*7 on WhatsApp / Email
![[object Object]](/_next/static/media/star-bottom.7253800d.svg)
Unlock your academic potential
Copyright © 2020–2026 A2Z Services. All Rights Reserved. Developed and managed by ZUCOL.