Internal Analysis of Celanese Corporation: A Detailed Report
VerifiedAdded on 2019/09/22
|38
|6999
|339
Report
AI Summary
This comprehensive internal analysis report examines Celanese Corporation, delving into its organizational structure, corporate mission, products and services, leadership, and organizational culture. It provides a detailed overview of the company's tangible and intangible resources, core competencies, and value chain activities, including primary and support activities. The report further analyzes Celanese's financial performance, covering valuation, growth, profitability, financial strength, and management efficiency. A summary of strengths and weaknesses is presented, along with references. The report aims to provide insights into Celanese's strategic positioning and overall business performance. The analysis includes a BCG matrix assessment of its product portfolio and evaluates the roles of key executives, the company's values, norms, rituals, and its flat organizational structure.
Celanese
Corporation
INTERNAL ANALYSIS
By: Kayelyn Korenek, Matthew Center, Samantha Penland, & Trevor Belcik
Corporation
INTERNAL ANALYSIS
By: Kayelyn Korenek, Matthew Center, Samantha Penland, & Trevor Belcik
Paraphrase This Document
Need a fresh take? Get an instant paraphrase of this document with our AI Paraphraser
Table of Contents
4. Internal Analysis 2
4.1. Organizational Analysis 3
4.1.1. Corporate Mission 3
4.1.2. Products and Services 4
4.1.3. Leadership 9
4.1.4. Organizational Culture 9
4.1.5. Structure 10
4.2.1 Tangible Resources 13
4.2.2 Intangible Resources 13
4.2.3 Core Competencies and Sustainable Advantages 13
4.3 Value Chain Analysis 14
4.3.1. Primary Activities 14
4.3.2. Support Activities 15
4.4 Financial Analysis 15
4.4.1 Valuation Analysis 16
4.4.2 Growth Analysis 18
4.4.3 Profitability Analysis 23
4.4.4 Financial Strength Analysis 27
4.4.5 Management Efficiency Analysis 30
4.5 Summary of Strength and Weaknesses 35
References 36
1
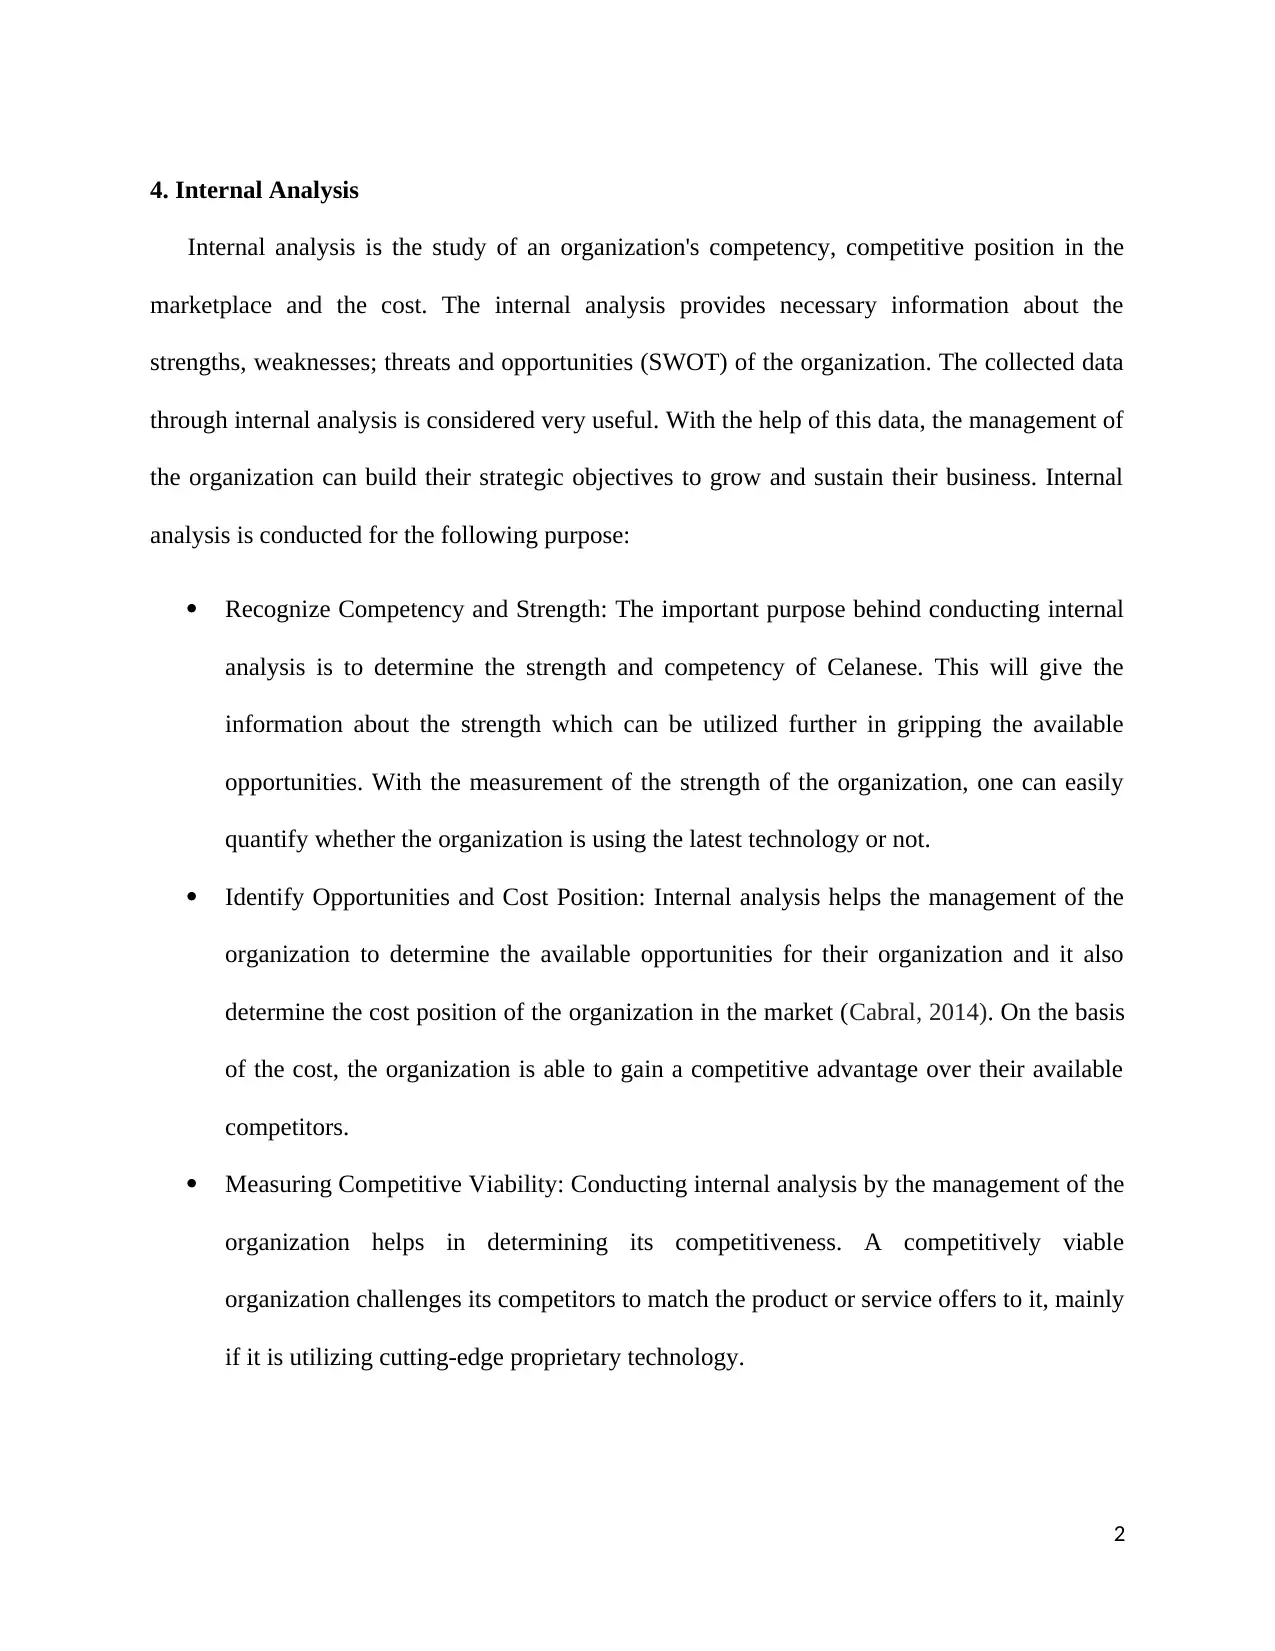
4. Internal Analysis
Internal analysis is the study of an organization's competency, competitive position in the
marketplace and the cost. The internal analysis provides necessary information about the
strengths, weaknesses; threats and opportunities (SWOT) of the organization. The collected data
through internal analysis is considered very useful. With the help of this data, the management of
the organization can build their strategic objectives to grow and sustain their business. Internal
analysis is conducted for the following purpose:
Recognize Competency and Strength: The important purpose behind conducting internal
analysis is to determine the strength and competency of Celanese. This will give the
information about the strength which can be utilized further in gripping the available
opportunities. With the measurement of the strength of the organization, one can easily
quantify whether the organization is using the latest technology or not.
Identify Opportunities and Cost Position: Internal analysis helps the management of the
organization to determine the available opportunities for their organization and it also
determine the cost position of the organization in the market (Cabral, 2014). On the basis
of the cost, the organization is able to gain a competitive advantage over their available
competitors.
Measuring Competitive Viability: Conducting internal analysis by the management of the
organization helps in determining its competitiveness. A competitively viable
organization challenges its competitors to match the product or service offers to it, mainly
if it is utilizing cutting-edge proprietary technology.
2
⊘ This is a preview!⊘
Do you want full access?
Subscribe today to unlock all pages.
Trusted by 1+ million students worldwide
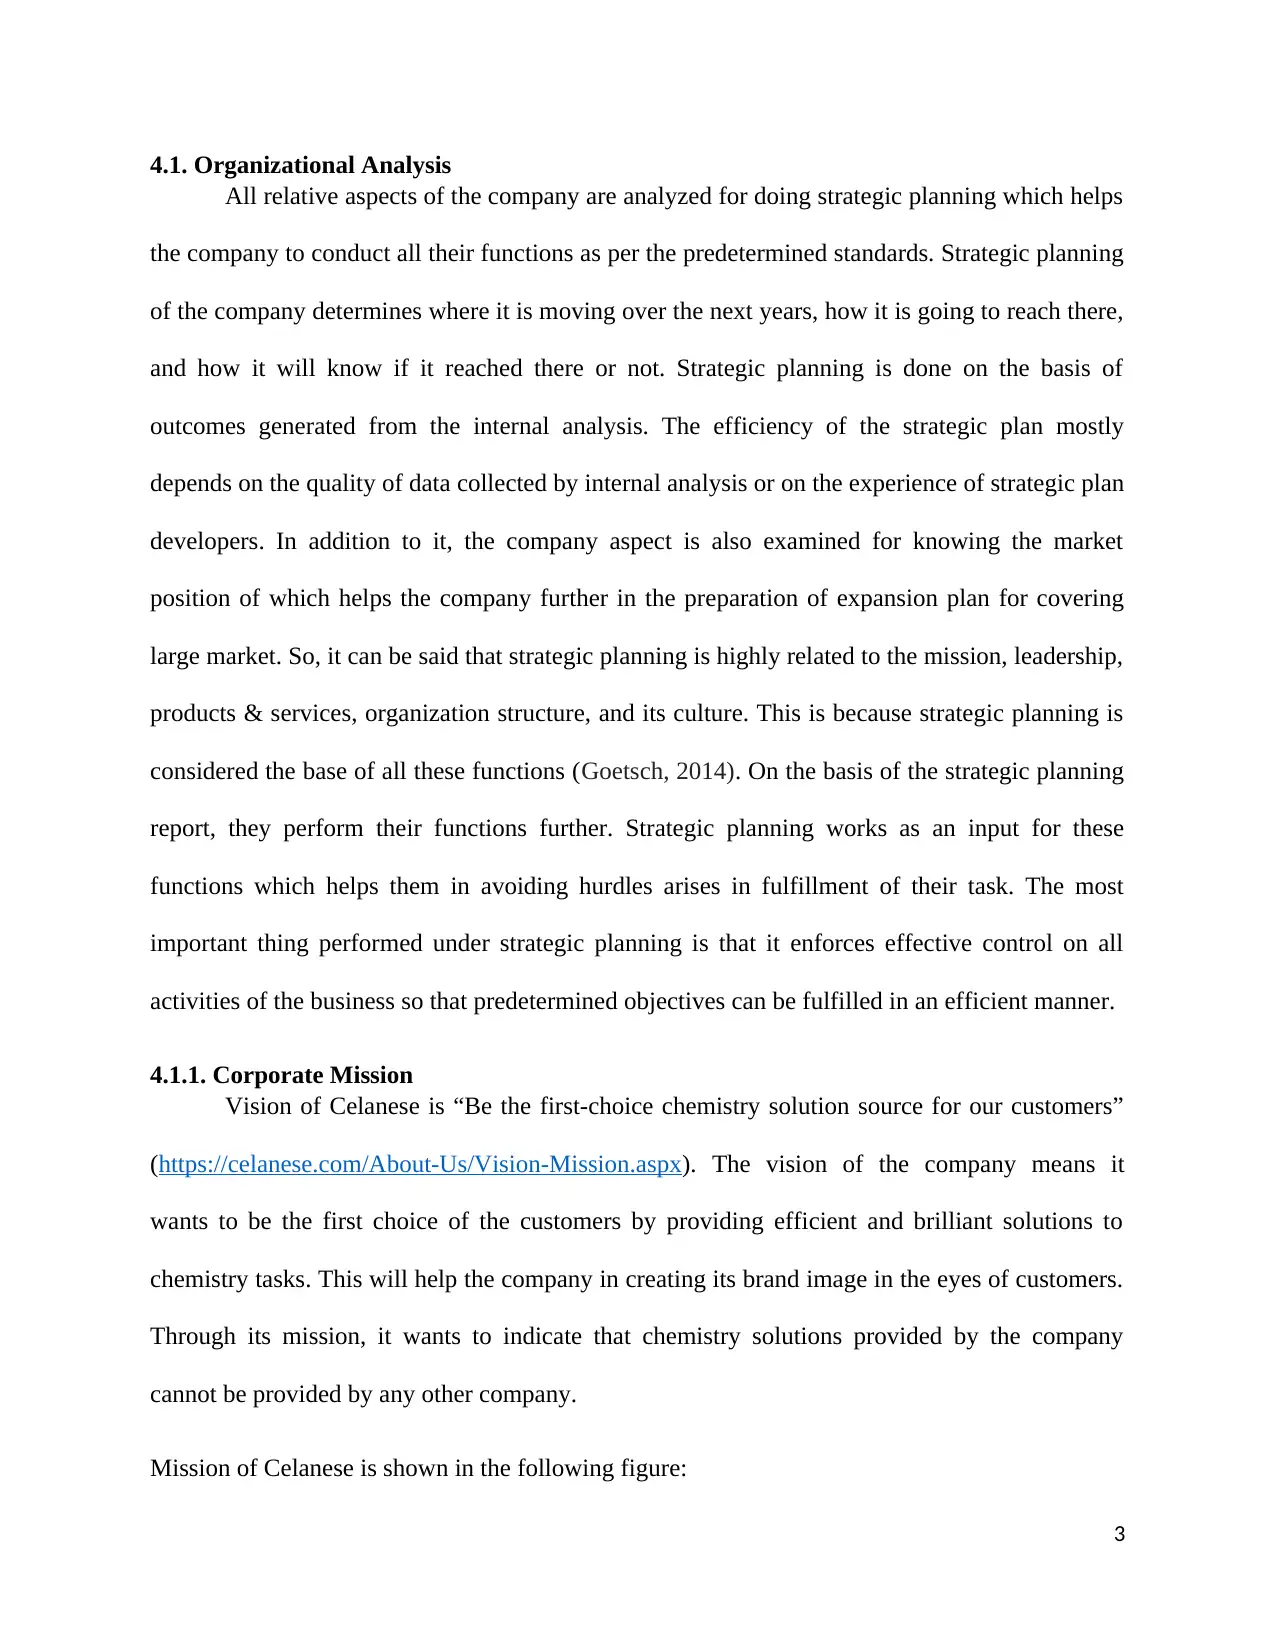
4.1. Organizational Analysis
All relative aspects of the company are analyzed for doing strategic planning which helps
the company to conduct all their functions as per the predetermined standards. Strategic planning
of the company determines where it is moving over the next years, how it is going to reach there,
and how it will know if it reached there or not. Strategic planning is done on the basis of
outcomes generated from the internal analysis. The efficiency of the strategic plan mostly
depends on the quality of data collected by internal analysis or on the experience of strategic plan
developers. In addition to it, the company aspect is also examined for knowing the market
position of which helps the company further in the preparation of expansion plan for covering
large market. So, it can be said that strategic planning is highly related to the mission, leadership,
products & services, organization structure, and its culture. This is because strategic planning is
considered the base of all these functions (Goetsch, 2014). On the basis of the strategic planning
report, they perform their functions further. Strategic planning works as an input for these
functions which helps them in avoiding hurdles arises in fulfillment of their task. The most
important thing performed under strategic planning is that it enforces effective control on all
activities of the business so that predetermined objectives can be fulfilled in an efficient manner.
4.1.1. Corporate Mission
Vision of Celanese is “Be the first-choice chemistry solution source for our customers”
(https://celanese.com/About-Us/Vision-Mission.aspx). The vision of the company means it
wants to be the first choice of the customers by providing efficient and brilliant solutions to
chemistry tasks. This will help the company in creating its brand image in the eyes of customers.
Through its mission, it wants to indicate that chemistry solutions provided by the company
cannot be provided by any other company.
Mission of Celanese is shown in the following figure:
3
Paraphrase This Document
Need a fresh take? Get an instant paraphrase of this document with our AI Paraphraser
(https://celanese.com/About-Us/Vision-Mission.aspx)
Collaboration: It means that the company wants to collaborate with its customers to build
fresh solutions and discover uses for a mature product which satisfy critical demands of
customers.
Creating Customer Value: It means that Celanese wants to utilize the overall concept of
chemistry, universal business expertise or technology to build value for its customers and
for itself also.
Improving the World: It means that Celanese wants to be committed, innovative and
collaborative to develop a healthy world environment to stay (Grant, 2016).
Being Sustainable: It means that the organization operates its business efficiently which
helps further in influencing the communities.
Employee Growth: It means that the organization wants to build itself as a rewarding
place which works according to different growth opportunities and permits employees to
utilize their overall potential.
Shareholder Value: It means that Celanese wants to develop wealth for its shareholders
and employees through growth and profits.
4.1.2. Products and Services
4
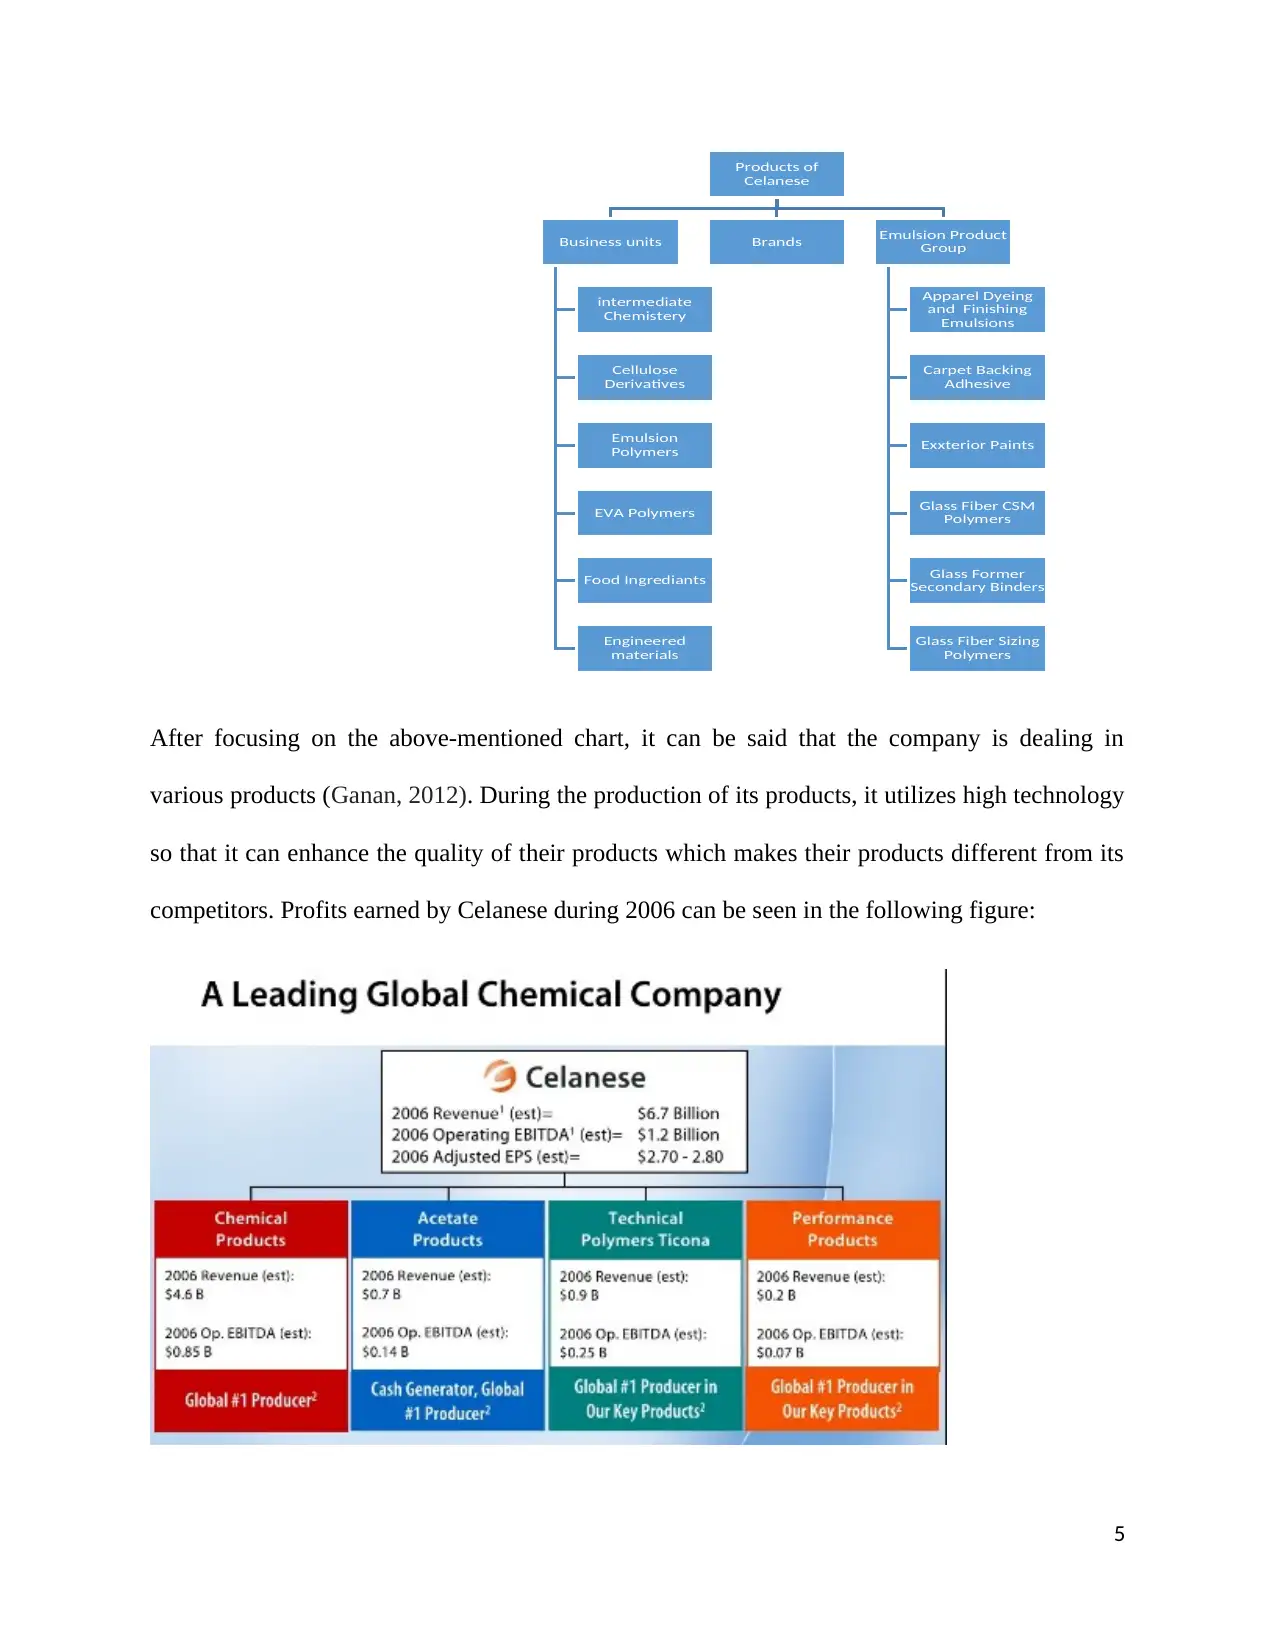
After focusing on the above-mentioned chart, it can be said that the company is dealing in
various products (Ganan, 2012). During the production of its products, it utilizes high technology
so that it can enhance the quality of their products which makes their products different from its
competitors. Profits earned by Celanese during 2006 can be seen in the following figure:
5
Products of
Celanese
Business units
intermediate
Chemistery
Cellulose
Derivatives
Emulsion
Polymers
EVA Polymers
Food Ingrediants
Engineered
materials
Brands Emulsion Product
Group
Apparel Dyeing
and Finishing
Emulsions
Carpet Backing
Adhesive
Exxterior Paints
Glass Fiber CSM
Polymers
Glass Former
Secondary Binders
Glass Fiber Sizing
Polymers
⊘ This is a preview!⊘
Do you want full access?
Subscribe today to unlock all pages.
Trusted by 1+ million students worldwide
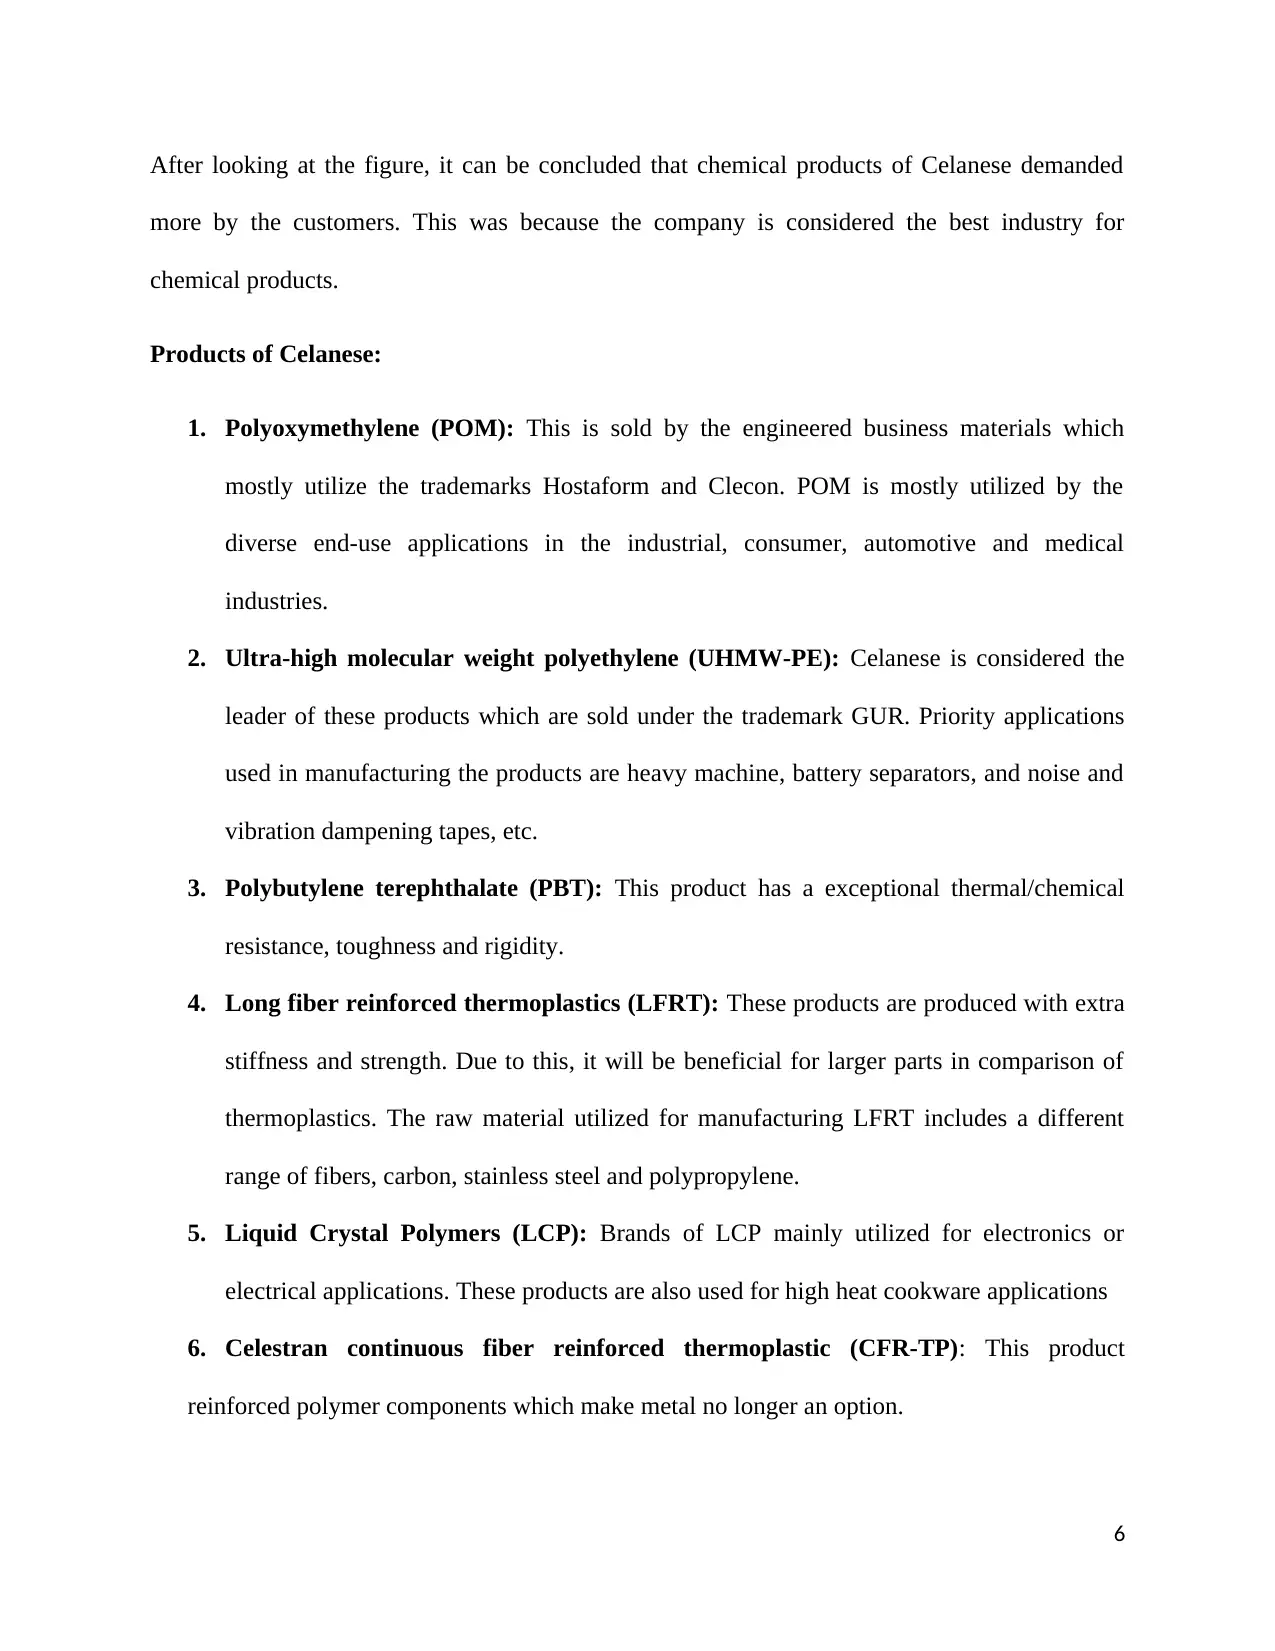
After looking at the figure, it can be concluded that chemical products of Celanese demanded
more by the customers. This was because the company is considered the best industry for
chemical products.
Products of Celanese:
1. Polyoxymethylene (POM): This is sold by the engineered business materials which
mostly utilize the trademarks Hostaform and Clecon. POM is mostly utilized by the
diverse end-use applications in the industrial, consumer, automotive and medical
industries.
2. Ultra-high molecular weight polyethylene (UHMW-PE): Celanese is considered the
leader of these products which are sold under the trademark GUR. Priority applications
used in manufacturing the products are heavy machine, battery separators, and noise and
vibration dampening tapes, etc.
3. Polybutylene terephthalate (PBT): This product has a exceptional thermal/chemical
resistance, toughness and rigidity.
4. Long fiber reinforced thermoplastics (LFRT): These products are produced with extra
stiffness and strength. Due to this, it will be beneficial for larger parts in comparison of
thermoplastics. The raw material utilized for manufacturing LFRT includes a different
range of fibers, carbon, stainless steel and polypropylene.
5. Liquid Crystal Polymers (LCP): Brands of LCP mainly utilized for electronics or
electrical applications. These products are also used for high heat cookware applications
6. Celestran continuous fiber reinforced thermoplastic (CFR-TP): This product
reinforced polymer components which make metal no longer an option.
6
Paraphrase This Document
Need a fresh take? Get an instant paraphrase of this document with our AI Paraphraser
7. Cool poly D-Series: This product has electrical isolation along with thermal
conductivity.
8. Cool poly elastomers: This product has a thermal conductivity with a soft to the touch
type of material.
9. Cool Poly E Series: This product has electrical conductivity along with thermal
conductivity, and is in the shape of a pellet and can be used for thermoplastic injection
molding and other practices.
10. Fortron PPS: This product is able to withstand high temperatures and has high
resistance.
11. Impet polyethylene terephthalate (PET): Exceptional physical properties with very
high chemical resistance.
12. Riteflex thermoplastic polyester elastomer (TPC-ET): This product has good
resistance with elasticity of rubber with no softening.
13. Thermx polycyclohexylene-dimethylene terephthalate (PCT): This product has short
term temperature resistance with low moisture engagement.
14. Vandar polybutylene terephthalate (PBT): One of the better products that has
wonderful chemical and thermal resistance along with high heat deflection.
BCG Matrix
7
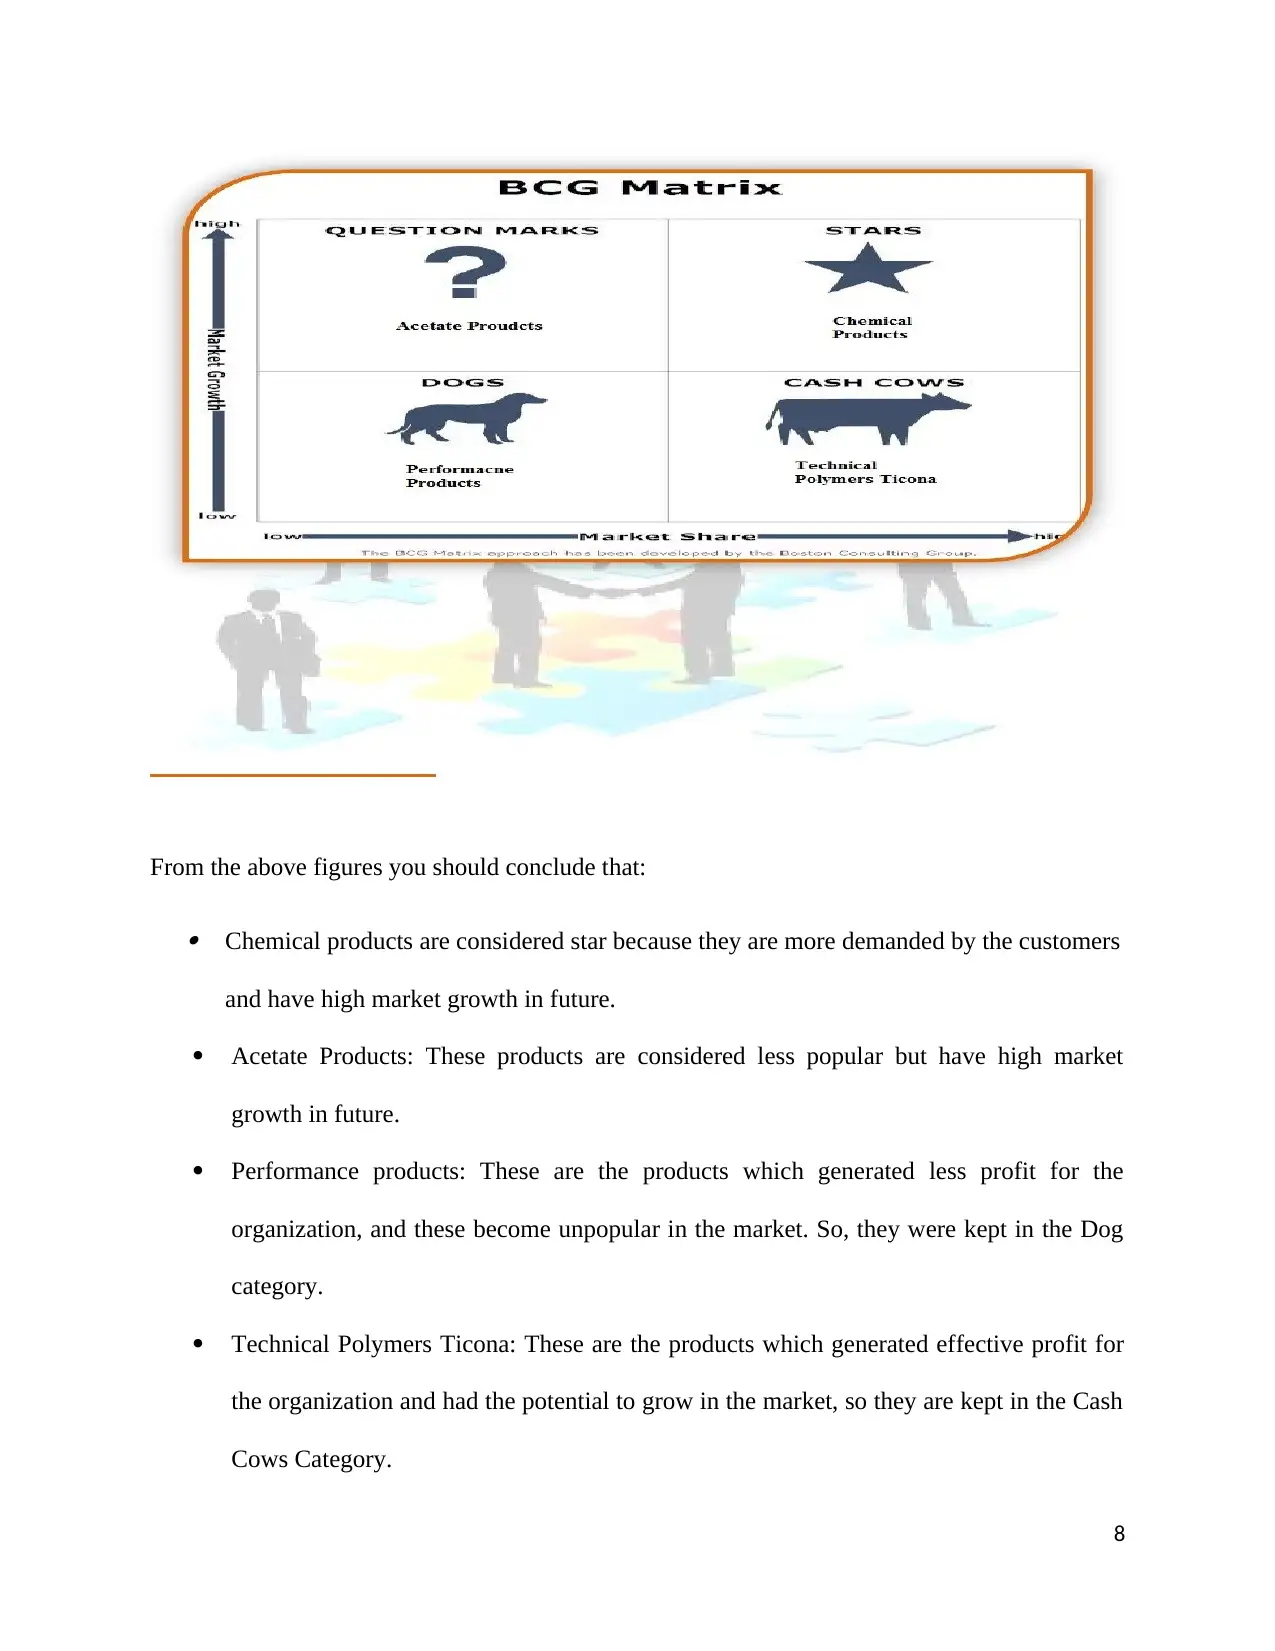
From the above figures you should conclude that:
Chemical products are considered star because they are more demanded by the customers
and have high market growth in future.
Acetate Products: These products are considered less popular but have high market
growth in future.
Performance products: These are the products which generated less profit for the
organization, and these become unpopular in the market. So, they were kept in the Dog
category.
Technical Polymers Ticona: These are the products which generated effective profit for
the organization and had the potential to grow in the market, so they are kept in the Cash
Cows Category.
8
⊘ This is a preview!⊘
Do you want full access?
Subscribe today to unlock all pages.
Trusted by 1+ million students worldwide
4.1.3. Leadership
The top Executives of Celanese are following:
Mark Rohr: He is a Chairman of the Board, President, and Chief Executive officer of
Celanese. He is chairman of the Celanese since April 2012 and a member of the company
board of directors since 2007. Before joining Celanese, he worked for 11 years at
Albemarle Corporation as the profile director and executive chairman. He has his
Bachelor of Science in chemical engineering and chemistry from Mississippi State
University. After getting his degree, he serves on the advisory board for the universities
of Sciences and Arts.
Christopher Jensen: He is the Chief Financial Officer, and Senior Vice President of
Finance for Celanese (Fasting, 2012). He has served at the position of CFO for Celanese
since 2015. He spent 14 years of his career in PricewaterhouseCoopers LLP. He has his
Bachelor’s and Master’s degrees in accounting from Brigham Young University.
Patrick Quarles: He has been appointed for the profile of Executive Vice President for
Acetyls and Integrated Supply Chain of the company. He was appointed in June 2015.
Before joining Celanese, he held various leadership profiles at Lyondell Basell Industries.
The career of Mr. Patrick began in 1990 from ARCO Chemical. In this company, he
worked in the positions of marketing, sales, and business management. He has his
Bachelor of Science in Mechanical Engineering from Clemson University and he has his
Masters in Management from the Kellogg School of Management at Northwestern
University.
4.1.4. Organizational Culture
Celanese’s culture is a flat culture; it means that all employees are treated equally without
considering their title. It is necessary for every employee to fulfill the goals of the organization
9
Paraphrase This Document
Need a fresh take? Get an instant paraphrase of this document with our AI Paraphraser
and also maintain the safety of its operation. Due to the flat organization structure, there isn’t any
hierarchy. Every employee knows who their seniors are, but do not need to keep them on a
pedestal. The management of the company focuses more on changing the culture of the plant and
that is what is expected of their employees as well. The environment of Celanese is family-
friendly. It also focuses more on changing the safety culture which gives the employees relief
from different health problems. Values, Norms, and Rituals of Celanese are the following:
Values: Celanese values are collaboration, being sustainable, creating customer value,
employee growth, improving the world and shareholder value (Schneider, 2013). On the
basis of these values, the organization is able to create its image in the market and also
able to attract a large number of customers towards their product.
Rituals: These help the organization in creating team unity, and offer an enjoyable
environment to employees. Rituals of the organization are organizing award ceremony,
team-building exercises, sales rewards and birthday parties. All of these help the
company in creating a friendly relationship with its employees.
Norms: Celanese norms are performing standardized work, follow rules and guidelines,
and respect for each other. On the basis of these norms, it is one of the most popular
chemical companies in the U.S.
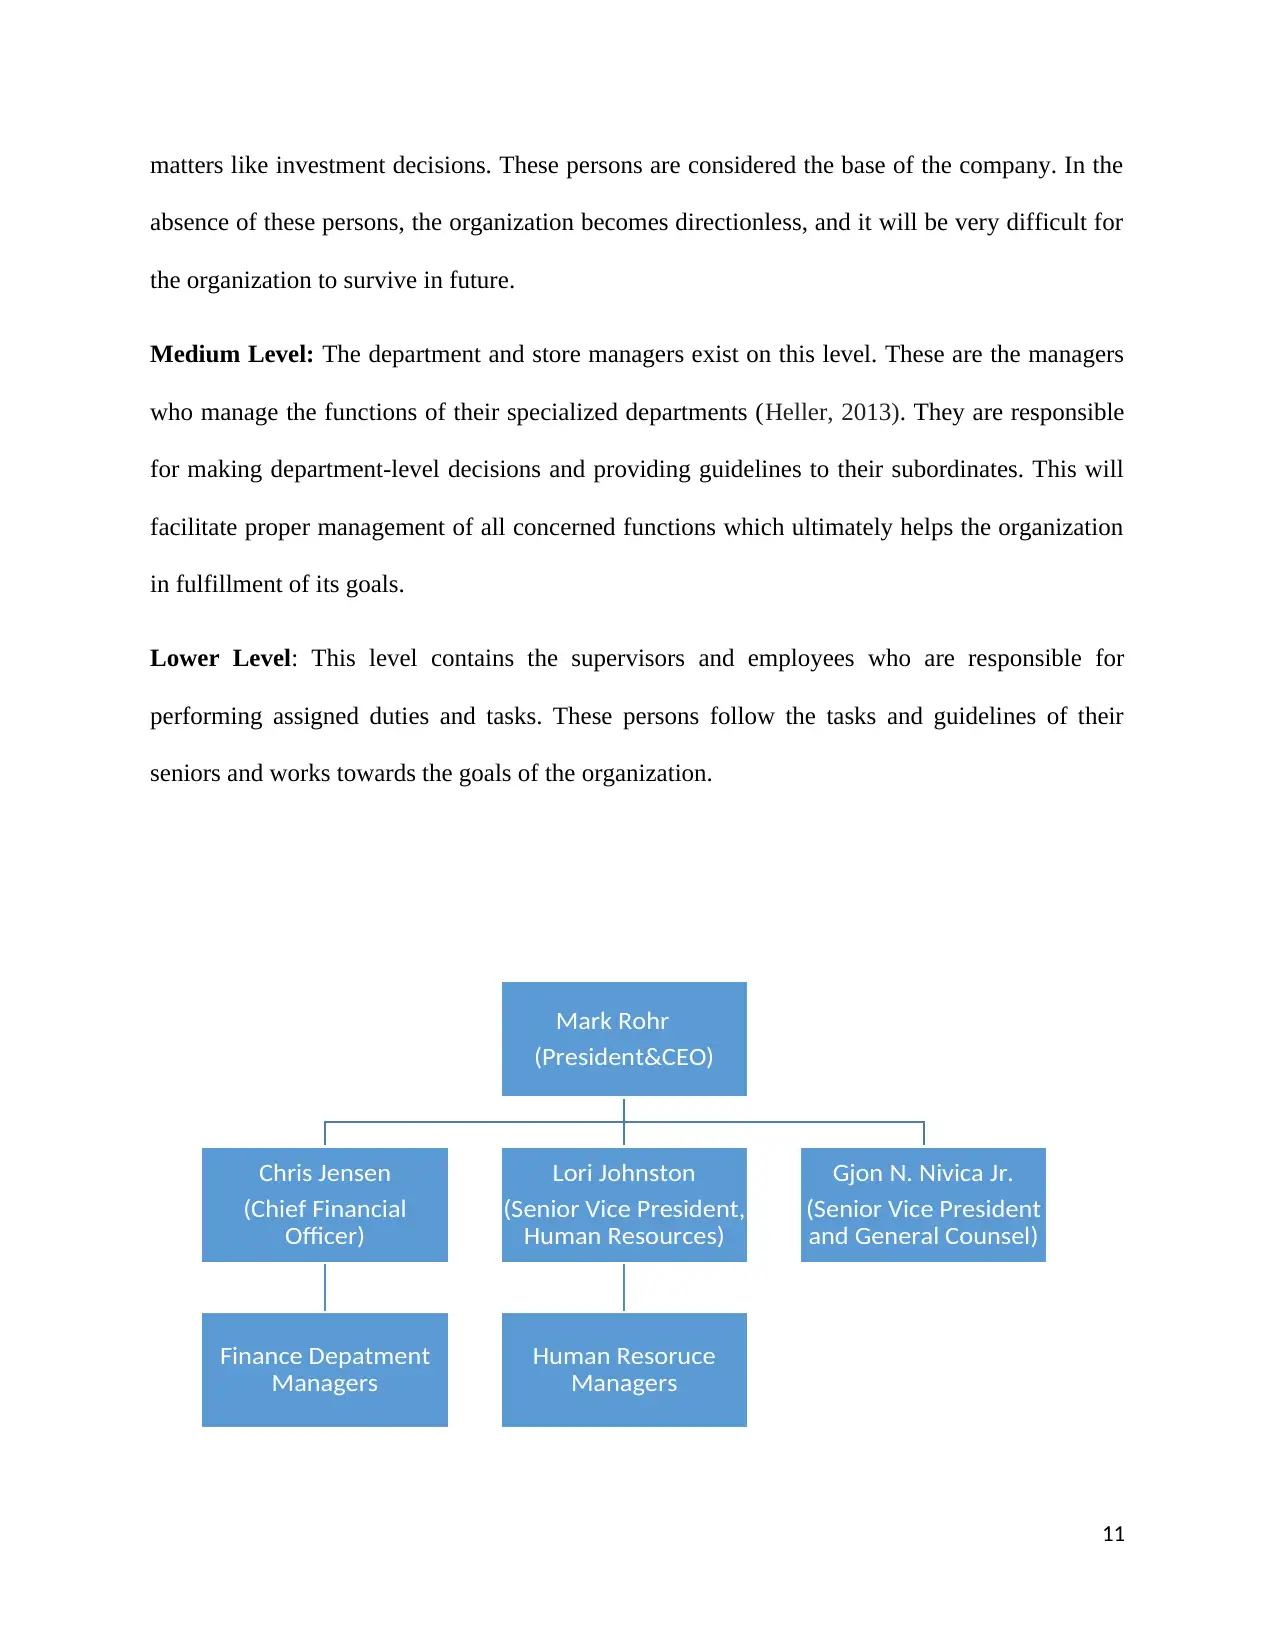
4.1.5. Structure
The structure of Celanese is flat, which means that the company treats all its employees
equally. Duties and obligations of human resources flow in three levels which are known as the
top level, medium level, and lower level.
Top level: The CEO, CFO, and VP's are on the top level. They take the decision regarding the
future of the company. They formulate policies and making a decision regarding the important
10
hierarchy. Every employee knows who their seniors are, but do not need to keep them on a
pedestal. The management of the company focuses more on changing the culture of the plant and
that is what is expected of their employees as well. The environment of Celanese is family-
friendly. It also focuses more on changing the safety culture which gives the employees relief
from different health problems. Values, Norms, and Rituals of Celanese are the following:
Values: Celanese values are collaboration, being sustainable, creating customer value,
employee growth, improving the world and shareholder value (Schneider, 2013). On the
basis of these values, the organization is able to create its image in the market and also
able to attract a large number of customers towards their product.
Rituals: These help the organization in creating team unity, and offer an enjoyable
environment to employees. Rituals of the organization are organizing award ceremony,
team-building exercises, sales rewards and birthday parties. All of these help the
company in creating a friendly relationship with its employees.
Norms: Celanese norms are performing standardized work, follow rules and guidelines,
and respect for each other. On the basis of these norms, it is one of the most popular
chemical companies in the U.S.
4.1.5. Structure
The structure of Celanese is flat, which means that the company treats all its employees
equally. Duties and obligations of human resources flow in three levels which are known as the
top level, medium level, and lower level.
Top level: The CEO, CFO, and VP's are on the top level. They take the decision regarding the
future of the company. They formulate policies and making a decision regarding the important
10
matters like investment decisions. These persons are considered the base of the company. In the
absence of these persons, the organization becomes directionless, and it will be very difficult for
the organization to survive in future.
Medium Level: The department and store managers exist on this level. These are the managers
who manage the functions of their specialized departments (Heller, 2013). They are responsible
for making department-level decisions and providing guidelines to their subordinates. This will
facilitate proper management of all concerned functions which ultimately helps the organization
in fulfillment of its goals.
Lower Level: This level contains the supervisors and employees who are responsible for
performing assigned duties and tasks. These persons follow the tasks and guidelines of their
seniors and works towards the goals of the organization.
11
Mark Rohr
(President&CEO)
Chris Jensen
(Chief Financial
Officer)
Finance Depatment
Managers
Lori Johnston
(Senior Vice President,
Human Resources)
Human Resoruce
Managers
Gjon N. Nivica Jr.
(Senior Vice President
and General Counsel)
⊘ This is a preview!⊘
Do you want full access?
Subscribe today to unlock all pages.
Trusted by 1+ million students worldwide
1 out of 38
Related Documents


Your All-in-One AI-Powered Toolkit for Academic Success.
+13062052269
info@desklib.com
Available 24*7 on WhatsApp / Email
![[object Object]](/_next/static/media/star-bottom.7253800d.svg)
Unlock your academic potential
Copyright © 2020–2026 A2Z Services. All Rights Reserved. Developed and managed by ZUCOL.