Finance Report: Accenture's Financial Performance Analysis
VerifiedAdded on 2021/04/17
|11
|2406
|45
Report
AI Summary
This report provides a comprehensive financial analysis of Accenture, evaluating its stock performance, cash flow per share, and currency exposures. The analysis covers the period from August 31, 2017, to March 8, 2018, highlighting a 21.21% increase in share price. It examines the company's cash flow per share over four years, revealing a decline due to increased dividend payouts. The report assesses Accenture's revenue distribution across North America, Europe, and growth markets, noting the strengthening of the USD against other currencies and the company's use of foreign exchange hedges. It estimates the required rate of return and discusses the factors influencing stock price changes, such as increased net income, high dividends, and strategic business developments. The report concludes by summarizing the key findings and the overall positive financial performance of Accenture during the fiscal year, emphasizing the importance of currency exposure management in mitigating risks.
Running head: INTERNATIONAL BANKING AND FINANCE
International Banking and Finance
Name of the Student:
Name of the University:
Authors Note:
International Banking and Finance
Name of the Student:
Name of the University:
Authors Note:
Paraphrase This Document
Need a fresh take? Get an instant paraphrase of this document with our AI Paraphraser

INTERNATIONAL BANKING AND FINANCE
1
Table of Contents
Part A:........................................................................................................................................2
1
Table of Contents
Part A:........................................................................................................................................2
INTERNATIONAL BANKING AND FINANCE
2
Introduction:
The assessment mainly depicts the overall financial position of Accenture Computers
over the period by evaluating its share price and financial report. In addition, the summary of
company’s stock value from period is evaluated. Moreover, the cash flow per share are also
calculated over the period, where actual wealth retained by the company can be seen.
Furthermore, the strength and weakness of currency is also evaluated with the help of graph,
where required rate of return is depicted of Accenture Computers. The currency valuation of
USD against CAD, GBP and EUR is conducted to identify decline or increment in its
valuation against its international peers. Lastly, the discussion on causes of price change is
discussed in the assessment for Accenture Computers.
Analysis:
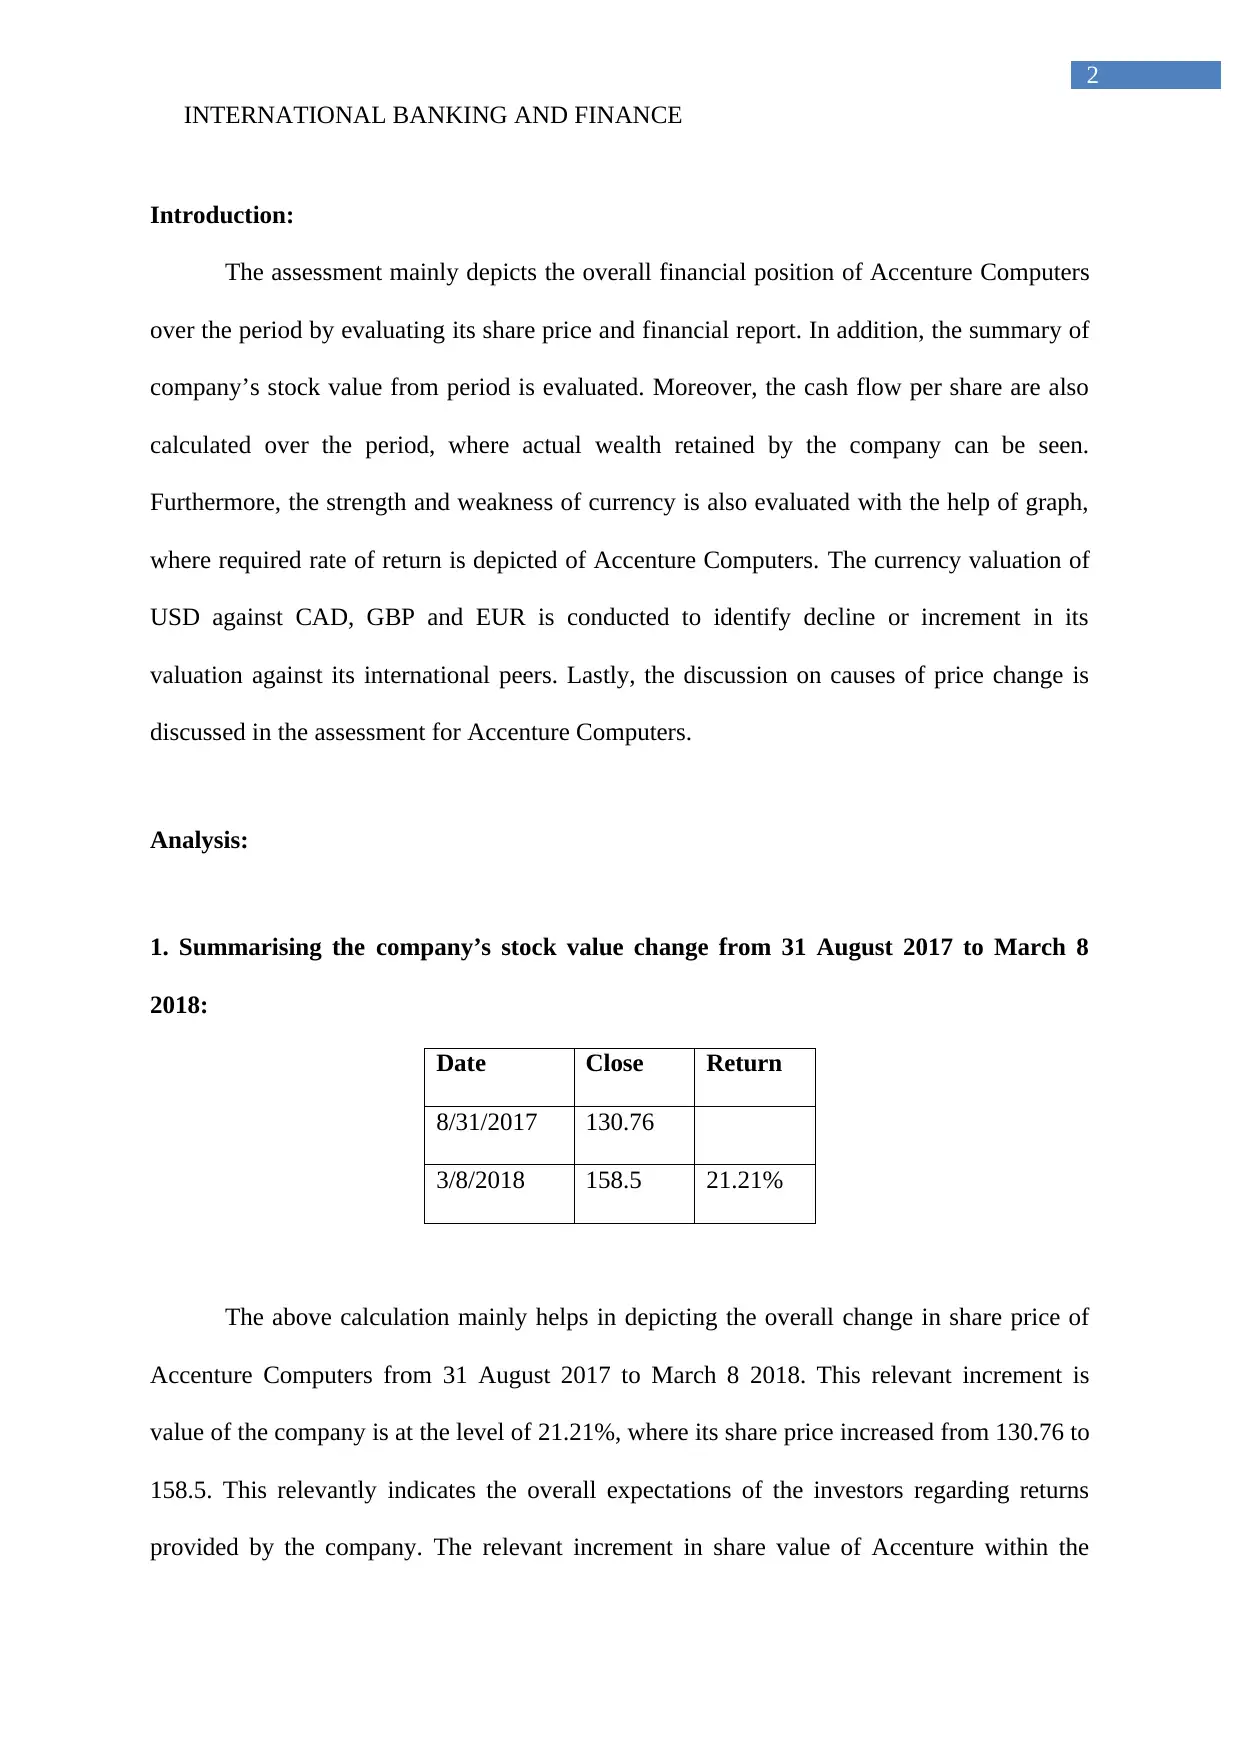
1. Summarising the company’s stock value change from 31 August 2017 to March 8
2018:
Date Close Return
8/31/2017 130.76
3/8/2018 158.5 21.21%
The above calculation mainly helps in depicting the overall change in share price of
Accenture Computers from 31 August 2017 to March 8 2018. This relevant increment is
value of the company is at the level of 21.21%, where its share price increased from 130.76 to
158.5. This relevantly indicates the overall expectations of the investors regarding returns
provided by the company. The relevant increment in share value of Accenture within the
2
Introduction:
The assessment mainly depicts the overall financial position of Accenture Computers
over the period by evaluating its share price and financial report. In addition, the summary of
company’s stock value from period is evaluated. Moreover, the cash flow per share are also
calculated over the period, where actual wealth retained by the company can be seen.
Furthermore, the strength and weakness of currency is also evaluated with the help of graph,
where required rate of return is depicted of Accenture Computers. The currency valuation of
USD against CAD, GBP and EUR is conducted to identify decline or increment in its
valuation against its international peers. Lastly, the discussion on causes of price change is
discussed in the assessment for Accenture Computers.
Analysis:
1. Summarising the company’s stock value change from 31 August 2017 to March 8
2018:
Date Close Return
8/31/2017 130.76
3/8/2018 158.5 21.21%
The above calculation mainly helps in depicting the overall change in share price of
Accenture Computers from 31 August 2017 to March 8 2018. This relevant increment is
value of the company is at the level of 21.21%, where its share price increased from 130.76 to
158.5. This relevantly indicates the overall expectations of the investors regarding returns
provided by the company. The relevant increment in share value of Accenture within the
⊘ This is a preview!⊘
Do you want full access?
Subscribe today to unlock all pages.
Trusted by 1+ million students worldwide
INTERNATIONAL BANKING AND FINANCE
3
pervious year is due to the rise in comprehensive income of the company. The net income
mainly increased from 2,743,925,000 in 2015 to 4,091,974,000 in 2016 (Accenture.com,
2018). This boosted the overall return, which could be provided by the company to its
investors and raised its share value. This increment in overall revenues directly allowed
Accenture to boost their net income and raise the level of dividend payouts to its investors.
The high dividend paid by the organization mainly raised the overall expectations of the
investors, which raise the value of shares and boosted share price of the company for the
period.
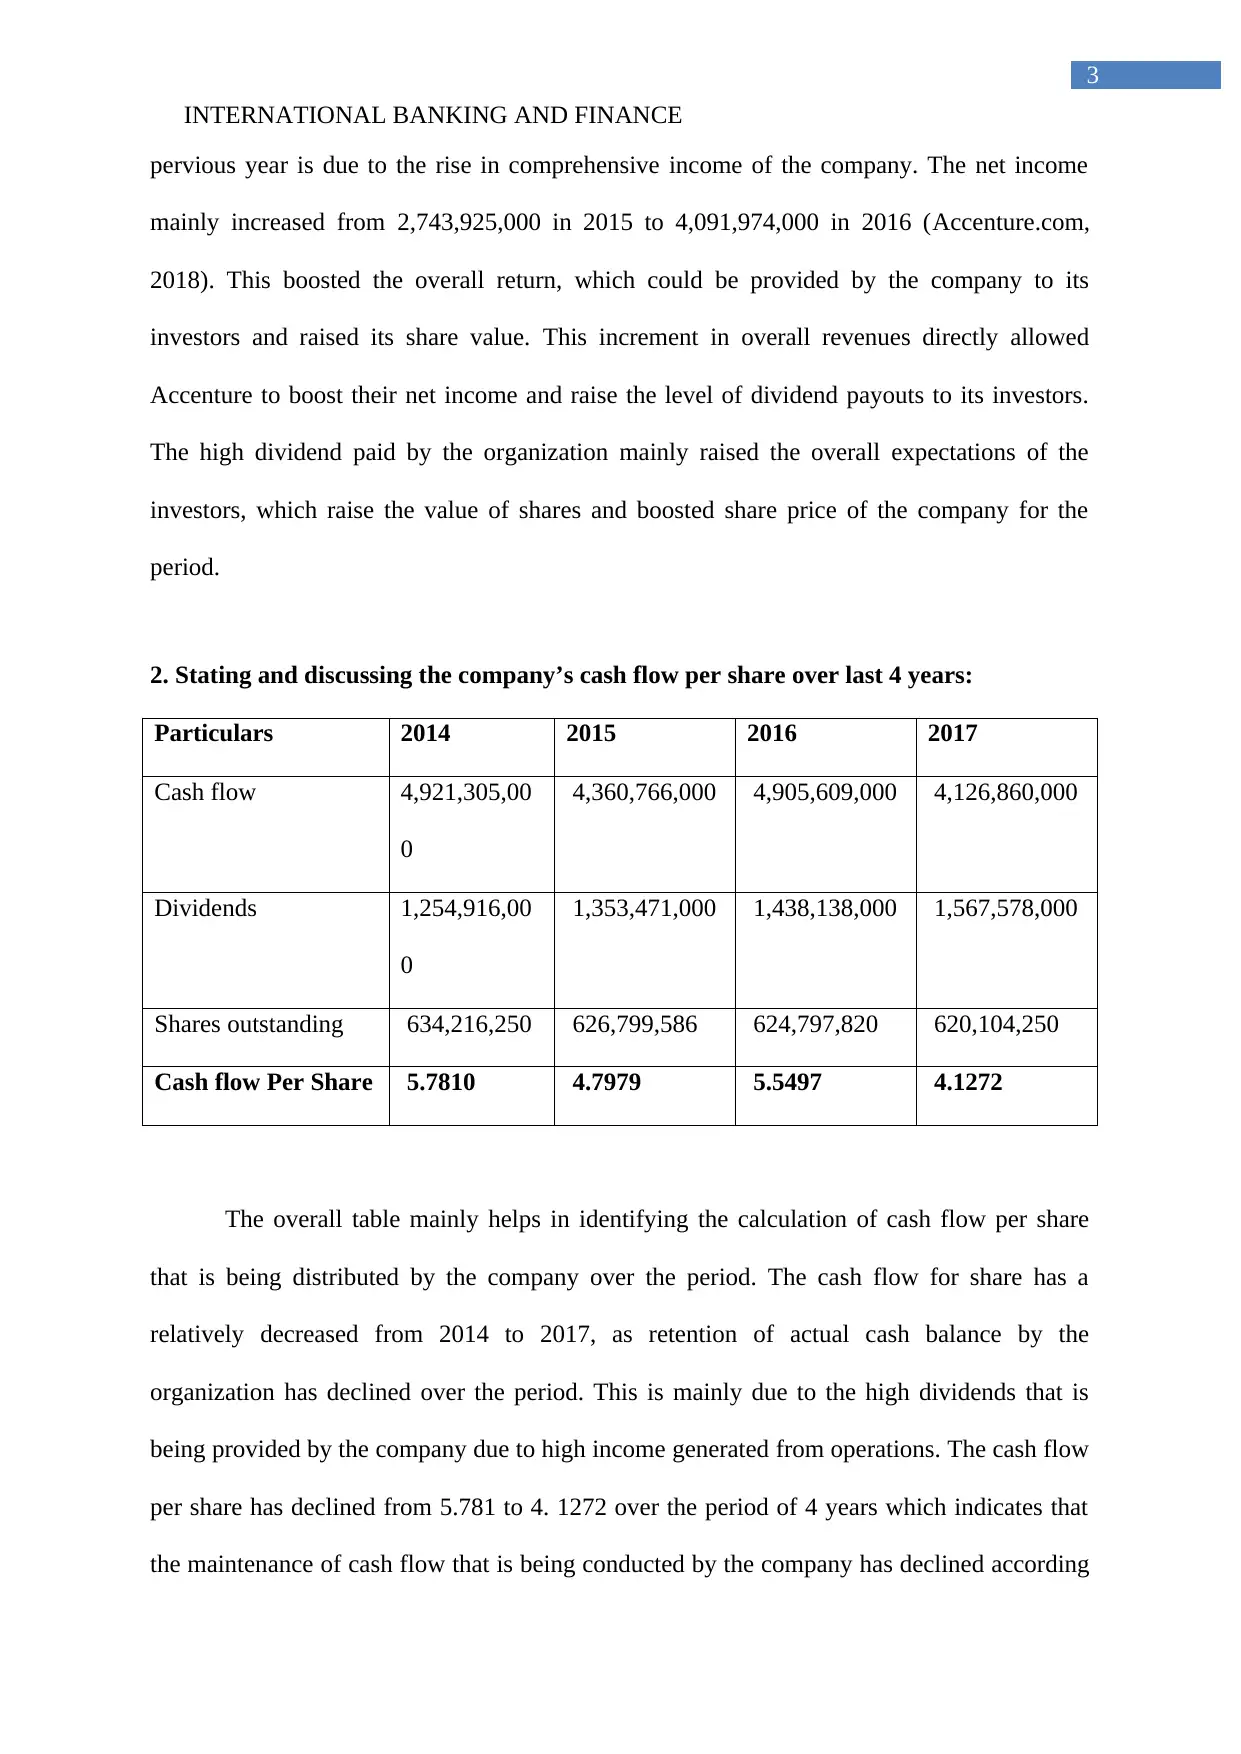
2. Stating and discussing the company’s cash flow per share over last 4 years:
Particulars 2014 2015 2016 2017
Cash flow 4,921,305,00
0
4,360,766,000 4,905,609,000 4,126,860,000
Dividends 1,254,916,00
0
1,353,471,000 1,438,138,000 1,567,578,000
Shares outstanding 634,216,250 626,799,586 624,797,820 620,104,250
Cash flow Per Share 5.7810 4.7979 5.5497 4.1272
The overall table mainly helps in identifying the calculation of cash flow per share
that is being distributed by the company over the period. The cash flow for share has a
relatively decreased from 2014 to 2017, as retention of actual cash balance by the
organization has declined over the period. This is mainly due to the high dividends that is
being provided by the company due to high income generated from operations. The cash flow
per share has declined from 5.781 to 4. 1272 over the period of 4 years which indicates that
the maintenance of cash flow that is being conducted by the company has declined according
3
pervious year is due to the rise in comprehensive income of the company. The net income
mainly increased from 2,743,925,000 in 2015 to 4,091,974,000 in 2016 (Accenture.com,
2018). This boosted the overall return, which could be provided by the company to its
investors and raised its share value. This increment in overall revenues directly allowed
Accenture to boost their net income and raise the level of dividend payouts to its investors.
The high dividend paid by the organization mainly raised the overall expectations of the
investors, which raise the value of shares and boosted share price of the company for the
period.
2. Stating and discussing the company’s cash flow per share over last 4 years:
Particulars 2014 2015 2016 2017
Cash flow 4,921,305,00
0
4,360,766,000 4,905,609,000 4,126,860,000
Dividends 1,254,916,00
0
1,353,471,000 1,438,138,000 1,567,578,000
Shares outstanding 634,216,250 626,799,586 624,797,820 620,104,250
Cash flow Per Share 5.7810 4.7979 5.5497 4.1272
The overall table mainly helps in identifying the calculation of cash flow per share
that is being distributed by the company over the period. The cash flow for share has a
relatively decreased from 2014 to 2017, as retention of actual cash balance by the
organization has declined over the period. This is mainly due to the high dividends that is
being provided by the company due to high income generated from operations. The cash flow
per share has declined from 5.781 to 4. 1272 over the period of 4 years which indicates that
the maintenance of cash flow that is being conducted by the company has declined according
Paraphrase This Document
Need a fresh take? Get an instant paraphrase of this document with our AI Paraphraser
INTERNATIONAL BANKING AND FINANCE
4
to its outstanding shares. The share outstanding of Accenture has relatively declined over the
period, however the dividend payment has increased, which relatively reduces capability of
the company to retain adequate cash in its operations. In this context, Borio, Gambacorta &
Hofmann (2017) mentioned that high payments of dividend decline overall cash that is
currently present within the organization.
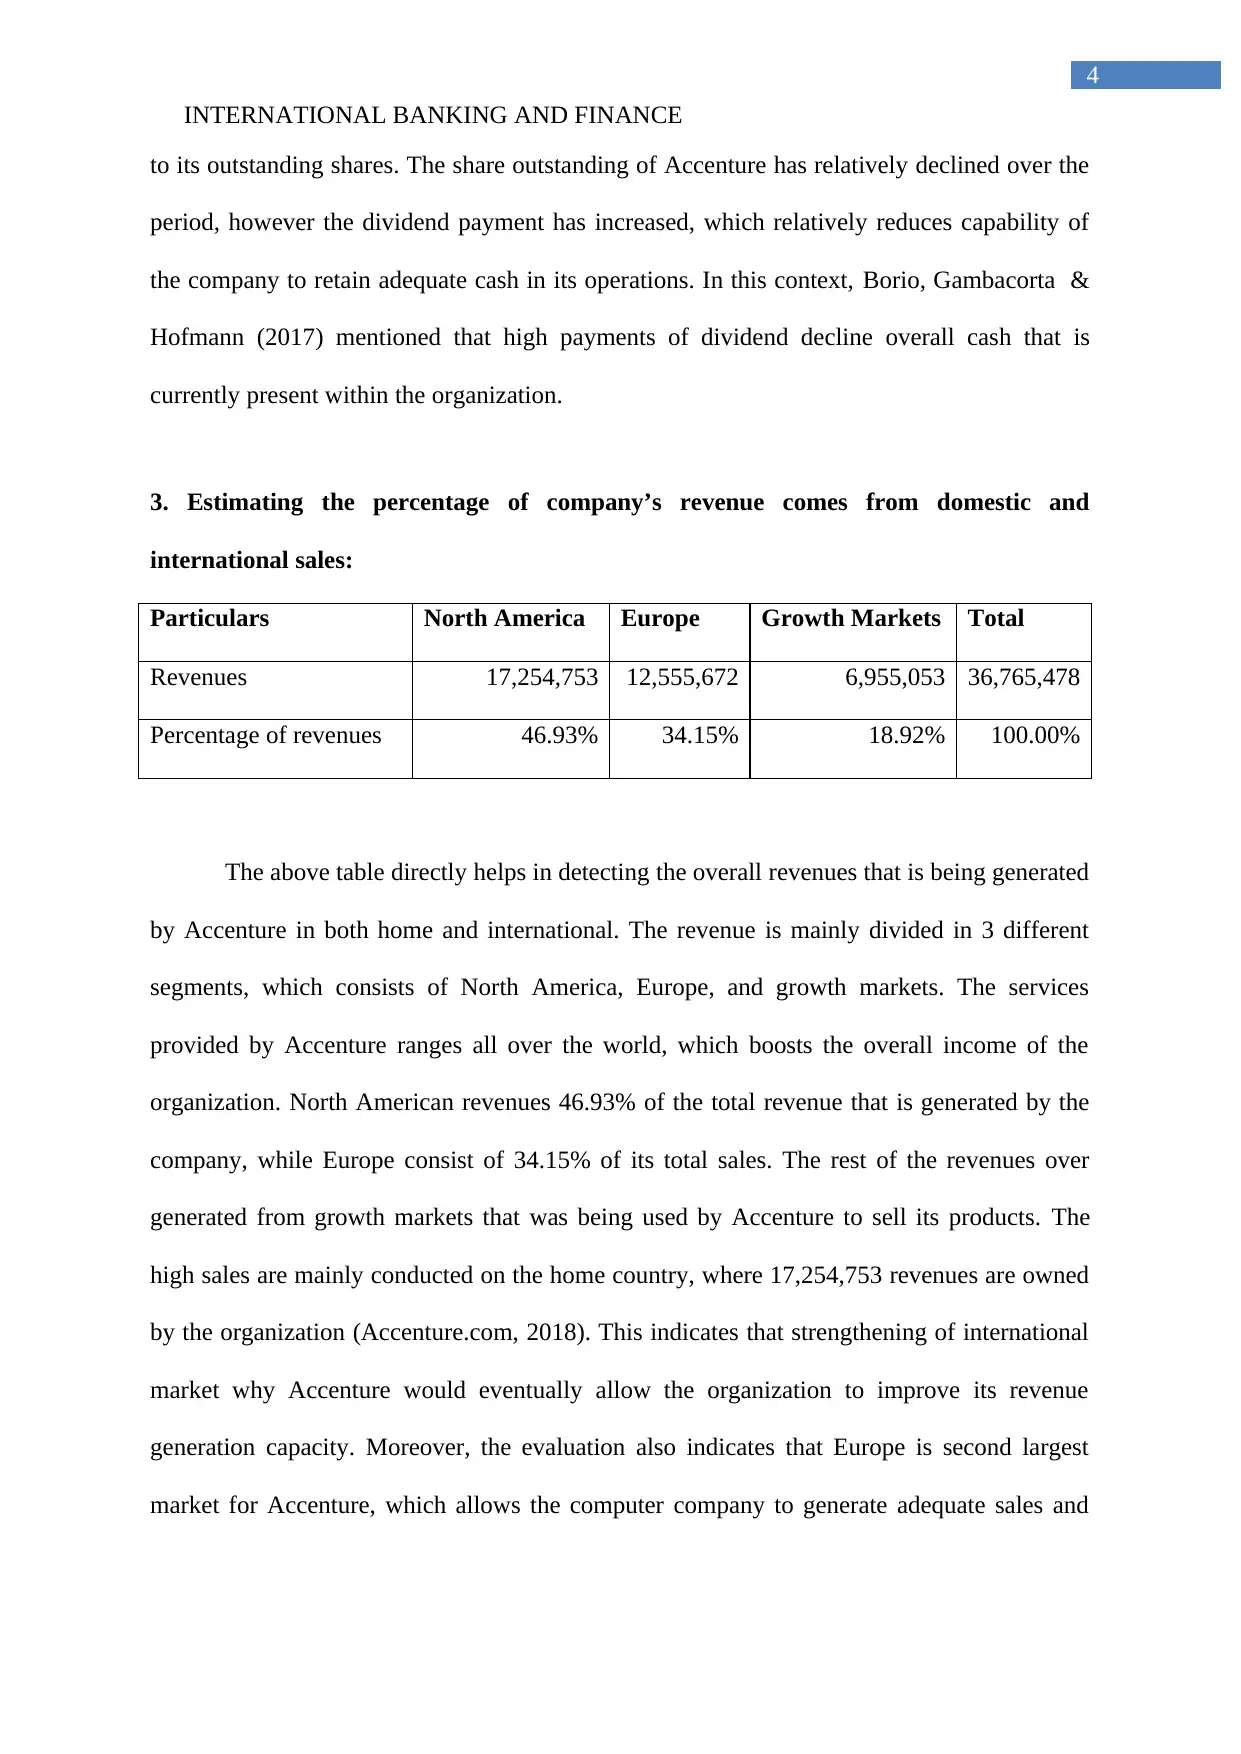
3. Estimating the percentage of company’s revenue comes from domestic and
international sales:
Particulars North America Europe Growth Markets Total
Revenues 17,254,753 12,555,672 6,955,053 36,765,478
Percentage of revenues 46.93% 34.15% 18.92% 100.00%
The above table directly helps in detecting the overall revenues that is being generated
by Accenture in both home and international. The revenue is mainly divided in 3 different
segments, which consists of North America, Europe, and growth markets. The services
provided by Accenture ranges all over the world, which boosts the overall income of the
organization. North American revenues 46.93% of the total revenue that is generated by the
company, while Europe consist of 34.15% of its total sales. The rest of the revenues over
generated from growth markets that was being used by Accenture to sell its products. The
high sales are mainly conducted on the home country, where 17,254,753 revenues are owned
by the organization (Accenture.com, 2018). This indicates that strengthening of international
market why Accenture would eventually allow the organization to improve its revenue
generation capacity. Moreover, the evaluation also indicates that Europe is second largest
market for Accenture, which allows the computer company to generate adequate sales and
4
to its outstanding shares. The share outstanding of Accenture has relatively declined over the
period, however the dividend payment has increased, which relatively reduces capability of
the company to retain adequate cash in its operations. In this context, Borio, Gambacorta &
Hofmann (2017) mentioned that high payments of dividend decline overall cash that is
currently present within the organization.
3. Estimating the percentage of company’s revenue comes from domestic and
international sales:
Particulars North America Europe Growth Markets Total
Revenues 17,254,753 12,555,672 6,955,053 36,765,478
Percentage of revenues 46.93% 34.15% 18.92% 100.00%
The above table directly helps in detecting the overall revenues that is being generated
by Accenture in both home and international. The revenue is mainly divided in 3 different
segments, which consists of North America, Europe, and growth markets. The services
provided by Accenture ranges all over the world, which boosts the overall income of the
organization. North American revenues 46.93% of the total revenue that is generated by the
company, while Europe consist of 34.15% of its total sales. The rest of the revenues over
generated from growth markets that was being used by Accenture to sell its products. The
high sales are mainly conducted on the home country, where 17,254,753 revenues are owned
by the organization (Accenture.com, 2018). This indicates that strengthening of international
market why Accenture would eventually allow the organization to improve its revenue
generation capacity. Moreover, the evaluation also indicates that Europe is second largest
market for Accenture, which allows the computer company to generate adequate sales and
INTERNATIONAL BANKING AND FINANCE
5
replenish its cash flow. Frieden (2015) stated that detection of overall revenue generating
sectors might allow the management to take adequate steps for increasing its market share.
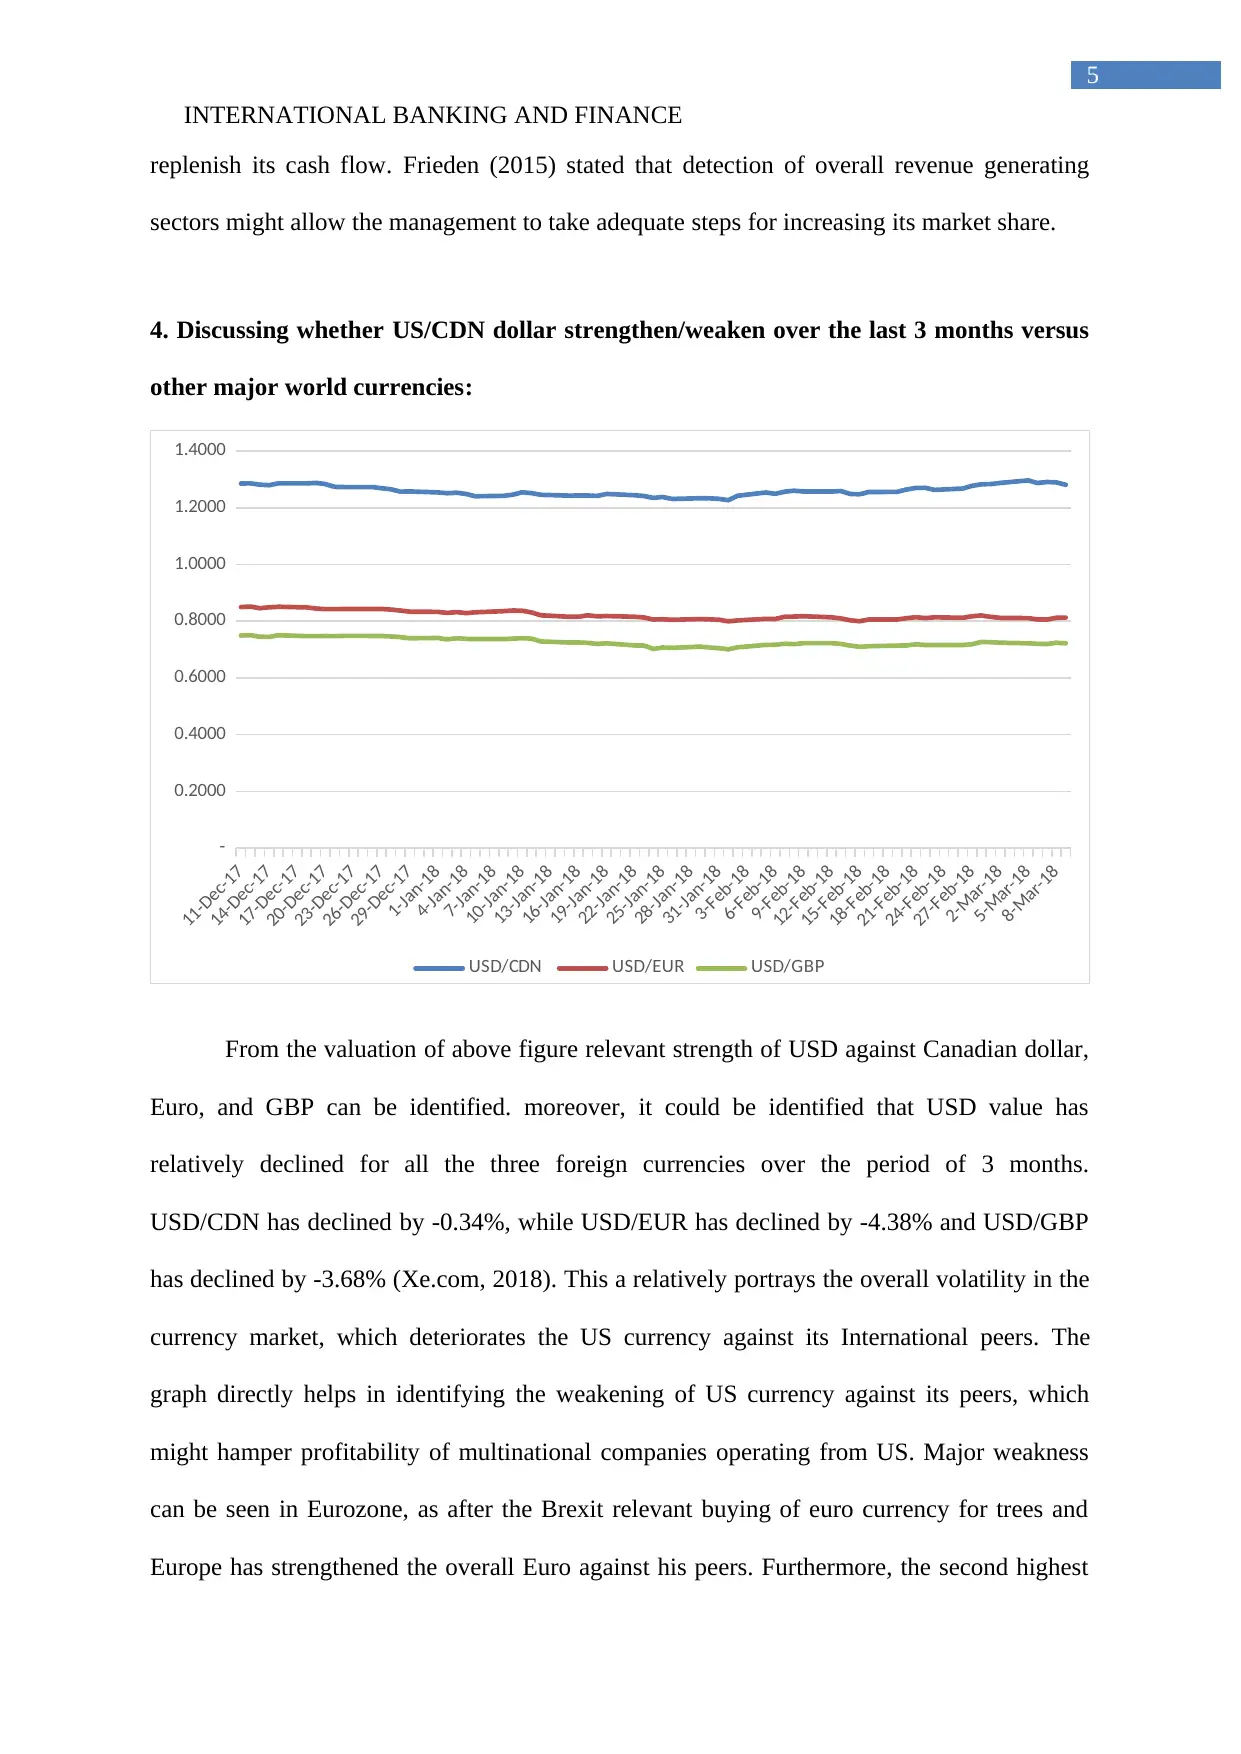
4. Discussing whether US/CDN dollar strengthen/weaken over the last 3 months versus
other major world currencies:
11-Dec-17
14-Dec-17
17-Dec-17
20-Dec-17
23-Dec-17
26-Dec-17
29-Dec-17
1-Jan-18
4-Jan-18
7-Jan-18
10-Jan-18
13-Jan-18
16-Jan-18
19-Jan-18
22-Jan-18
25-Jan-18
28-Jan-18
31-Jan-18
3-Feb-18
6-Feb-18
9-Feb-18
12-Feb-18
15-Feb-18
18-Feb-18
21-Feb-18
24-Feb-18
27-Feb-18
2-Mar-18
5-Mar-18
8-Mar-18
-
0.2000
0.4000
0.6000
0.8000
1.0000
1.2000
1.4000
USD/CDN USD/EUR USD/GBP
From the valuation of above figure relevant strength of USD against Canadian dollar,
Euro, and GBP can be identified. moreover, it could be identified that USD value has
relatively declined for all the three foreign currencies over the period of 3 months.
USD/CDN has declined by -0.34%, while USD/EUR has declined by -4.38% and USD/GBP
has declined by -3.68% (Xe.com, 2018). This a relatively portrays the overall volatility in the
currency market, which deteriorates the US currency against its International peers. The
graph directly helps in identifying the weakening of US currency against its peers, which
might hamper profitability of multinational companies operating from US. Major weakness
can be seen in Eurozone, as after the Brexit relevant buying of euro currency for trees and
Europe has strengthened the overall Euro against his peers. Furthermore, the second highest
5
replenish its cash flow. Frieden (2015) stated that detection of overall revenue generating
sectors might allow the management to take adequate steps for increasing its market share.
4. Discussing whether US/CDN dollar strengthen/weaken over the last 3 months versus
other major world currencies:
11-Dec-17
14-Dec-17
17-Dec-17
20-Dec-17
23-Dec-17
26-Dec-17
29-Dec-17
1-Jan-18
4-Jan-18
7-Jan-18
10-Jan-18
13-Jan-18
16-Jan-18
19-Jan-18
22-Jan-18
25-Jan-18
28-Jan-18
31-Jan-18
3-Feb-18
6-Feb-18
9-Feb-18
12-Feb-18
15-Feb-18
18-Feb-18
21-Feb-18
24-Feb-18
27-Feb-18
2-Mar-18
5-Mar-18
8-Mar-18
-
0.2000
0.4000
0.6000
0.8000
1.0000
1.2000
1.4000
USD/CDN USD/EUR USD/GBP
From the valuation of above figure relevant strength of USD against Canadian dollar,
Euro, and GBP can be identified. moreover, it could be identified that USD value has
relatively declined for all the three foreign currencies over the period of 3 months.
USD/CDN has declined by -0.34%, while USD/EUR has declined by -4.38% and USD/GBP
has declined by -3.68% (Xe.com, 2018). This a relatively portrays the overall volatility in the
currency market, which deteriorates the US currency against its International peers. The
graph directly helps in identifying the weakening of US currency against its peers, which
might hamper profitability of multinational companies operating from US. Major weakness
can be seen in Eurozone, as after the Brexit relevant buying of euro currency for trees and
Europe has strengthened the overall Euro against his peers. Furthermore, the second highest
⊘ This is a preview!⊘
Do you want full access?
Subscribe today to unlock all pages.
Trusted by 1+ million students worldwide
INTERNATIONAL BANKING AND FINANCE
6
loss in currency value of USD is from GBP, as it is competing to be one of the internationally
recognized currency.
5. Discussing the type of exposures that is presented in financial report of the company:
Foreign exchange Hedge is mainly used by Accenture for reducing the negative
impact of currency conversion peanuts balance sheet. Besides, forward contract note is
relatively used by the organization to hedge its overall foreign exchange exposure. this
ratably helps in reducing the negative impact that might increase from fluctuating foreign
exchange rates. Moreover, the organization uses exchange instruments which is relatively
short term in nature, which matures in one year. These short-term trades mainly allow
Accenture to effectively realize gains or losses in the current fiscal year and does not increase
the time duration of the financial instrument. Currently Accenture has derivatives with net
gain of $66,748 for fiscal 2017 and a net loss of $84,293 and $257,783 for fiscal 2016 and
2015. From the evaluation of the annual report it would be identified that relevant farewell
use of the derivatives used by Accenture are at $177,057 in 2017, while at $95,829 in 2016
(Accenture.com, 2018). This indicates that relevant valuation of the derivatives has increased
over the period and allowed the organization to gain adequate net income from its exposure
of foreign currency market.
On further evaluation of the annual report it could be seen that total Assets on
derivatives market is relatively higher than the overall liabilities of the company. this
indicates the positive attribute, which might help the organization to reduce the negative
impact from foreign currency fluctuations. Maximum of the wealth that is acquired by
Accenture is from international business, which requires adequate investments in derivatives
and foreign exchange market. Therefore, by using forward contracts, Accenture is able to
increase its notional value of derivatives from $7,604,486 in 2016 to $9,290,345 in 2017.
Paraphrase This Document
Need a fresh take? Get an instant paraphrase of this document with our AI Paraphraser
INTERNATIONAL BANKING AND FINANCE
7
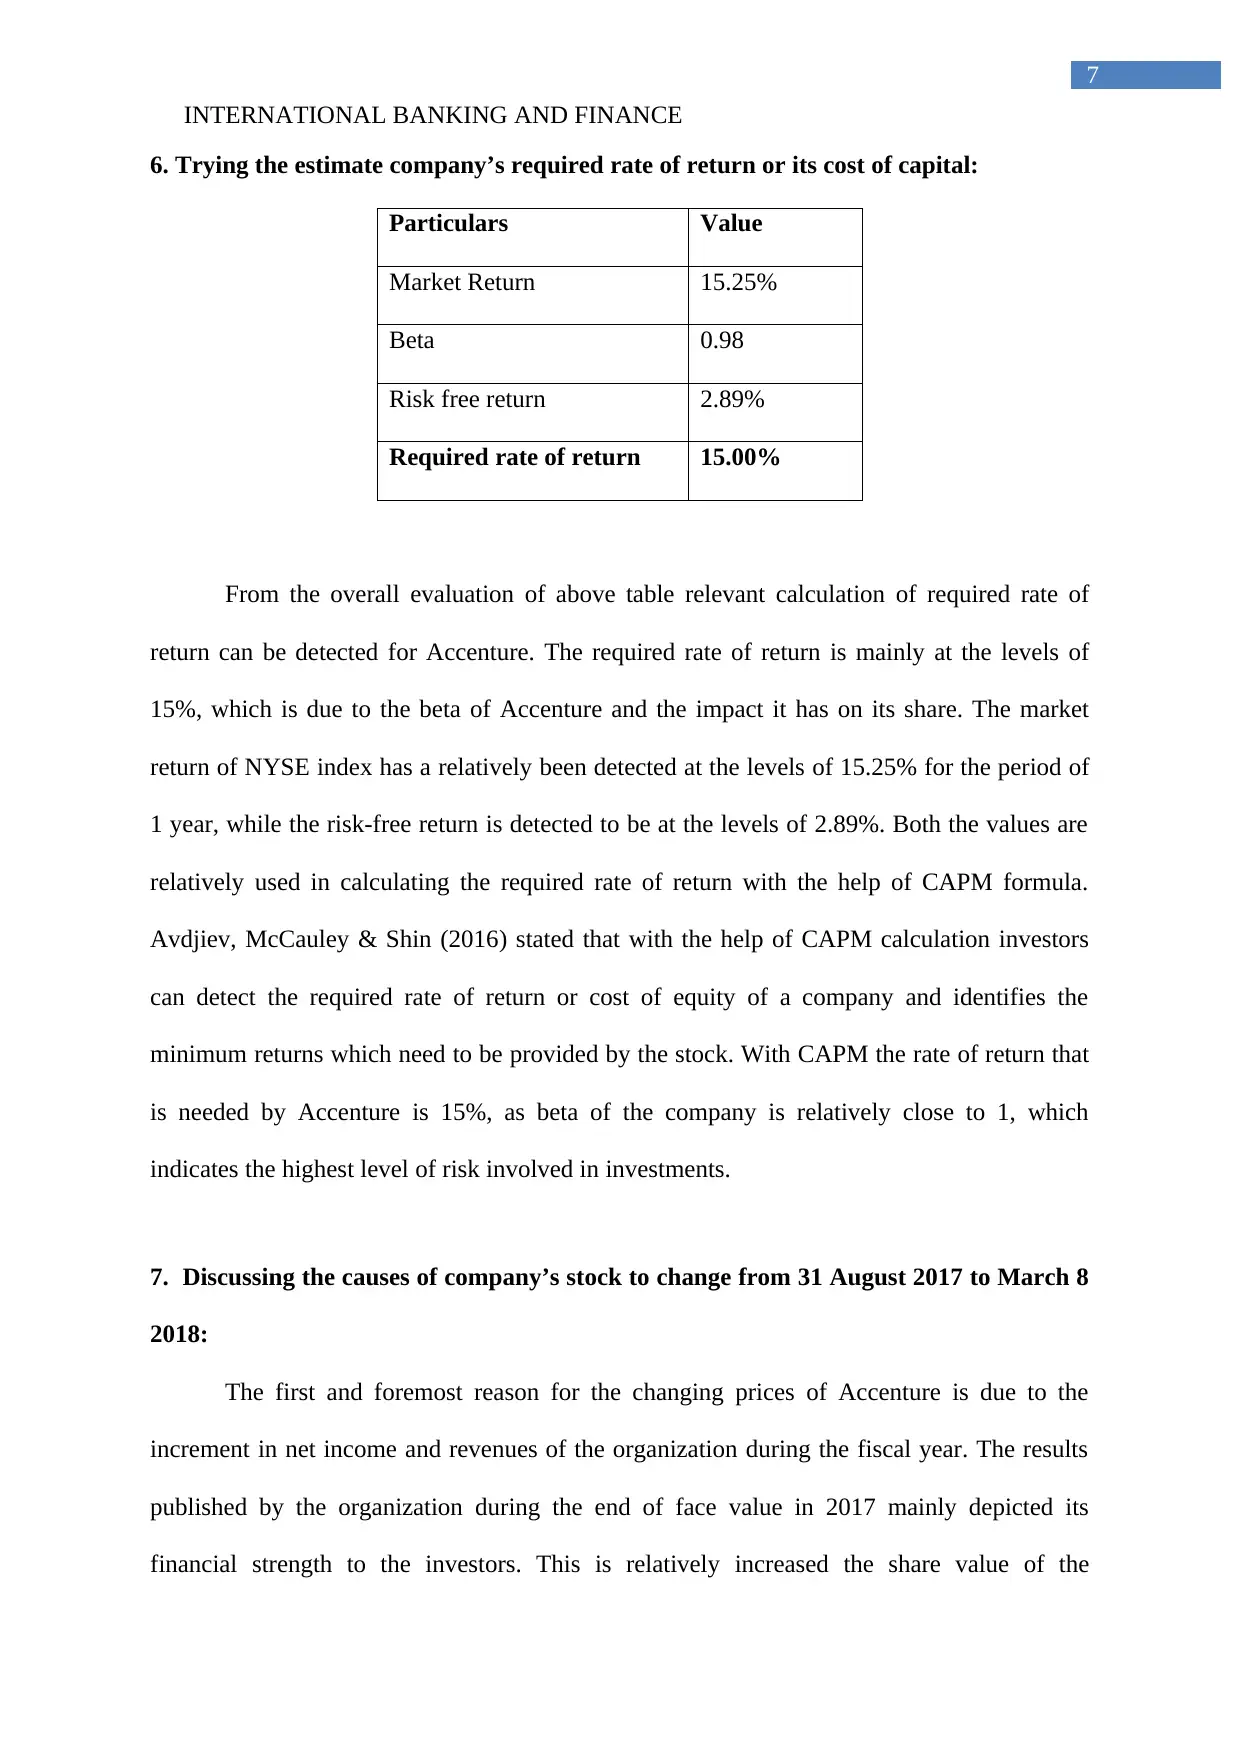
6. Trying the estimate company’s required rate of return or its cost of capital:
Particulars Value
Market Return 15.25%
Beta 0.98
Risk free return 2.89%
Required rate of return 15.00%
From the overall evaluation of above table relevant calculation of required rate of
return can be detected for Accenture. The required rate of return is mainly at the levels of
15%, which is due to the beta of Accenture and the impact it has on its share. The market
return of NYSE index has a relatively been detected at the levels of 15.25% for the period of
1 year, while the risk-free return is detected to be at the levels of 2.89%. Both the values are
relatively used in calculating the required rate of return with the help of CAPM formula.
Avdjiev, McCauley & Shin (2016) stated that with the help of CAPM calculation investors
can detect the required rate of return or cost of equity of a company and identifies the
minimum returns which need to be provided by the stock. With CAPM the rate of return that
is needed by Accenture is 15%, as beta of the company is relatively close to 1, which
indicates the highest level of risk involved in investments.
7. Discussing the causes of company’s stock to change from 31 August 2017 to March 8
2018:
The first and foremost reason for the changing prices of Accenture is due to the
increment in net income and revenues of the organization during the fiscal year. The results
published by the organization during the end of face value in 2017 mainly depicted its
financial strength to the investors. This is relatively increased the share value of the
7
6. Trying the estimate company’s required rate of return or its cost of capital:
Particulars Value
Market Return 15.25%
Beta 0.98
Risk free return 2.89%
Required rate of return 15.00%
From the overall evaluation of above table relevant calculation of required rate of
return can be detected for Accenture. The required rate of return is mainly at the levels of
15%, which is due to the beta of Accenture and the impact it has on its share. The market
return of NYSE index has a relatively been detected at the levels of 15.25% for the period of
1 year, while the risk-free return is detected to be at the levels of 2.89%. Both the values are
relatively used in calculating the required rate of return with the help of CAPM formula.
Avdjiev, McCauley & Shin (2016) stated that with the help of CAPM calculation investors
can detect the required rate of return or cost of equity of a company and identifies the
minimum returns which need to be provided by the stock. With CAPM the rate of return that
is needed by Accenture is 15%, as beta of the company is relatively close to 1, which
indicates the highest level of risk involved in investments.
7. Discussing the causes of company’s stock to change from 31 August 2017 to March 8
2018:
The first and foremost reason for the changing prices of Accenture is due to the
increment in net income and revenues of the organization during the fiscal year. The results
published by the organization during the end of face value in 2017 mainly depicted its
financial strength to the investors. This is relatively increased the share value of the
INTERNATIONAL BANKING AND FINANCE
8
organization due to high demand from investors. The second foremost reason is the high
dividend that is being paid by the organization during the fiscal year. This has boosted the
relevant demand of the company among investors the expectation of high dividends and
growth. On the other news, Accenture opens innovation hub in Zurich, which is allowed the
organization to capture More market and increase its profitability. Accenture was selected by
Walt Disney Studios as an innovative partner, which helped in boosting its revenues
(Reuters.com, 2018). The last relevant news was the selection of Accenture by Hershey
company to support growth plans and accelerate innovation in the process. these
accomplishments during the year has allowed the organization to effectively increase its share
price. The news depicted in the above statements fueled in the overall growth and
Expectations of investors, which boosted share price of Accenture from 130.78 in 2017 to
158.5 in 2018.
Conclusion:
From the overall evaluation the financial performance of Accenture relatively
increased over the period of one fiscal year, which boosted its share price. The financial
performance has relatively improved seeing the overall jump in net income and revenue of
the organization. The Other valuations such as cash per share has relatively declined over the
period due to low accumulation of cash within the organization. The company has adequately
use the currency exposure for reducing any kind of negative impact from currency market.
this is relatively help in increasing derivative value and reducing any kind of losses, which
might incur from volatile currency market.
⊘ This is a preview!⊘
Do you want full access?
Subscribe today to unlock all pages.
Trusted by 1+ million students worldwide

INTERNATIONAL BANKING AND FINANCE
9
9
Paraphrase This Document
Need a fresh take? Get an instant paraphrase of this document with our AI Paraphraser
INTERNATIONAL BANKING AND FINANCE
10
Reference and Bibliography:
Accenture.com. (2018). Accenture.com. Retrieved 10 March 2018, from
https://www.accenture.com/us-en/company-annual-report
Avdjiev, S., McCauley, R. N., & Shin, H. S. (2016). Breaking free of the triple coincidence in
international finance. Economic Policy, 31(87), 409-451.
Bloomberg.com. (2018). Bloomberg.com. Retrieved 10 March 2018, from
https://www.bloomberg.com/asia
Borio, C., Gambacorta, L., & Hofmann, B. (2017). The influence of monetary policy on bank
profitability. International Finance, 20(1), 48-63.
Cheung, Y. W., Chinn, M., & Nong, X. (2017). Estimating currency misalignment using the
Penn effect: It is not as simple as it looks. International Finance, 20(3), 222-242.
Chinn, M., & Kucko, K. (2015). The predictive power of the yield curve across countries and
time. International Finance, 18(2), 129-156.
Frieden, J. (2015). Banking on the world: the politics of American international finance.
Routledge.
Frisari, G., & Stadelmann, M. (2015). De-risking concentrated solar power in emerging
markets: The role of policies and international finance institutions. Energy Policy, 82,
12-22.
Gambacorta, L., Illes, A., & Lombardi, M. J. (2015). Has the Transmission of Policy Rates to
Lending Rates Changed in the Wake of the Global Financial Crisis?. International
Finance, 18(3), 263-280.
1 out of 11
Related Documents


Your All-in-One AI-Powered Toolkit for Academic Success.
+13062052269
info@desklib.com
Available 24*7 on WhatsApp / Email
![[object Object]](/_next/static/media/star-bottom.7253800d.svg)
Unlock your academic potential
Copyright © 2020–2026 A2Z Services. All Rights Reserved. Developed and managed by ZUCOL.