Comprehensive Report: BilT International Business Finance
VerifiedAdded on 2020/05/11
|22
|5440
|63
Report
AI Summary
This report provides a comprehensive analysis of BilT, an Australian body care product company, and its international finance strategy for entering the Argentine market. The report examines the company's annual cash flow projections over five years, considering factors such as sales, costs, and inflation. It also delves into hedging strategies to mitigate currency exchange risks and assesses the impact of different borrowing rates in Argentina and Australia on the company's net present value (NPV). The report further explores the cost of equity using the Capital Asset Pricing Model (CAPM) and discusses the effects of global currency and financial crises on BilT's operations. The analysis includes detailed tables and figures illustrating cash flow, hedging effectiveness, and NPV calculations, providing insights into the financial viability of BilT's international expansion plans.
Running Header: International business finance
1
INTERNATIONAL BUSINESS FINANCE
1
INTERNATIONAL BUSINESS FINANCE
Paraphrase This Document
Need a fresh take? Get an instant paraphrase of this document with our AI Paraphraser
International business finance
2
Executive Summary
The report has primarily emphasized upon BilT, which is an Australian organization that is into
the business of producing body care products. While having produced a new sunscreen, it had
aimed to capture the Argentine market, which it thinks to be promising as well as prosperous.
Therefore, the report has developed the statement for the annual cash flow of the company in
order to determine its impacts in the market for the upcoming five fiscal years. Moreover, the
report has also determined the risk associated to the exchange in the currency structure, from
conducting the trade in Australia to that in Argentina. The risk is being managed by means of
hedging, and therefore, the strategies for various forward rates are being estimated.
The report also determines the net present value for the company; both in the Argentine as well
as the Australian context, when it considers the initial investment to be split off against different
rates of borrow. Finally, the report discusses the cost of equity based on the CAPM, and the
impacts of the currency and other financial crises on the company’s trade.
International business finance
3
Table of Contents
Introduction......................................................................................................................................5
Findings and discussions.................................................................................................................5
a. General annual cash flow.............................................................................................................5
b. Hedging and cash flow................................................................................................................8
c. Difference in borrow..................................................................................................................11
d. Cost of Equity............................................................................................................................12
e. Effect of global crisis.................................................................................................................15
Conclusion.....................................................................................................................................18
Reference List................................................................................................................................19
⊘ This is a preview!⊘
Do you want full access?
Subscribe today to unlock all pages.
Trusted by 1+ million students worldwide
International business finance
4
List of Figures
Figure 1: Cumulative cash flow for BilT.........................................................................................8
Figure 2: Cumulative hedged NPV for BilT..................................................................................10
Figure 3: Factors affecting Cost of equity.....................................................................................13
Figure 4: Estimation of risk free rate.............................................................................................14
Figure 5: Effect of global banking crises.......................................................................................15
Figure 6: Effect of global currency crises (1980-1998).................................................................16
Paraphrase This Document
Need a fresh take? Get an instant paraphrase of this document with our AI Paraphraser
International business finance
5
Introduction
International business finance is the trade that focuses mainly on dealing with the financial issues
that appears when a company plans to spread its business abroad. The factors are therefore quite
necessary to be determined, as they account for the challenges faced by the company under alien
economic conditions.
The primary focus of the report is to identify the annual cash flow for the Australian company
for BilT, a company that produces body care products and wants to spread its business in
Argentina. While doing that, it has to determine the effects of hedging occurring due to the
difference in currencies and the variability in the exchange rates. The report also highlights on
the issues of determining the best possible financial strategies that needs to be taken by the
company in order to generate better revenue. Therefore, it focuses on determining whether to go
for the various investments in Australia or in Argentina, based on the financial comparison of the
two countries through the method of CAPM.
Findings and discussions
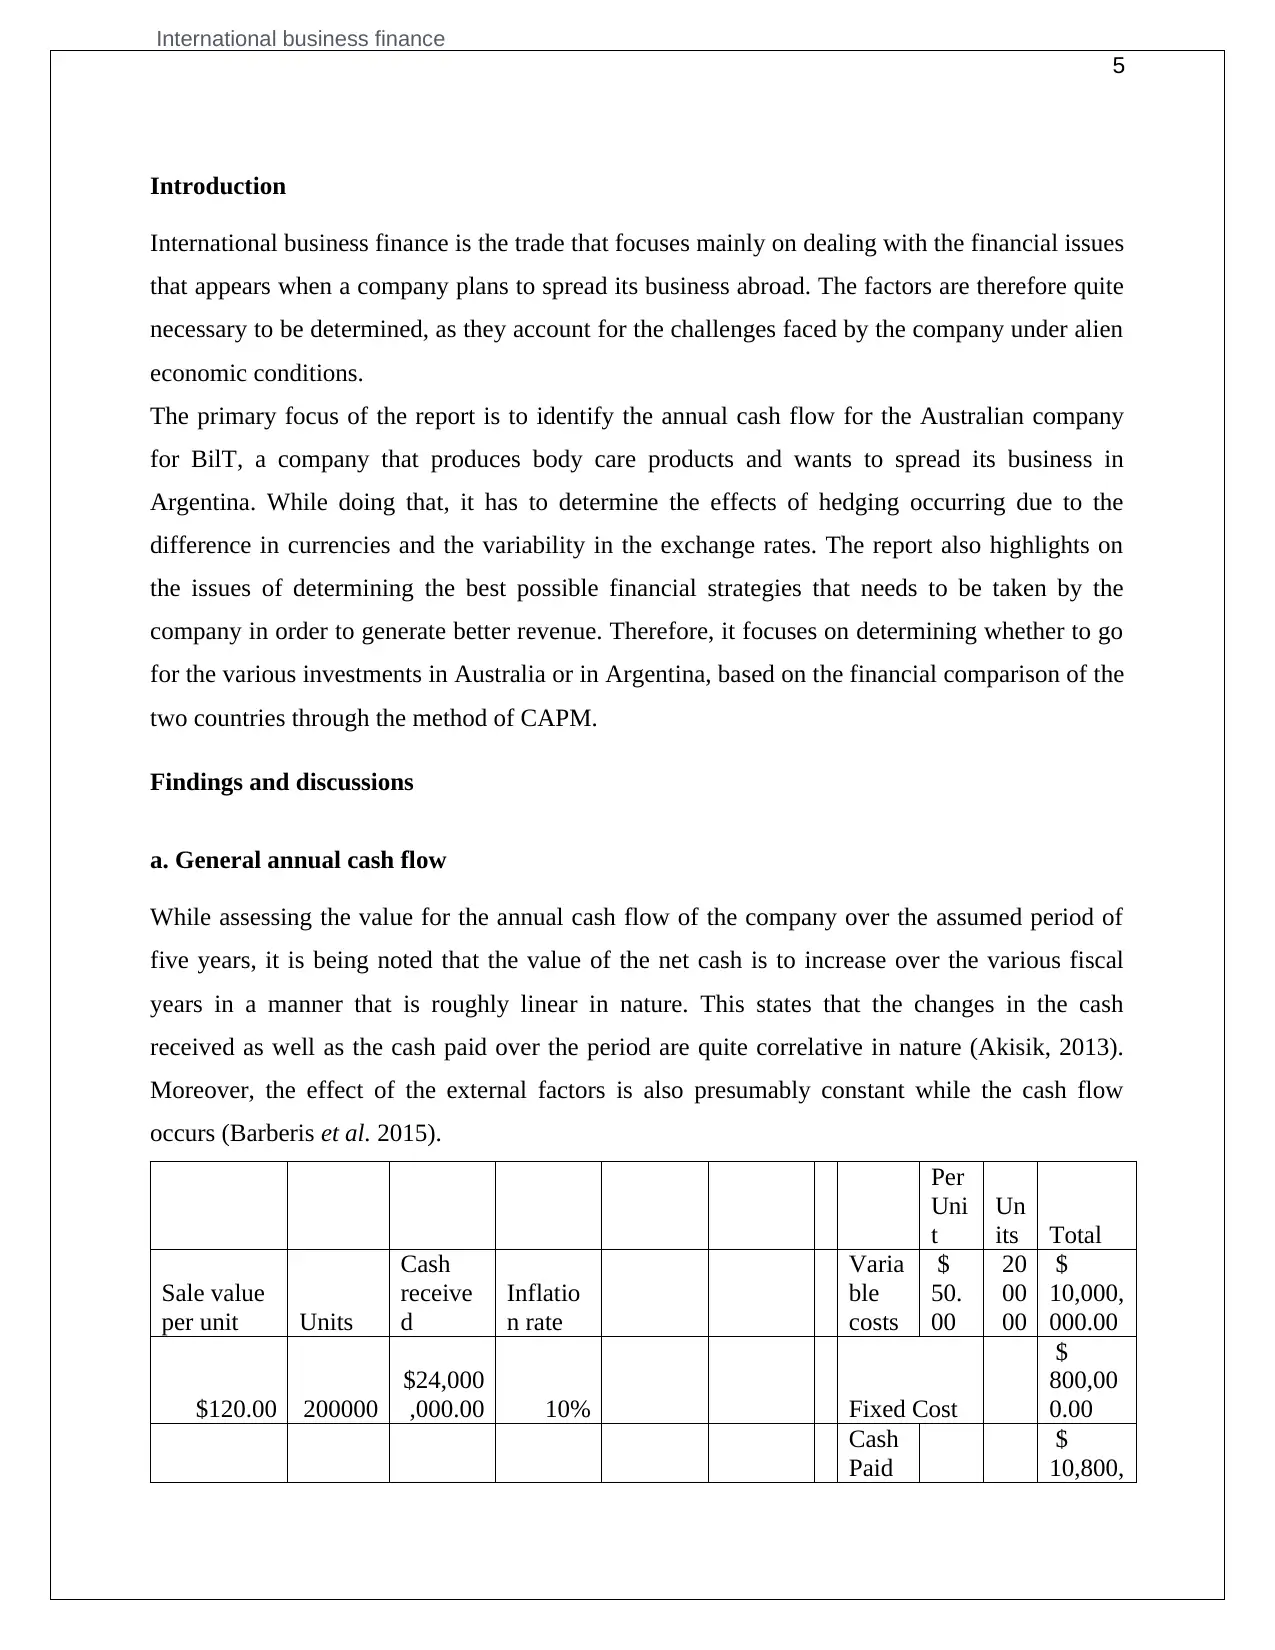
a. General annual cash flow
While assessing the value for the annual cash flow of the company over the assumed period of
five years, it is being noted that the value of the net cash is to increase over the various fiscal
years in a manner that is roughly linear in nature. This states that the changes in the cash
received as well as the cash paid over the period are quite correlative in nature (Akisik, 2013).
Moreover, the effect of the external factors is also presumably constant while the cash flow
occurs (Barberis et al. 2015).
Per
Uni
t
Un
its Total
Sale value
per unit Units
Cash
receive
d
Inflatio
n rate
Varia
ble
costs
$
50.
00
20
00
00
$
10,000,
000.00
$120.00 200000
$24,000
,000.00 10% Fixed Cost
$
800,00
0.00
Cash
Paid
$
10,800,
5
Introduction
International business finance is the trade that focuses mainly on dealing with the financial issues
that appears when a company plans to spread its business abroad. The factors are therefore quite
necessary to be determined, as they account for the challenges faced by the company under alien
economic conditions.
The primary focus of the report is to identify the annual cash flow for the Australian company
for BilT, a company that produces body care products and wants to spread its business in
Argentina. While doing that, it has to determine the effects of hedging occurring due to the
difference in currencies and the variability in the exchange rates. The report also highlights on
the issues of determining the best possible financial strategies that needs to be taken by the
company in order to generate better revenue. Therefore, it focuses on determining whether to go
for the various investments in Australia or in Argentina, based on the financial comparison of the
two countries through the method of CAPM.
Findings and discussions
a. General annual cash flow
While assessing the value for the annual cash flow of the company over the assumed period of
five years, it is being noted that the value of the net cash is to increase over the various fiscal
years in a manner that is roughly linear in nature. This states that the changes in the cash
received as well as the cash paid over the period are quite correlative in nature (Akisik, 2013).
Moreover, the effect of the external factors is also presumably constant while the cash flow
occurs (Barberis et al. 2015).
Per
Uni
t
Un
its Total
Sale value
per unit Units
Cash
receive
d
Inflatio
n rate
Varia
ble
costs
$
50.
00
20
00
00
$
10,000,
000.00
$120.00 200000
$24,000
,000.00 10% Fixed Cost
$
800,00
0.00
Cash
Paid
$
10,800,
International business finance
6
000.00
Rate of
return 10%
Years --> 0 1 2 3 4
Cash
received
$
24,000,
000.00
$
26,400,
000.00
$
29,040,
000.00
$
31,944,
000.00
$
35,138,
400.00
Cash paid
$10,80
0,000.0
0
$11,880
,000.00
$13,068
,000.00
$14,374
,800.00
$15,812
,280.00
Net Cash
flow
$
13,200,
000.00
$
14,520,
000.00
$
15,972,
000.00
$
17,569,
200.00
$
19,326,
120.00
0 1 2 3 4
Demand 200000 200000 200000 200000
Price per unit
$
120.00
$
120.00
$
120.00
$
120.00
Total revenue
$
24,000,
000.00
$
24,000,
000.00
$
24,000,
000.00
$
24,000,
000.00
Variable cost per unit
$
50.00
$
55.00
$
60.50
$
66.55
Total variable cost
$
10,000,
000.00
$
11,000,
000.00
$
12,100,
000.00
$
13,310,
000.00
Annual lease expense
$
-
$
-
$
-
$
-
Other fixed annual
expenses
$
800,000
.00 880000
106480
0
141724
8.8
Non cash expenses
$
-
$
-
$
-
$
-
Total expenses
$
10,800,
000.00
$
11,880,
000.00
$
13,164,
800.00
$
14,727,
248.80
Before taxearnings
subsidiary
$
13,200,
000.00
$
12,120,
000.00
$
10,835,
200.00
$
9,272,7
51.20
Host government tax
$
4,620,0
00.00
$
4,242,0
00.00
$
3,792,3
20.00
$
3,245,4
62.92
After tax earning
subsidiary
$
8,580,0
$
7,878,0
$
7,042,8
$
6,027,2
⊘ This is a preview!⊘
Do you want full access?
Subscribe today to unlock all pages.
Trusted by 1+ million students worldwide
International business finance
7
00.00 00.00 80.00 88.28
Net cash flow
$
8,580,0
00.00
$
7,878,0
00.00
$
7,042,8
80.00
$
6,027,2
88.28
Amount remitted by
subsidiary
$
8,580,0
00.00
$
7,878,0
00.00
$
7,042,8
80.00
$
6,027,2
88.28
Withholding tax on
remitted funds
$
-
$
-
$
-
$
-
Amount remitted
after withholding
taxes
$
8,580,0
00.00
$
7,878,0
00.00
$
7,042,8
80.00
$
6,027,2
88.28
Salvage value
$
-
$
-
$
-
$
22,000,
000.00
Exchange rate 10% 10% 10% 10%
Cash flows to parent
$
858,000
.00
$
787,800
.00
$
704,288
.00
$
602,728
.83
PV of parent cash
flow
$
943,800
.00
$
953,238
.00
$
937,407
.33
$
882,455
.28
Initial
investment
by parent
$
40,000,
000.00
Cumulative NPV
$
(39,056,
200.00)
$
(38,102,
962.00)
$
(37,165,
554.67)
$
(36,283,
099.39)
Table 1: Annual cash flow for BilT
(Source: Influenced by Learner)
Paraphrase This Document
Need a fresh take? Get an instant paraphrase of this document with our AI Paraphraser
International business finance
8
1 2 3 4
$(39,500,000.00)
$(39,000,000.00)
$(38,500,000.00)
$(38,000,000.00)
$(37,500,000.00)
$(37,000,000.00)
$(36,500,000.00)
$(36,000,000.00)
$(35,500,000.00)
$(35,000,000.00)
$(34,500,000.00)
Series1
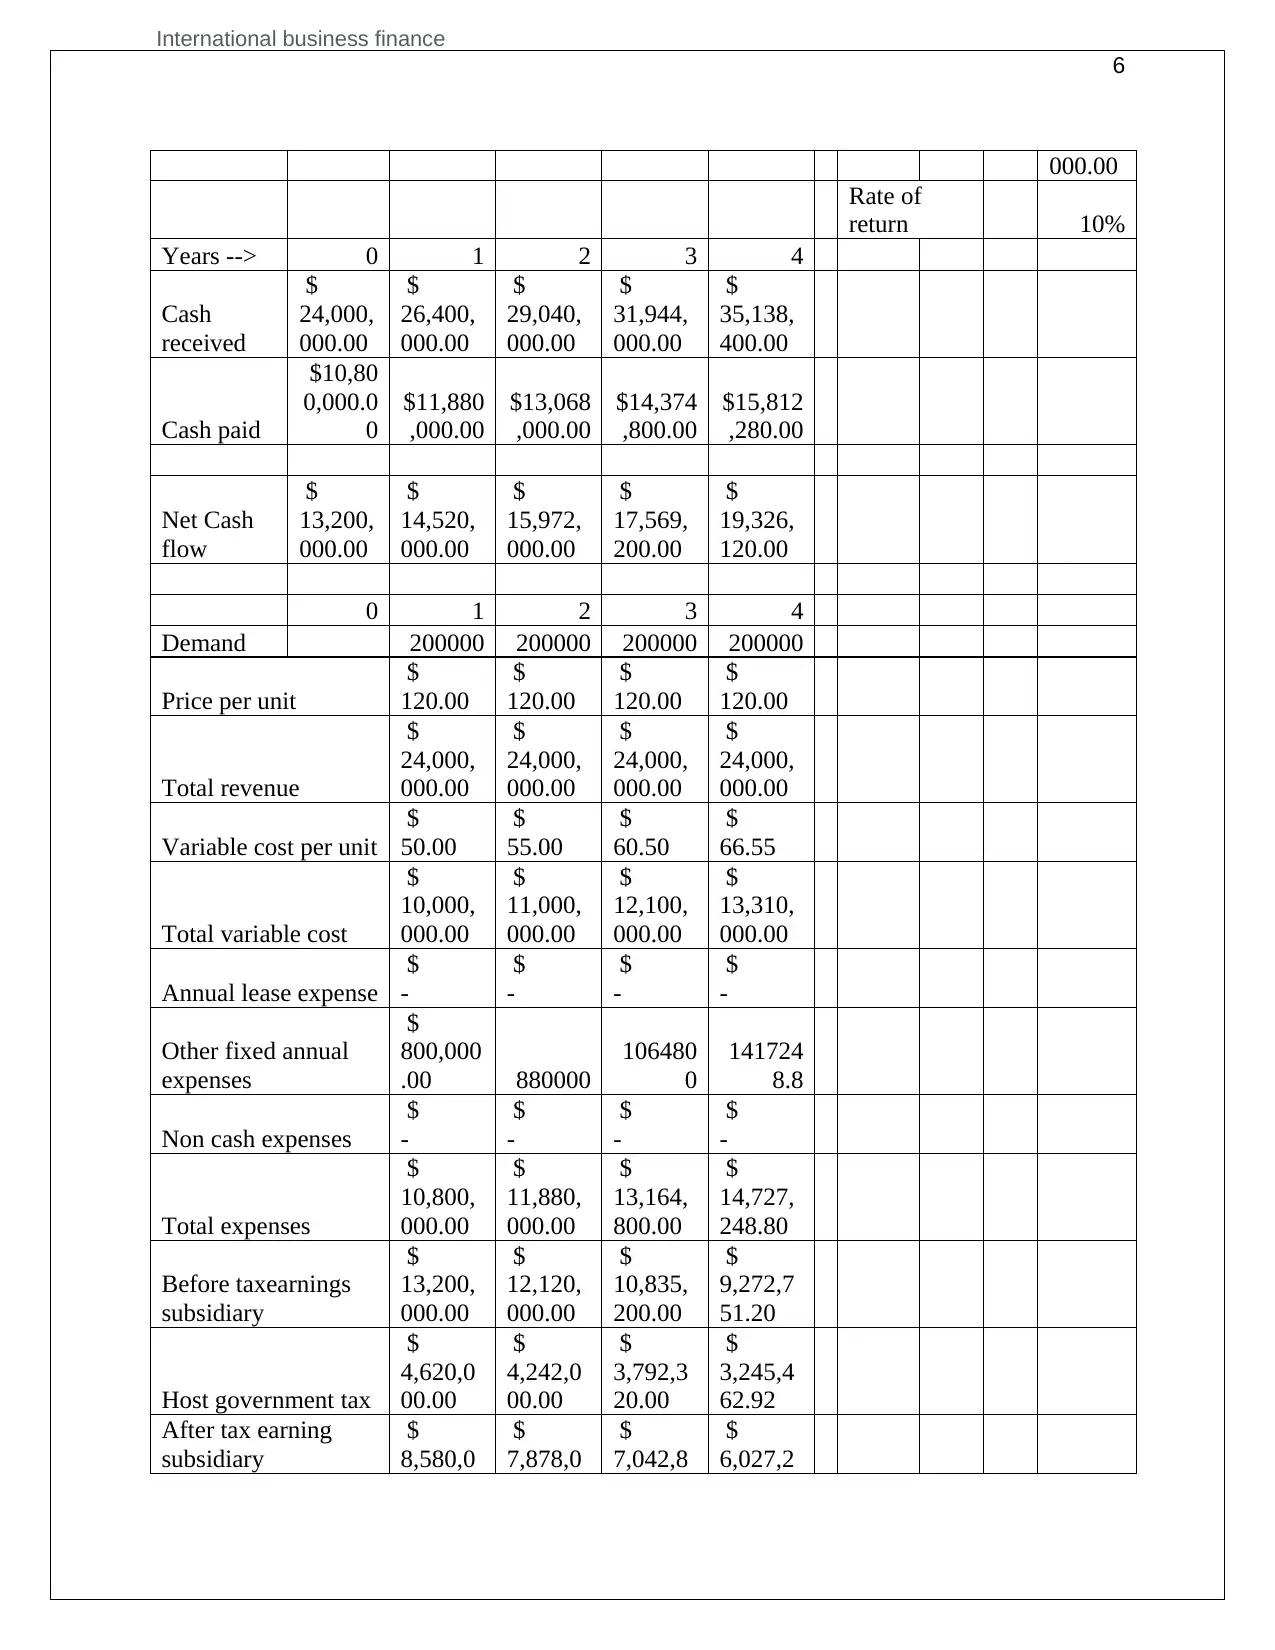
Figure 1: Cumulative cash flow for BilT
(Source: Influenced by Learner)
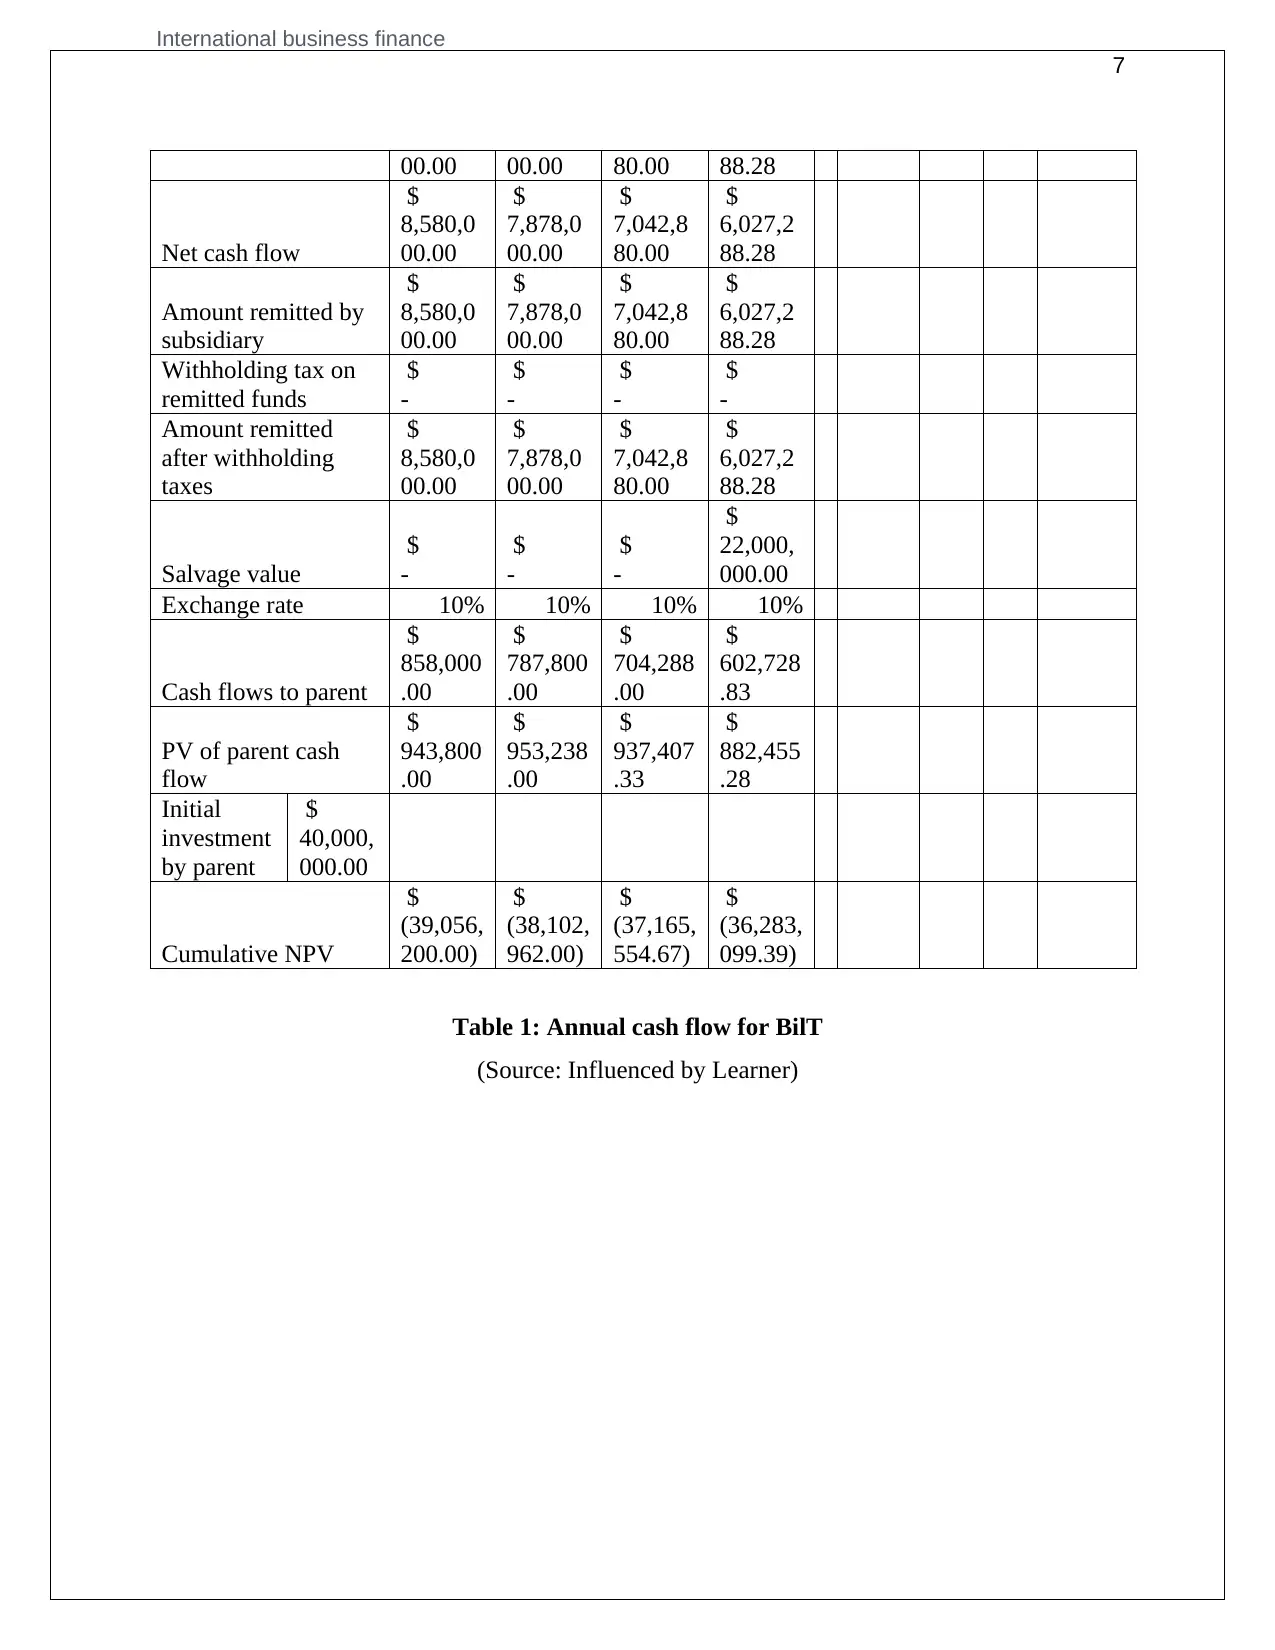
b. Hedging and cash flow
Hedging is considered a process to reduce the risk associated to the variability in price (Barillas
& Shanken, 2015). While a company enters a new market with a different currency structure,
there is always a risk associated to the commencement of the business as many of the rates and
scales are different, due to a different economic structure (Barth, 2015). As per Berk & Van
Binsbergen (2016), hedging is regarded as the only tool to manage and mitigate such risks.
0 1 2 3 4
Hedge rates 10.00% 10.00% 8.00% 8.00% 7.00%
Cash
$
(40,000,000.00
)
$
10,000,000.0
0
$
10,000,000.0
0
$
10,000,000.0
0
$
10,000,000.0
0
Hedge factor 1 1.1 1.1664 1.259712 1.31079601
Hedged cash
flow
$
(40,000,000.00
)
$
9,090,909.09
$
8,573,388.20
$
7,938,322.41
$
7,628,952.12
Net Present
value
$
(6,768,428.18)
Table 2: Effect of Hedge
8
1 2 3 4
$(39,500,000.00)
$(39,000,000.00)
$(38,500,000.00)
$(38,000,000.00)
$(37,500,000.00)
$(37,000,000.00)
$(36,500,000.00)
$(36,000,000.00)
$(35,500,000.00)
$(35,000,000.00)
$(34,500,000.00)
Series1
Figure 1: Cumulative cash flow for BilT
(Source: Influenced by Learner)
b. Hedging and cash flow
Hedging is considered a process to reduce the risk associated to the variability in price (Barillas
& Shanken, 2015). While a company enters a new market with a different currency structure,
there is always a risk associated to the commencement of the business as many of the rates and
scales are different, due to a different economic structure (Barth, 2015). As per Berk & Van
Binsbergen (2016), hedging is regarded as the only tool to manage and mitigate such risks.
0 1 2 3 4
Hedge rates 10.00% 10.00% 8.00% 8.00% 7.00%
Cash
$
(40,000,000.00
)
$
10,000,000.0
0
$
10,000,000.0
0
$
10,000,000.0
0
$
10,000,000.0
0
Hedge factor 1 1.1 1.1664 1.259712 1.31079601
Hedged cash
flow
$
(40,000,000.00
)
$
9,090,909.09
$
8,573,388.20
$
7,938,322.41
$
7,628,952.12
Net Present
value
$
(6,768,428.18)
Table 2: Effect of Hedge
International business finance
9
(Source: Influenced by Learner)
0 1 2 3 4
Amount remitted after
withholding taxes
$
8,580,000.00
$
7,878,000.00
$
7,042,880.00
$
6,027,288.28
Hedged cash flows after
withholding taxes
$
10,000,000.0
0
$
10,000,000.0
0
$
10,000,000.0
0
$
10,000,000.0
0
Unhedged cash flows
$
(1,420,000.0
0)
$
(2,122,000.0
0)
$
(2,957,120.0
0)
$
(3,972,711.7
2)
Salvage Value
$
-
$
-
$
-
$
22,000,000.0
0
Forward rate 10% 10% 8% 8% 7%
Expected future
spot rate 10% 10% 10% 10% 10%
Hedged cash flow to parent
$
1,000,000.00
$
800,000.00
$
800,000.00
$
700,000.00
Unhedged cash flows to parent
$
(142,000.00)
$
(212,200.00)
$
(295,712.00)
$
(397,271.17)
Total cash flows to parent
$
858,000.00
$
587,800.00
$
504,288.00
$
302,728.83
PV of parent cash flow
$
780,000.00
$
485,785.12
$
378,879.04
$
206,767.86
Initial investment
by parent
$
40,000,000.
00
Cumulative NPV
$
(39,220,000.
00)
$
(38,734,214.
88)
$
(38,355,335.
84)
$
(38,148,567.
97)
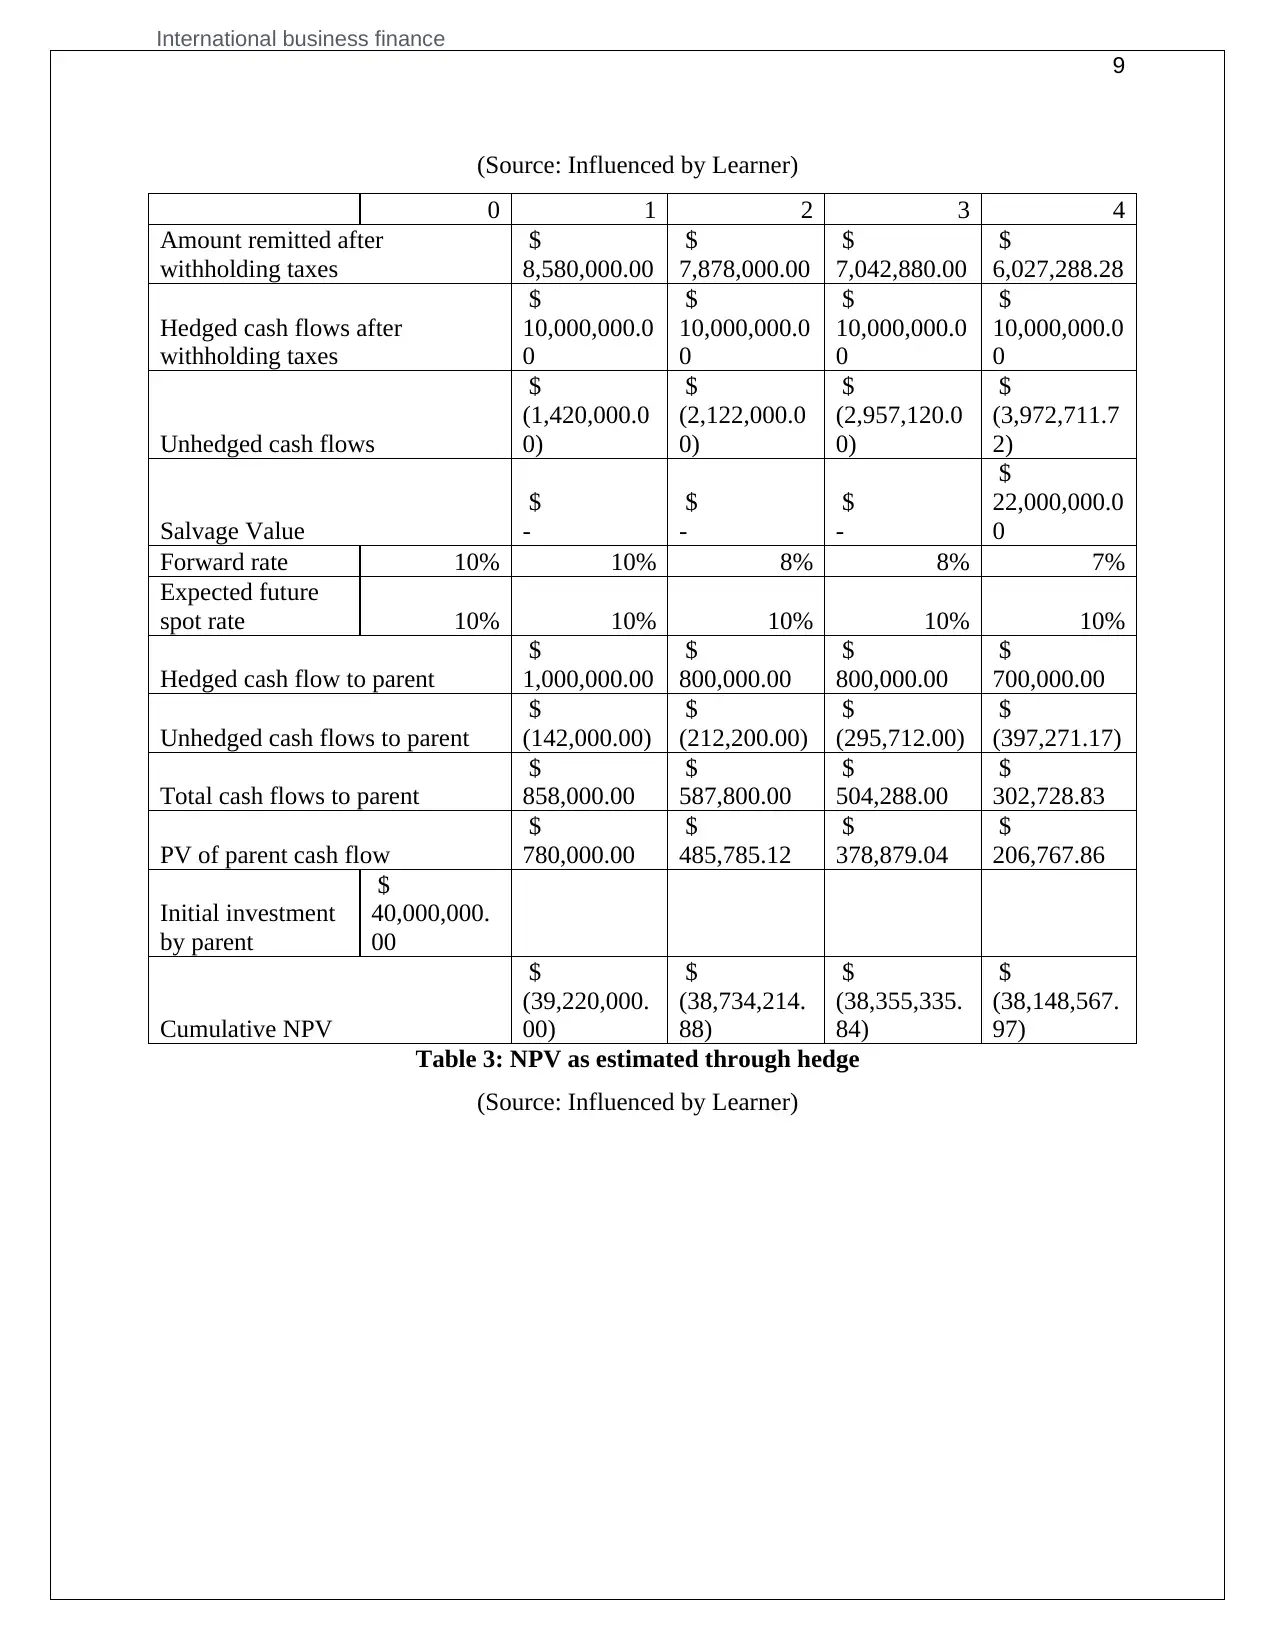
Table 3: NPV as estimated through hedge
(Source: Influenced by Learner)
9
(Source: Influenced by Learner)
0 1 2 3 4
Amount remitted after
withholding taxes
$
8,580,000.00
$
7,878,000.00
$
7,042,880.00
$
6,027,288.28
Hedged cash flows after
withholding taxes
$
10,000,000.0
0
$
10,000,000.0
0
$
10,000,000.0
0
$
10,000,000.0
0
Unhedged cash flows
$
(1,420,000.0
0)
$
(2,122,000.0
0)
$
(2,957,120.0
0)
$
(3,972,711.7
2)
Salvage Value
$
-
$
-
$
-
$
22,000,000.0
0
Forward rate 10% 10% 8% 8% 7%
Expected future
spot rate 10% 10% 10% 10% 10%
Hedged cash flow to parent
$
1,000,000.00
$
800,000.00
$
800,000.00
$
700,000.00
Unhedged cash flows to parent
$
(142,000.00)
$
(212,200.00)
$
(295,712.00)
$
(397,271.17)
Total cash flows to parent
$
858,000.00
$
587,800.00
$
504,288.00
$
302,728.83
PV of parent cash flow
$
780,000.00
$
485,785.12
$
378,879.04
$
206,767.86
Initial investment
by parent
$
40,000,000.
00
Cumulative NPV
$
(39,220,000.
00)
$
(38,734,214.
88)
$
(38,355,335.
84)
$
(38,148,567.
97)
Table 3: NPV as estimated through hedge
(Source: Influenced by Learner)
⊘ This is a preview!⊘
Do you want full access?
Subscribe today to unlock all pages.
Trusted by 1+ million students worldwide
International business finance
10
1 2 3 4
$(39,400,000.00)
$(39,200,000.00)
$(39,000,000.00)
$(38,800,000.00)
$(38,600,000.00)
$(38,400,000.00)
$(38,200,000.00)
$(38,000,000.00)
$(37,800,000.00)
$(37,600,000.00)
Series1
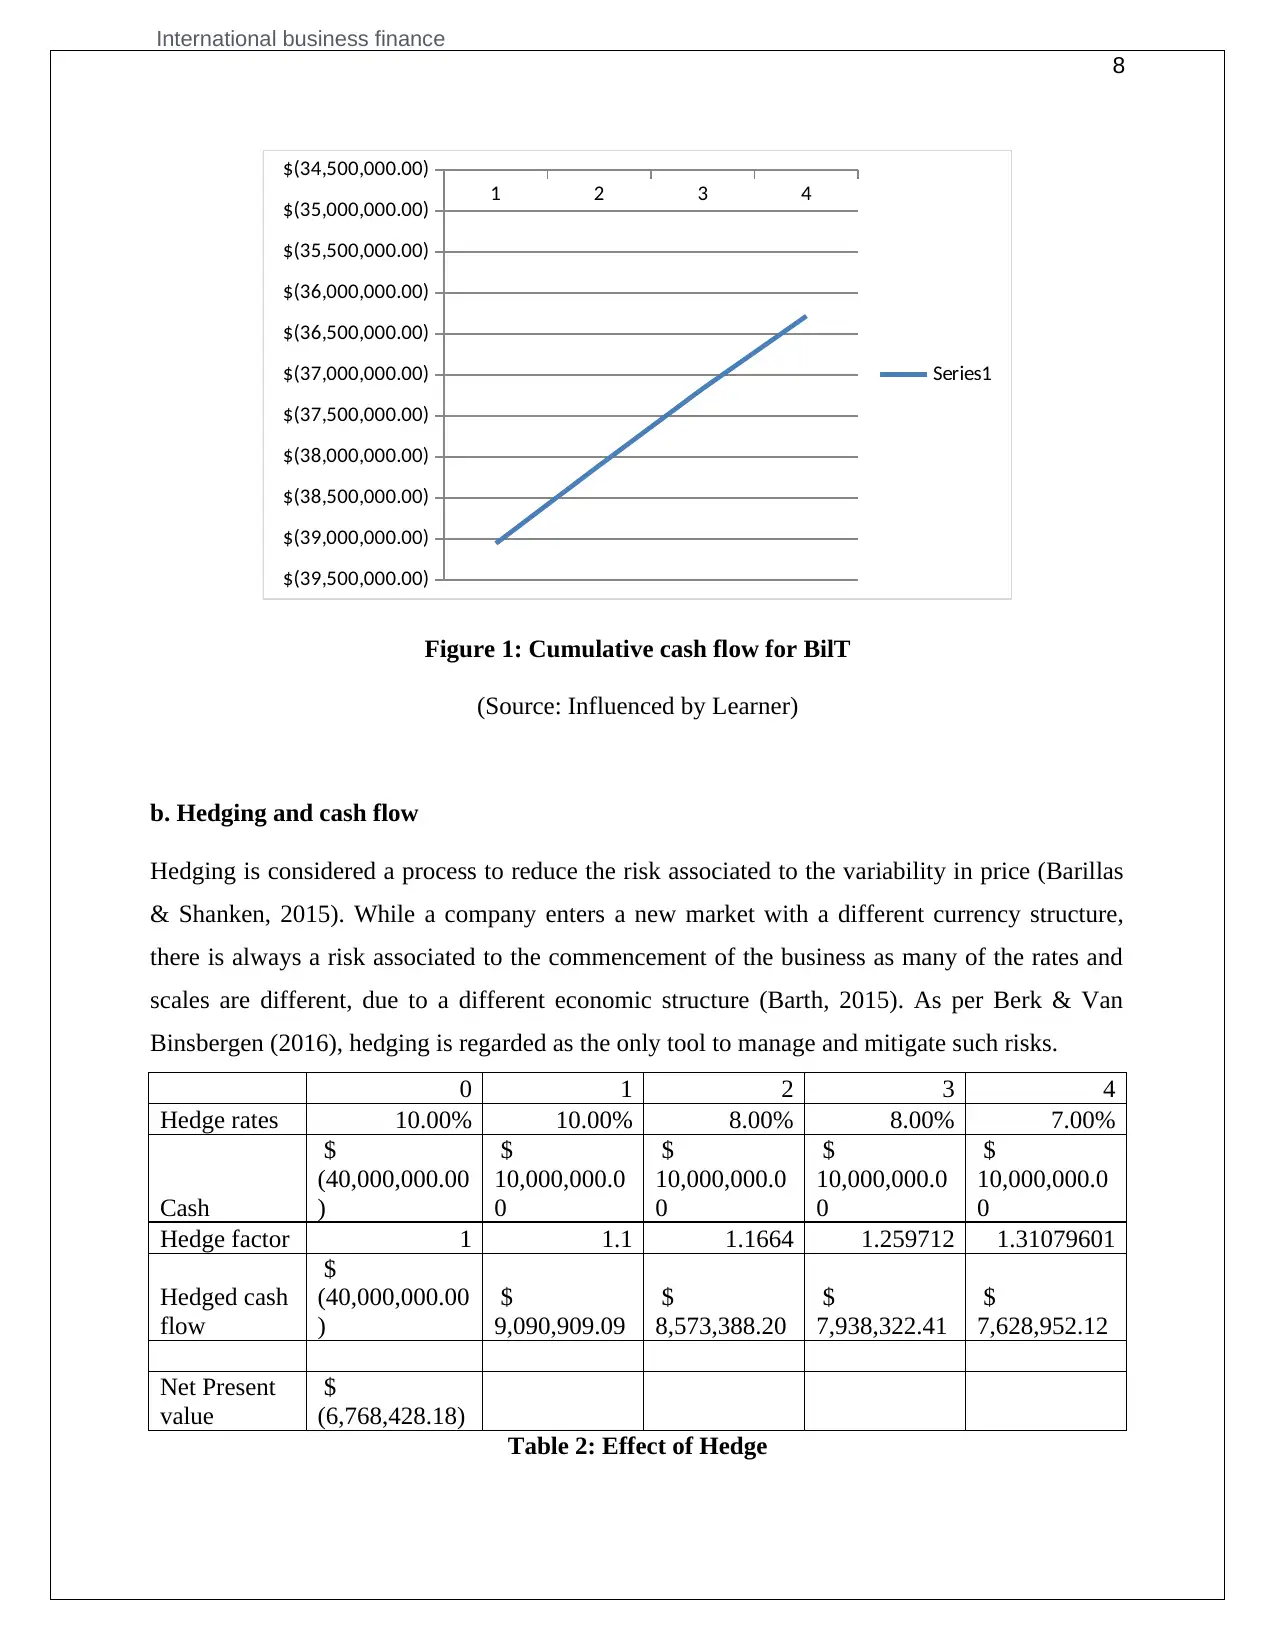
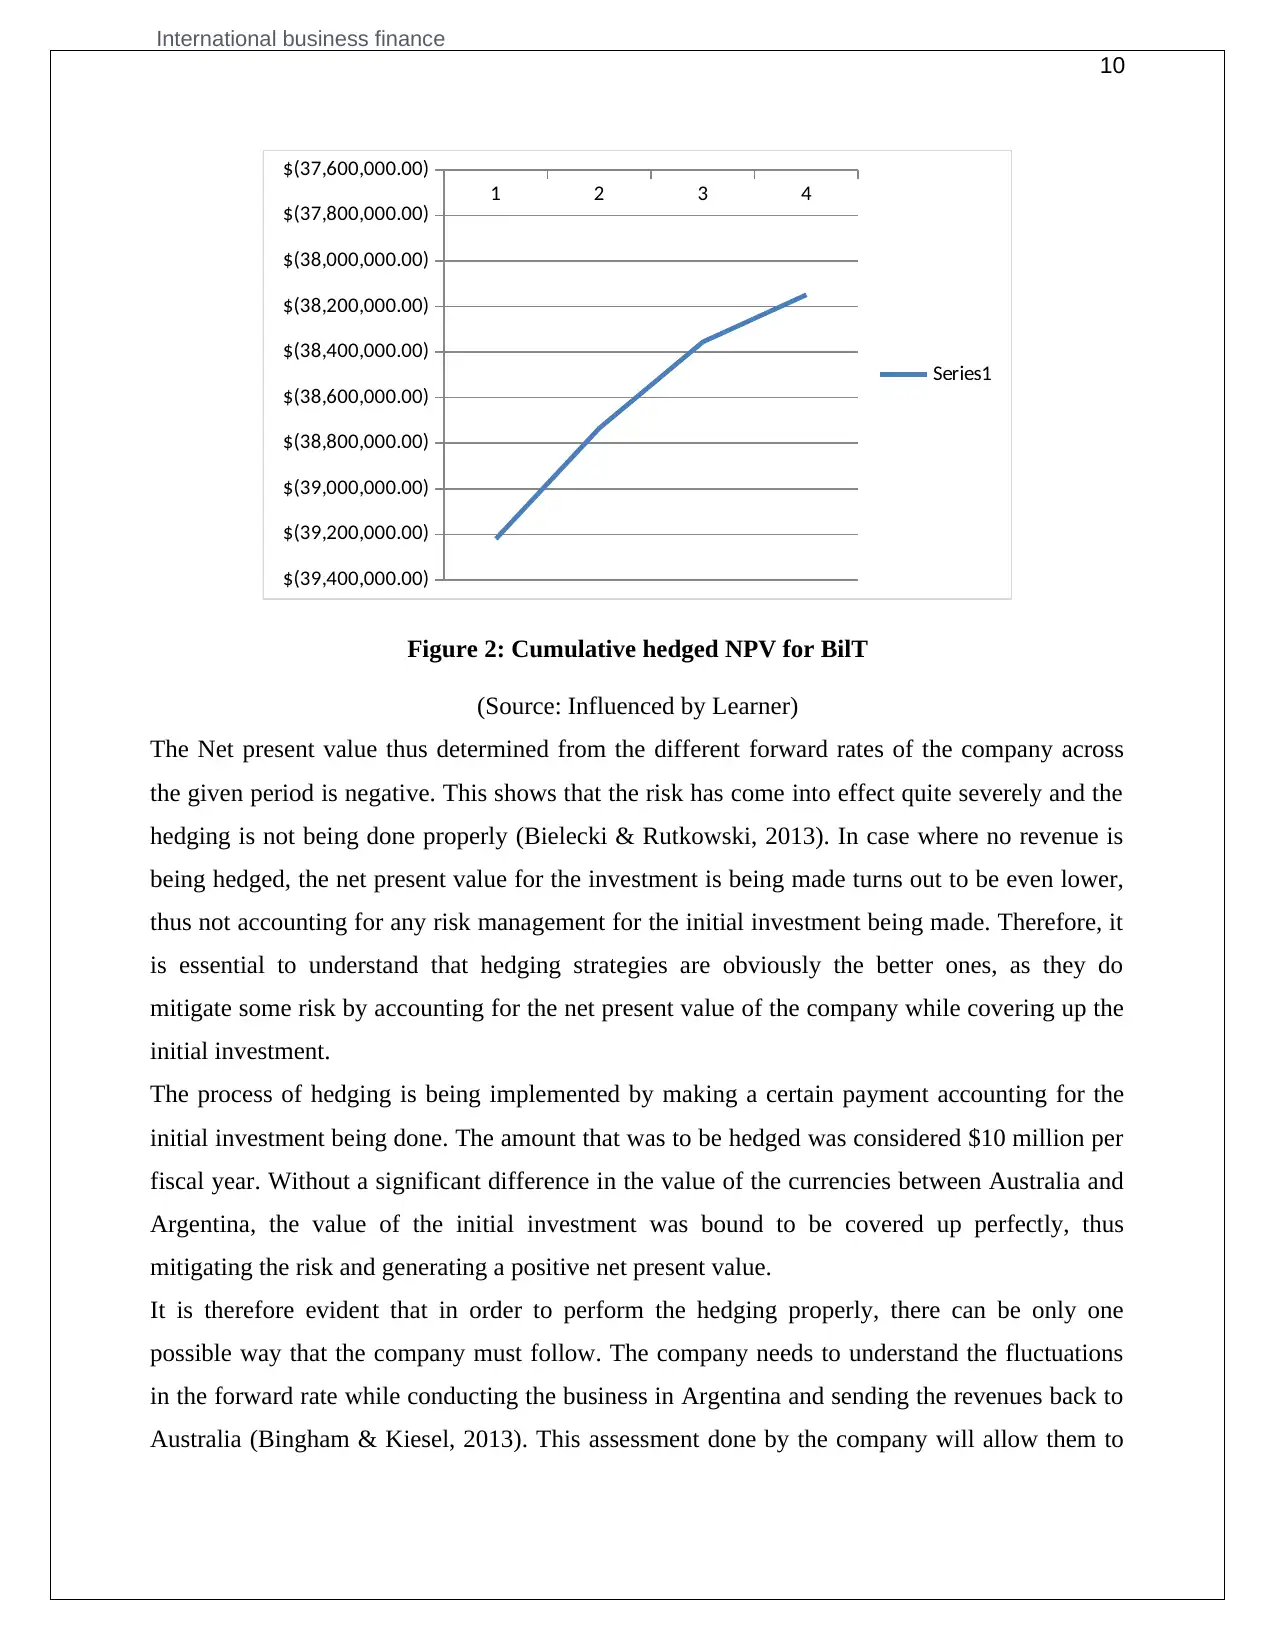
Figure 2: Cumulative hedged NPV for BilT
(Source: Influenced by Learner)
The Net present value thus determined from the different forward rates of the company across
the given period is negative. This shows that the risk has come into effect quite severely and the
hedging is not being done properly (Bielecki & Rutkowski, 2013). In case where no revenue is
being hedged, the net present value for the investment is being made turns out to be even lower,
thus not accounting for any risk management for the initial investment being made. Therefore, it
is essential to understand that hedging strategies are obviously the better ones, as they do
mitigate some risk by accounting for the net present value of the company while covering up the
initial investment.
The process of hedging is being implemented by making a certain payment accounting for the
initial investment being done. The amount that was to be hedged was considered $10 million per
fiscal year. Without a significant difference in the value of the currencies between Australia and
Argentina, the value of the initial investment was bound to be covered up perfectly, thus
mitigating the risk and generating a positive net present value.
It is therefore evident that in order to perform the hedging properly, there can be only one
possible way that the company must follow. The company needs to understand the fluctuations
in the forward rate while conducting the business in Argentina and sending the revenues back to
Australia (Bingham & Kiesel, 2013). This assessment done by the company will allow them to
10
1 2 3 4
$(39,400,000.00)
$(39,200,000.00)
$(39,000,000.00)
$(38,800,000.00)
$(38,600,000.00)
$(38,400,000.00)
$(38,200,000.00)
$(38,000,000.00)
$(37,800,000.00)
$(37,600,000.00)
Series1
Figure 2: Cumulative hedged NPV for BilT
(Source: Influenced by Learner)
The Net present value thus determined from the different forward rates of the company across
the given period is negative. This shows that the risk has come into effect quite severely and the
hedging is not being done properly (Bielecki & Rutkowski, 2013). In case where no revenue is
being hedged, the net present value for the investment is being made turns out to be even lower,
thus not accounting for any risk management for the initial investment being made. Therefore, it
is essential to understand that hedging strategies are obviously the better ones, as they do
mitigate some risk by accounting for the net present value of the company while covering up the
initial investment.
The process of hedging is being implemented by making a certain payment accounting for the
initial investment being done. The amount that was to be hedged was considered $10 million per
fiscal year. Without a significant difference in the value of the currencies between Australia and
Argentina, the value of the initial investment was bound to be covered up perfectly, thus
mitigating the risk and generating a positive net present value.
It is therefore evident that in order to perform the hedging properly, there can be only one
possible way that the company must follow. The company needs to understand the fluctuations
in the forward rate while conducting the business in Argentina and sending the revenues back to
Australia (Bingham & Kiesel, 2013). This assessment done by the company will allow them to
Paraphrase This Document
Need a fresh take? Get an instant paraphrase of this document with our AI Paraphraser
International business finance
11
reshape the hedge amount according to the forward rate, which will in turn help to generate a
positive net present value against the initial investment that has been made (Bodie, 2013).
c. Difference in borrow
While assessing the investment strategy for BilT, it is evident that 60% value for the initial
investment is to be considered as the initial investment for the company under the revised
circumstances. The company has already planned to cover 40% of the initial investment value
through their existing funds. Due to the revised initial investment value being recovered through
the issuance of debts, there has to be a certain involvement for borrow. The borrow rate for the
two different countries, Argentina and Australia are being mentioned to be 6% and 12%
respectively. This difference in the rate of borrow has caused the amount paid as interest to be
different. The rate of return for the investment has developed the cash flow for the company
accordingly, for the period of five fiscal years and the corresponding net present values are
determined accordingly, by adding up all the discounted cash flow amounts.
Argentina @ 6%
0 1 2 3 4
Investment
$
(24,000,000.00
)
$
1,440,000.0
0
$
2,966,400.0
0
$
4,584,384.00
$
6,299,447.04
Rate of Return 10% 10% 10% 10% 10%
Discounted
cash flow
$
(24,000,000.00
)
$
1,584,000.0
0
$
3,589,344.0
0
$
6,101,815.10
$
9,223,020.41
NPV
$
(3,501,820.48)
Australia @ 12%
0 1 2 3 4
Investment
$
(24,000,000.00
)
$
2,880,000.0
0
$
6,105,600.0
0
$
9,718,272.00
$
13,764,464.6
4
Rate of Return 10% 10% 10% 10% 10%
Discounted
cash flow
$
(24,000,000.00
)
$
3,168,000.0
0
$
7,387,776.0
0
$
12,935,020.0
3
$
20,152,552.6
8
International business finance
12
NPV
$
19,643,348.71
Table 4: Calculation of borrow amount
(Source: Influenced by Learner)
While assessing the net present value for both the countries under different rates of borrow, it is
evident that the Argentine economy offers a negative value of NPV against the initial
investment, whereas the Australian economy offers the chance for a positive NPV against the
initial amount that is being debited. The positive value of the NPV therefore concludes the loan
to be taken from the Australia, by issuing the debt in any bank of Australia over the likeness of
Argentina.
d. Cost of Equity
While analyzing the cost of equity for BilT, the method of Capital Asset Pricing Model is being
implemented in order to determine the risk associated with making the investment in Australia or
in Argentina. The Capital Asset Pricing Model determines the overall value of the payback being
affected by the associated risk (Camfferman & Zeff, 2015). This accounts for the assessment of
the weighted average of the amount of debt as well as the amount of equity, and finally adding
them up (Chegut, Eichholtz & Kok, 2014).
The weighted average is being estimated by multiplying the systematic risk probability to the
cost of the debt or the equity (Chui, Fender & Sushko, 2014). This helps in determining the
return from a hybrid fund that consists mainly of both the debt as well as equity instruments in a
specific proportion (Devlin, 2014).
The cost of equity however, determines the return that the company has decided to generate in
order to provide to the shareholders (Dong, Kouvelis & Su, 2014). Moreover, it also accounts for
the compensation that the market demands in exchange for owing the assets as well as bearing
the systematic risk of owning the company (Du & Schreger, 2016). The capital asset pricing
model determines the cost of equity for a firm to be the sum of the risk free rate of return and the
product of volatility and risk premium for the particular stock with respect to the market
(Fernandez, 2015).
⊘ This is a preview!⊘
Do you want full access?
Subscribe today to unlock all pages.
Trusted by 1+ million students worldwide
1 out of 22
Related Documents


Your All-in-One AI-Powered Toolkit for Academic Success.
+13062052269
info@desklib.com
Available 24*7 on WhatsApp / Email
![[object Object]](/_next/static/media/star-bottom.7253800d.svg)
Unlock your academic potential
Copyright © 2020–2026 A2Z Services. All Rights Reserved. Developed and managed by ZUCOL.