International Finance: Currency Market Analysis and Trading Strategies
VerifiedAdded on 2023/06/04
|19
|3971
|181
Report
AI Summary
This report provides a detailed analysis of the international currency market, covering the period from January 2nd, 2018, to August 31st, 2018. It examines the movements of various currencies, including the Australian dollar (AUD), US dollar (USD), Euro (EUR), and British pound (GBP), in response to market dynamics and major events such as trade wars between China and the US, political turmoil in Spain and Italy, and Brexit. The report explores the exchange rate fluctuations between the AUD and other currencies, providing tables and figures illustrating these trends. Additionally, it analyzes possible reasons for the exchange rate movements, considering factors like political instability and interest rate changes. The report also assesses trading strategies, such as scalping and daily pivots, used to navigate the volatile currency market. The report concludes by highlighting the impact of these strategies on the market's overall performance.
Running head: INTERNATIONAL FINANCE 1
International Finance
Name:
Institution
International Finance
Name:
Institution
Paraphrase This Document
Need a fresh take? Get an instant paraphrase of this document with our AI Paraphraser
INTERNATIONAL FINANCE 2
International Finance
Executive Summary
The report has provided a detailed overview of the current currency market coupled with
associated projections and market performances. In particular, the report has affirmed that
different currency markets reacted differently to market dynamics from 2nd January 2018 to
August 31st, 2018. For example, the strength of the Australian dollar has faced some minor
challenges as a result of the protracted trade wars between China and the US. The report has
further described International currency market movements coupled with major events and
announcements that have affected the operations in the markets. For instance, the report has
established that the increased trade wars between China and the US have had some impacts on
the currency markets in various parts of the world. Additionally, the report has established
possible reasons for the exchange rate movements by comparing the US dollar, Euro and British
pound with the AUD. Some of these reasons include the recent political turmoil in Spain and
Italy and the politics surround Brexit. Lastly, the report has identified various trading strategies
such as scalping and daily pivots to be comparatively effective in the currency trading markets.
Currency Market Overview and Forecast
International currency market movement
, deriving an accurate prediction of the currency market movements and activities can be
extremely difficult given the numerous fluctuations and varied externalities (Salisu, Oyewole, &
Fasanya, 2018). Notably, there has been a drastic change in the currency market movements and
activities from January 2nd, 2018 to August 31st, 2018. For instance, the Euro has recorded drastic
improvements breaking above the Hawkish Draghi with a break of approximately 1.18. Such
INTERNATIONAL FINANCE 3
positive development from the Euro has seen the currency grow above its major competitors
providing the region with a strong growth potential. Also, after experiencing a serious decline in
2016 and 2017, the GBP has recorded a modest reprieve from January 2nd, 2018 to August 31st,
2018 becoming one of the best performers among the G10 nations.
Moreover, the Australian Dollar which is mostly viewed as a proxy for China has faced a
serious decline. Most financial analysts attribute such decline to the billions of tariffs that are
currently being implemented by the Trump administration. Specifically, the trade war between
China and the U.S has seriously weighted on the Aussie further affecting the country’s economic
prospects. Another significant international currency market movement was recorded from the
Brent crude oil futures which hit a fresh 4-year high. The rise can be accredited to OPEC’s
decision to raise oil production only if the demand for this precious commodity was high among
the consumers effectively snubbing president Trump’s demands to have the oil prices lowered.
In other parts of the world, the Norges Banks (Norway) has also seen a hike in interest
rate early this year resulting into significant gain against the US Dollar. Also, the New Zealand
currency (Kiwi) has experienced a negative growth against the US Dollar depreciating by
approximately 12.25% over the stipulated period. The Swiss National Bank has recorded a
strong growth in the economy with a 1% rise against the US Dollar and about 3.5% against the
Euro. In addition, over the stipulated period, gold prices have managed to record an upswing, a
fact attributed to the supportive impact of the US Dollar which has been weaker and this has
resulted in a rise in yields (Du et al, 2017).
The most current announcement in the currency markets is the $200 billion tariffs
imposed by the Trump administration on Chinese goods. Undoubtedly, the high trade tensions
between the US and China has resulted in a drastic drop in investors’ confidence and numerous
⊘ This is a preview!⊘
Do you want full access?
Subscribe today to unlock all pages.
Trusted by 1+ million students worldwide
INTERNATIONAL FINANCE 4
speculative purchases and trade deals. Going forward, preemptive rebalancing of the portfolio
remains to be one of the most important catalysts for changes in prices in the currency markets.
In general, the Euro has remained strong over the period at $1.17, the US dollar has also been
holding above JPY112.00 while the Sterling Pound has set a 5-month best at $1.3215. On the
other hand, the Canadian dollar has greatly benefited from the improving prospects of the U.S
dollar while despite poor performances; the Australian dollar is on the right course of re-
establishment.
Major events/announcements
According to Guofeng (2015), the currency market is a globally interconnected platform
that can be affected by various factors such as exchange rates and currency values. Indeed, there
are numerous major events or announcement that may have caused noticeable movements in
currency markets that are clearly stipulated above. For instance, the Italian and Spanish political
turmoil has had significant impacts on the global currency markets. According to Peltomäki,
Graham & Hasselgren (2018), exchange rates are more likely to react in favor of those political
parties with effective and reasonable fiscal and monetary policies that may prevent a possible
downgrade of a country’s credit ratings.
Following widespread political instability in these two countries, consumer confidence
reduced coupled with poor performances against the Euro and US Dollar among other major
global currencies (Barai, Fullerton & Walke, 2018). Moreover, the announcement by the British
Prime Minister earlier this year to conduct an early election in the UK has greatly affected the
performances of the Australian Dollar.
The exchange rate of AUD with 4 other currencies
Paraphrase This Document
Need a fresh take? Get an instant paraphrase of this document with our AI Paraphraser
INTERNATIONAL FINANCE 5
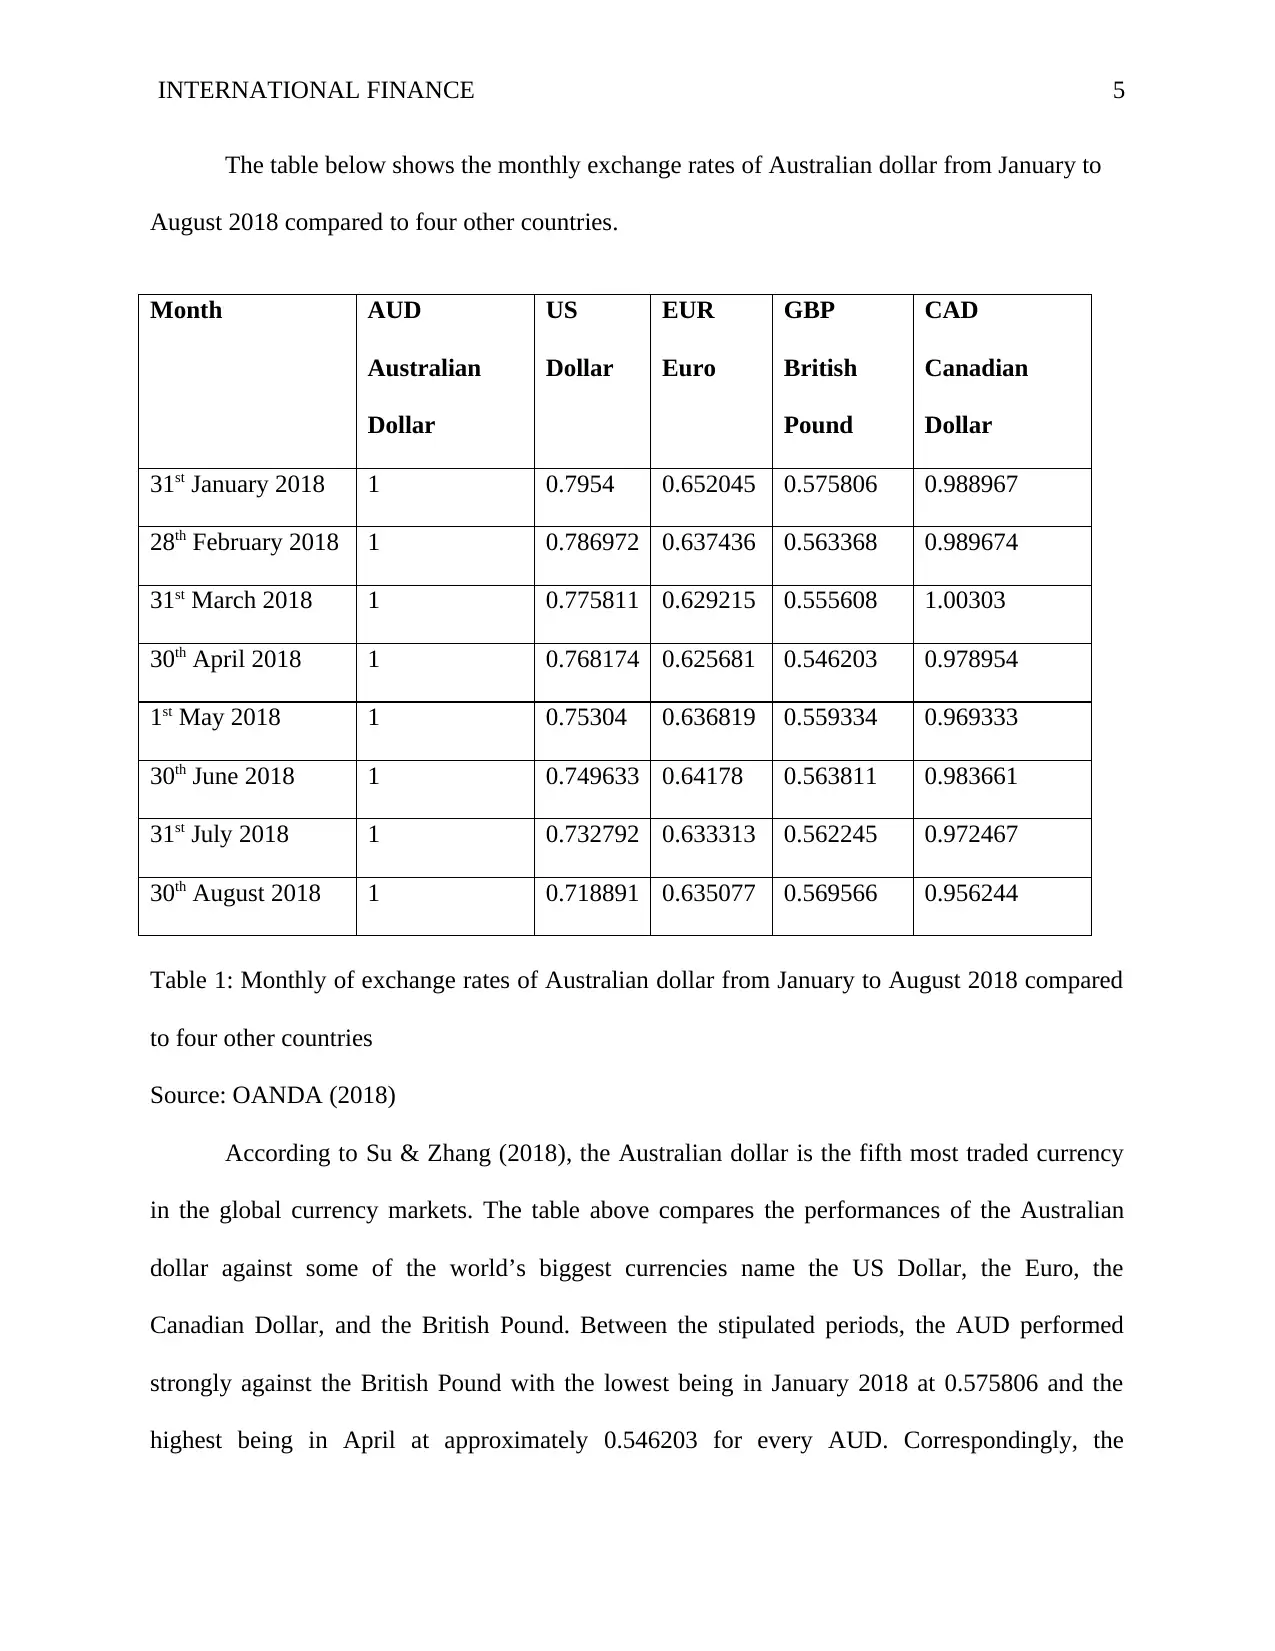
The table below shows the monthly exchange rates of Australian dollar from January to
August 2018 compared to four other countries.
Month AUD
Australian
Dollar
US
Dollar
EUR
Euro
GBP
British
Pound
CAD
Canadian
Dollar
31st January 2018 1 0.7954 0.652045 0.575806 0.988967
28th February 2018 1 0.786972 0.637436 0.563368 0.989674
31st March 2018 1 0.775811 0.629215 0.555608 1.00303
30th April 2018 1 0.768174 0.625681 0.546203 0.978954
1st May 2018 1 0.75304 0.636819 0.559334 0.969333
30th June 2018 1 0.749633 0.64178 0.563811 0.983661
31st July 2018 1 0.732792 0.633313 0.562245 0.972467
30th August 2018 1 0.718891 0.635077 0.569566 0.956244
Table 1: Monthly of exchange rates of Australian dollar from January to August 2018 compared
to four other countries
Source: OANDA (2018)
According to Su & Zhang (2018), the Australian dollar is the fifth most traded currency
in the global currency markets. The table above compares the performances of the Australian
dollar against some of the world’s biggest currencies name the US Dollar, the Euro, the
Canadian Dollar, and the British Pound. Between the stipulated periods, the AUD performed
strongly against the British Pound with the lowest being in January 2018 at 0.575806 and the
highest being in April at approximately 0.546203 for every AUD. Correspondingly, the
INTERNATIONAL FINANCE 6
Australian Dollar comparatively had weaker performances against the Canadian Dollar with the
lowest being in March 2018 at 1.00303 and the highest being in August 2018 at approximately
0.956244 for every AUD. The subsequent figures below show the monthly exchange rates from
January to August 2018.
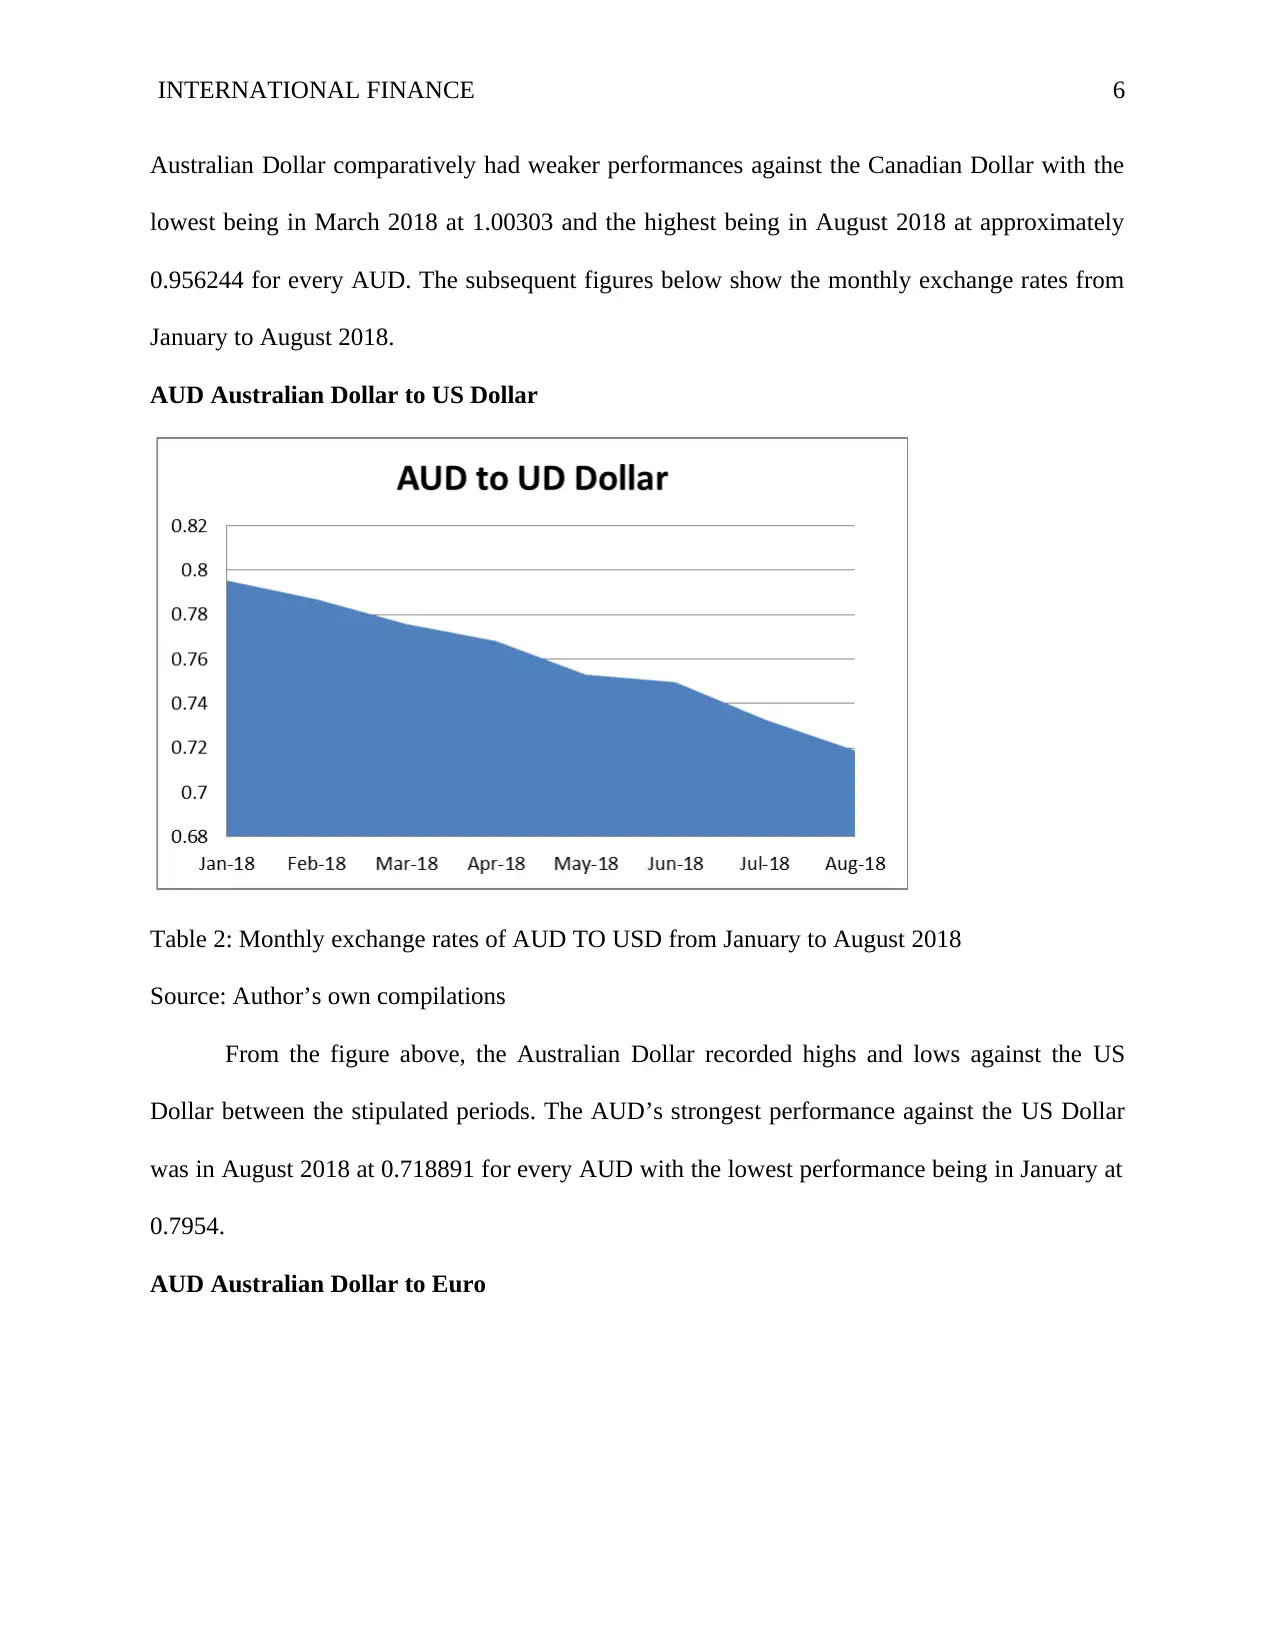
AUD Australian Dollar to US Dollar
Table 2: Monthly exchange rates of AUD TO USD from January to August 2018
Source: Author’s own compilations
From the figure above, the Australian Dollar recorded highs and lows against the US
Dollar between the stipulated periods. The AUD’s strongest performance against the US Dollar
was in August 2018 at 0.718891 for every AUD with the lowest performance being in January at
0.7954.
AUD Australian Dollar to Euro
Australian Dollar comparatively had weaker performances against the Canadian Dollar with the
lowest being in March 2018 at 1.00303 and the highest being in August 2018 at approximately
0.956244 for every AUD. The subsequent figures below show the monthly exchange rates from
January to August 2018.
AUD Australian Dollar to US Dollar
Table 2: Monthly exchange rates of AUD TO USD from January to August 2018
Source: Author’s own compilations
From the figure above, the Australian Dollar recorded highs and lows against the US
Dollar between the stipulated periods. The AUD’s strongest performance against the US Dollar
was in August 2018 at 0.718891 for every AUD with the lowest performance being in January at
0.7954.
AUD Australian Dollar to Euro
⊘ This is a preview!⊘
Do you want full access?
Subscribe today to unlock all pages.
Trusted by 1+ million students worldwide
INTERNATIONAL FINANCE 7
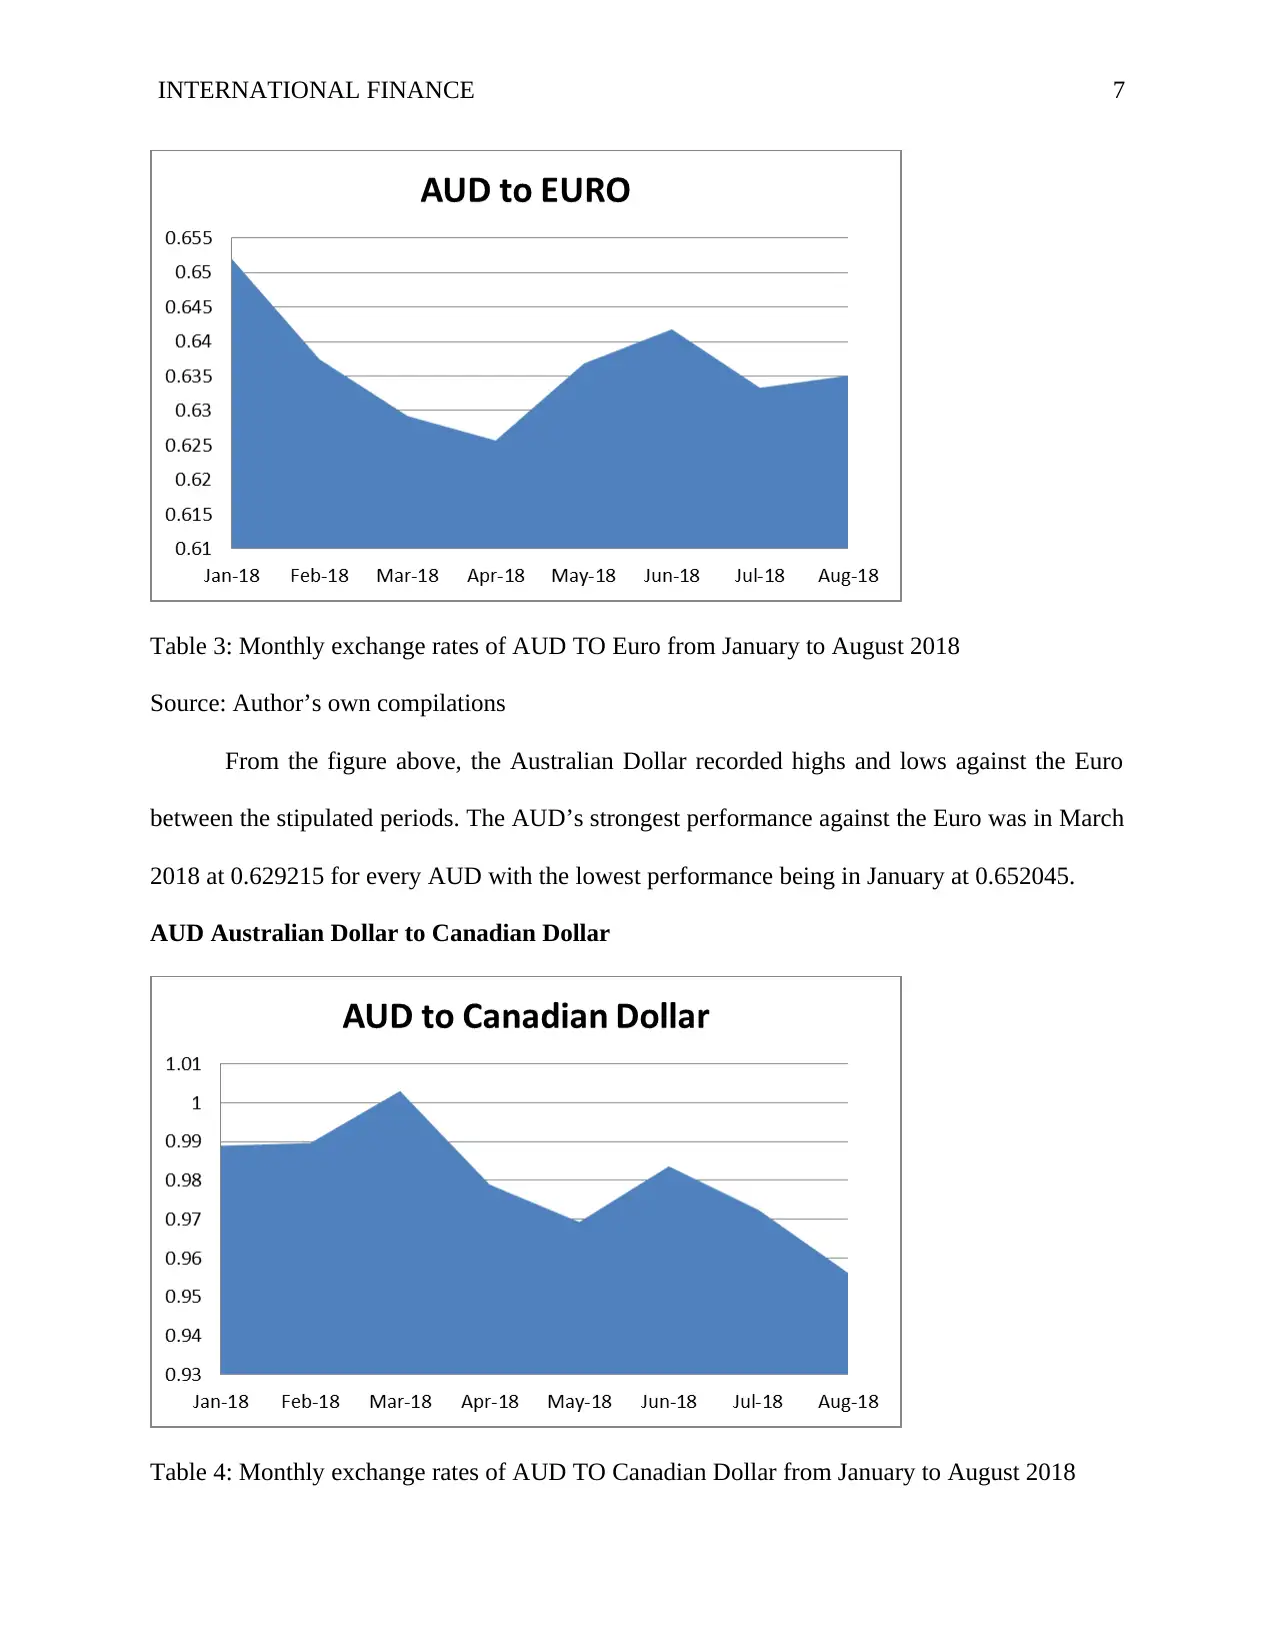
Table 3: Monthly exchange rates of AUD TO Euro from January to August 2018
Source: Author’s own compilations
From the figure above, the Australian Dollar recorded highs and lows against the Euro
between the stipulated periods. The AUD’s strongest performance against the Euro was in March
2018 at 0.629215 for every AUD with the lowest performance being in January at 0.652045.
AUD Australian Dollar to Canadian Dollar
Table 4: Monthly exchange rates of AUD TO Canadian Dollar from January to August 2018
Paraphrase This Document
Need a fresh take? Get an instant paraphrase of this document with our AI Paraphraser
INTERNATIONAL FINANCE 8
Source: Author’s own compilations
From the figure above, the Australian Dollar recorded highs and lows against the
Canadian Dollar between the stipulated periods. The AUD’s strongest performance against the
Canadian dollar was in March 2018 at 1.00303 for every AUD with the lowest performance
being in August at 0.956244.
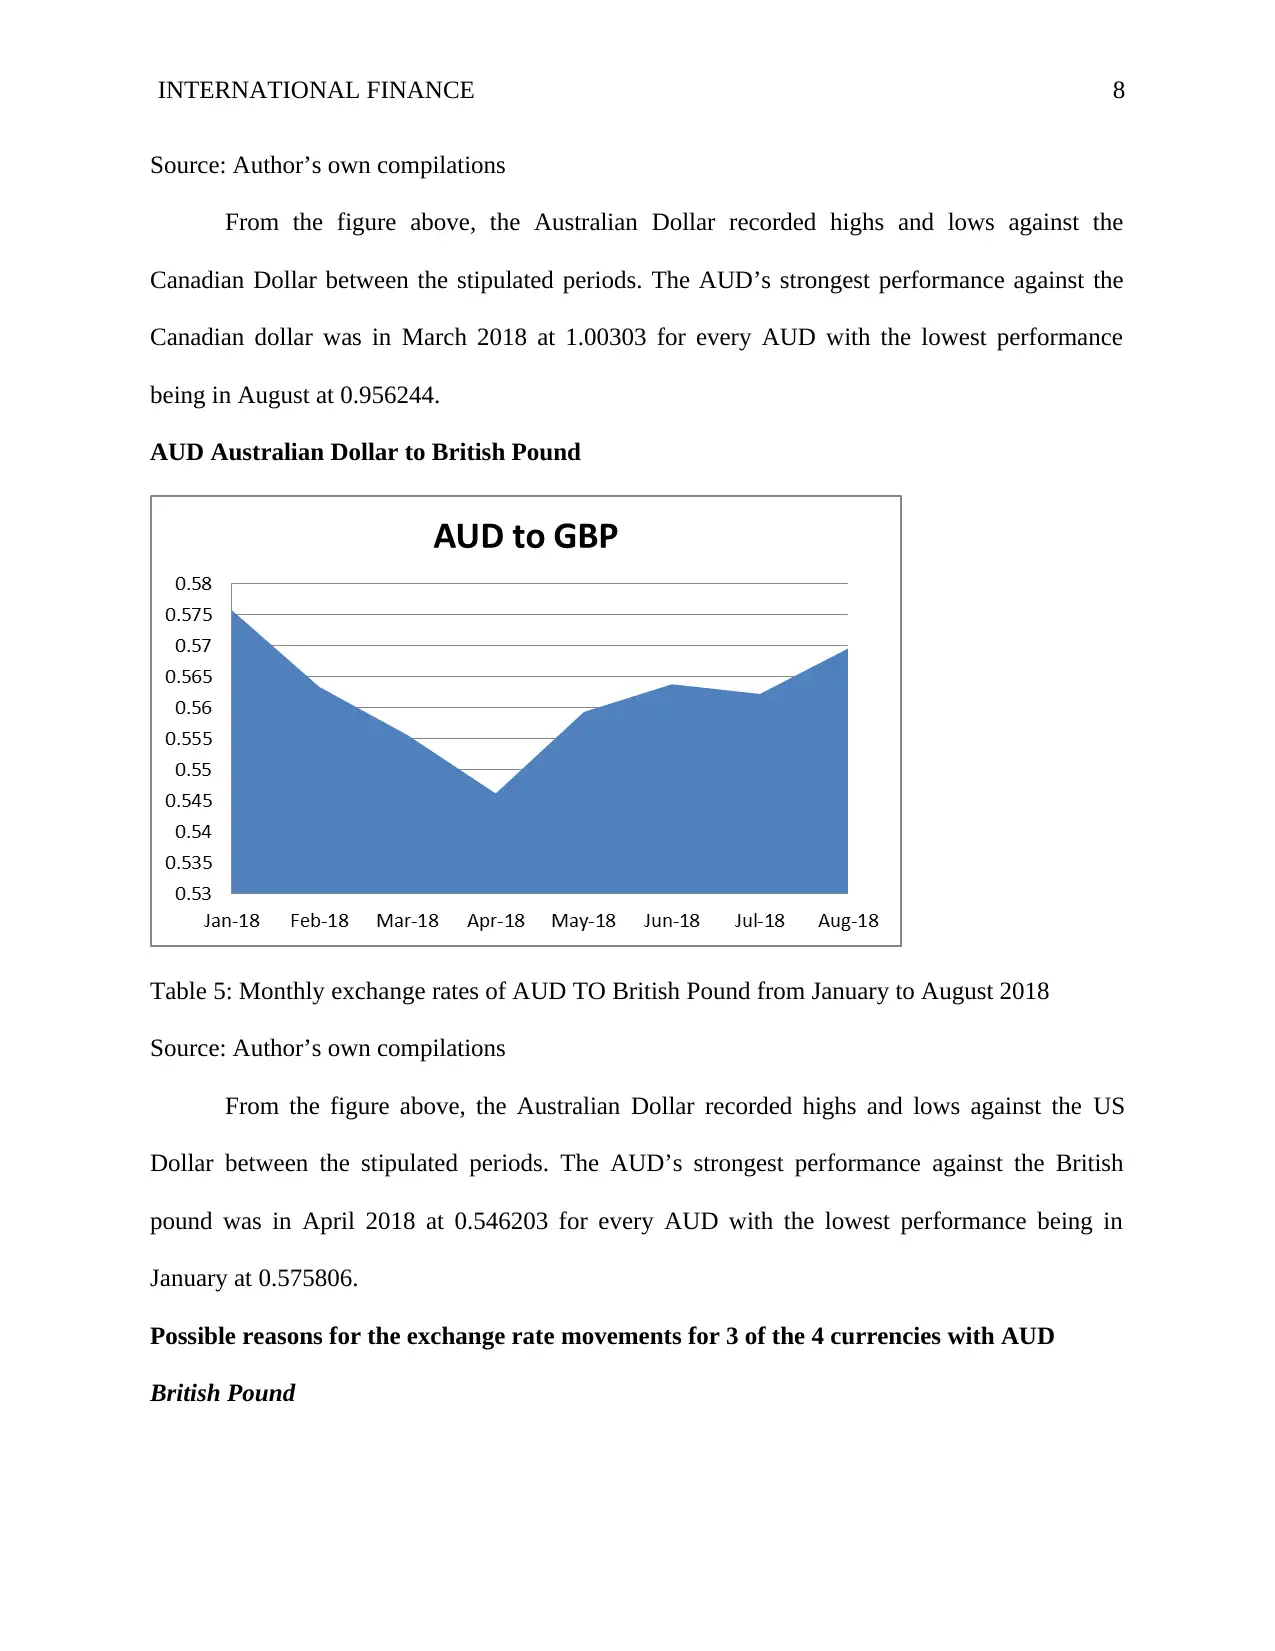
AUD Australian Dollar to British Pound
Table 5: Monthly exchange rates of AUD TO British Pound from January to August 2018
Source: Author’s own compilations
From the figure above, the Australian Dollar recorded highs and lows against the US
Dollar between the stipulated periods. The AUD’s strongest performance against the British
pound was in April 2018 at 0.546203 for every AUD with the lowest performance being in
January at 0.575806.
Possible reasons for the exchange rate movements for 3 of the 4 currencies with AUD
British Pound
Source: Author’s own compilations
From the figure above, the Australian Dollar recorded highs and lows against the
Canadian Dollar between the stipulated periods. The AUD’s strongest performance against the
Canadian dollar was in March 2018 at 1.00303 for every AUD with the lowest performance
being in August at 0.956244.
AUD Australian Dollar to British Pound
Table 5: Monthly exchange rates of AUD TO British Pound from January to August 2018
Source: Author’s own compilations
From the figure above, the Australian Dollar recorded highs and lows against the US
Dollar between the stipulated periods. The AUD’s strongest performance against the British
pound was in April 2018 at 0.546203 for every AUD with the lowest performance being in
January at 0.575806.
Possible reasons for the exchange rate movements for 3 of the 4 currencies with AUD
British Pound
INTERNATIONAL FINANCE 9
The Brexit factor is a significant contributor to the financial instability and increased
economic uncertainty in Australia. Remarkably, most investors in Australia currently favor
trading in gold and US currency as a safe and most viable alternative and a haven for their capital
asset (Olivella-Rosell et al., 2018). Therefore, the fluctuating performance of the AUD against
the GBP can be directly attributed to the Brexit politics.
US Dollar
Despite the overall positive performance of the Australian economy, various financial
reports point at a comparatively weak performance against the dollar. Given Australia’s close
economic ties with China, the current trade war between Beijing and Washington propagated by
the Trump administration is already hurting the Australian dollar (Galeshchuk & Mukherjee,
2017). Specifically, the trade tariffs imposed on Chinese goods by the US is likely to push
commodity prices up. Su & Zhang (2018) reiterates that the Australian dollar has a close
relationship with commodity prices and subsequent rises are likely to affect the performances of
the currency in the markets. Similarly, the decision by the US Federal Reserve to raise the
interest rates has also contributed to the poor performance of the AUD against the USD
(Guofeng 2015).
The Euro
The reserve bank of Australia has numerous effective reserve policies that it constantly
applies especially when dealing with big trading blocs like the European Union. The EU is a
large trading partner with Australia, and this explains why the reserve bank has implemented
various policies to manage and address possible market volatilities. For example, the bank has a
periodic target of inflation ranging from 2% t 3%. Moreover, political instability in EU-member
⊘ This is a preview!⊘
Do you want full access?
Subscribe today to unlock all pages.
Trusted by 1+ million students worldwide
INTERNATIONAL FINANCE
10
countries such as Italy and Spain has further increased market volatilities and subsequent
performances of the AUD against the Euro (Juszczuk & Kruś, 2018).
Trading Strategy Analysis
The trading strategy of the group based on the above financial results
The group used daily trading strategy (daily pivots) and scalping to establish the
exchange rate movements between 17th September and 21st September. The strategy involved
assessing the stock’s daily volatility and establishing whether the speculations surrounding
various market dynamics are likely to affect the exchanges (Nasdaq, 2018). The group attempted
to buy at the low of each day and sold at the high of the same day. However, the group still
recorded losses from the transactions further pointing at the volatile nature of the currency
trading between the USD and AUD. On the other hand, scalping as a strategy used by the group
to conduct the trading involved the exploitation of diverse price gaps and market uncertainties.
Specifically, scalping as a trading strategy involved buying and selling securities on the
same day to receive the differences between the two transactions (Neely & Weller, 2011). The
primary objective of scalping is to decrease the associated risks in the exchange markets. The
traders depended on the small daily moves that are speculated to occur in the market especially
with the ongoing trade war between China and the US. The primary objective of scalping is to
minimize possible losses and maximize profits. As such, dramatic changes in prices or any other
market dynamic is likely to result in a significant amount of losses or increased profits from the
stipulated transactions (Szakmary, Shen & Sharma, 2010).
The trading of $1,000,000 Australian dollars between the period of 17-21Sep and by 6
pm on 21st Sep 2018 was executed in various steps and different amounts as highlighted below.
17th September 2018
Paraphrase This Document
Need a fresh take? Get an instant paraphrase of this document with our AI Paraphraser
INTERNATIONAL FINANCE
11
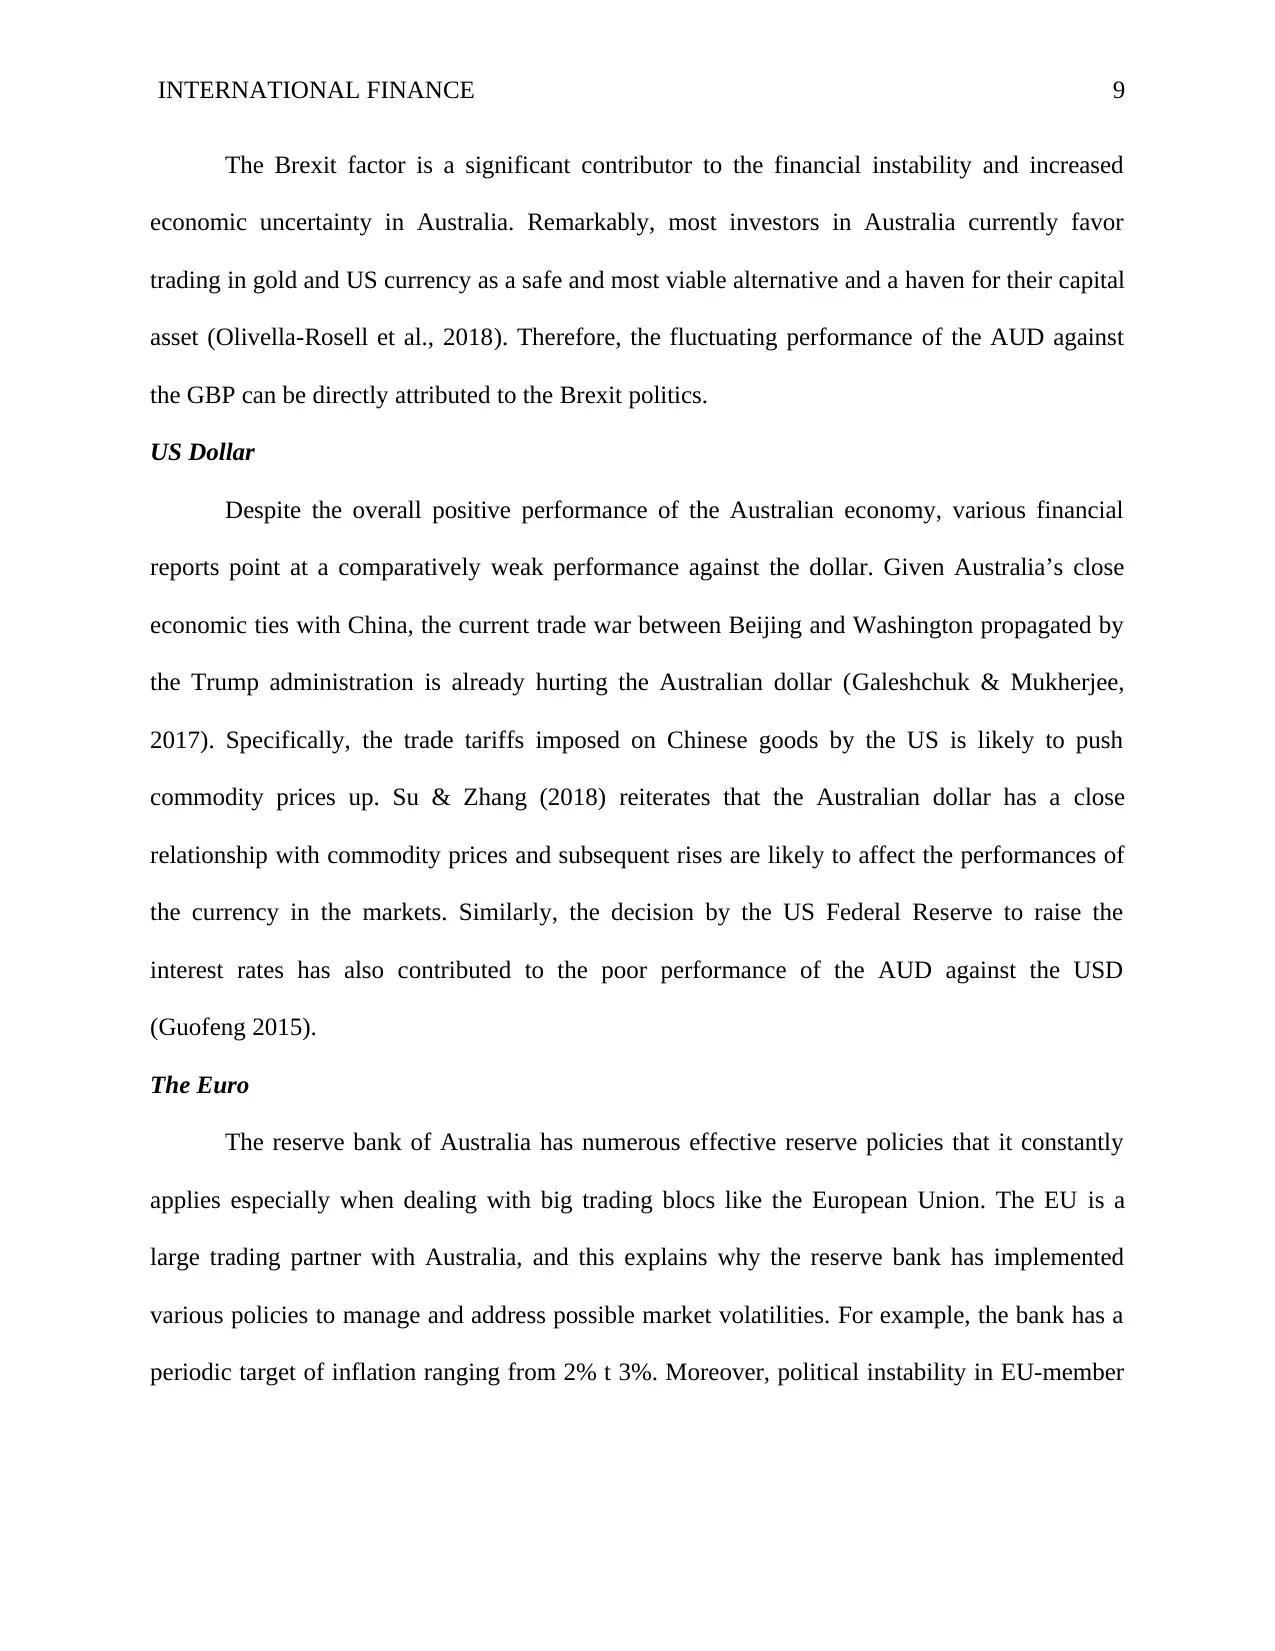
Buying UD Dollars
Figure 1: Buying UD Dollars
Source: OANDA (2018)
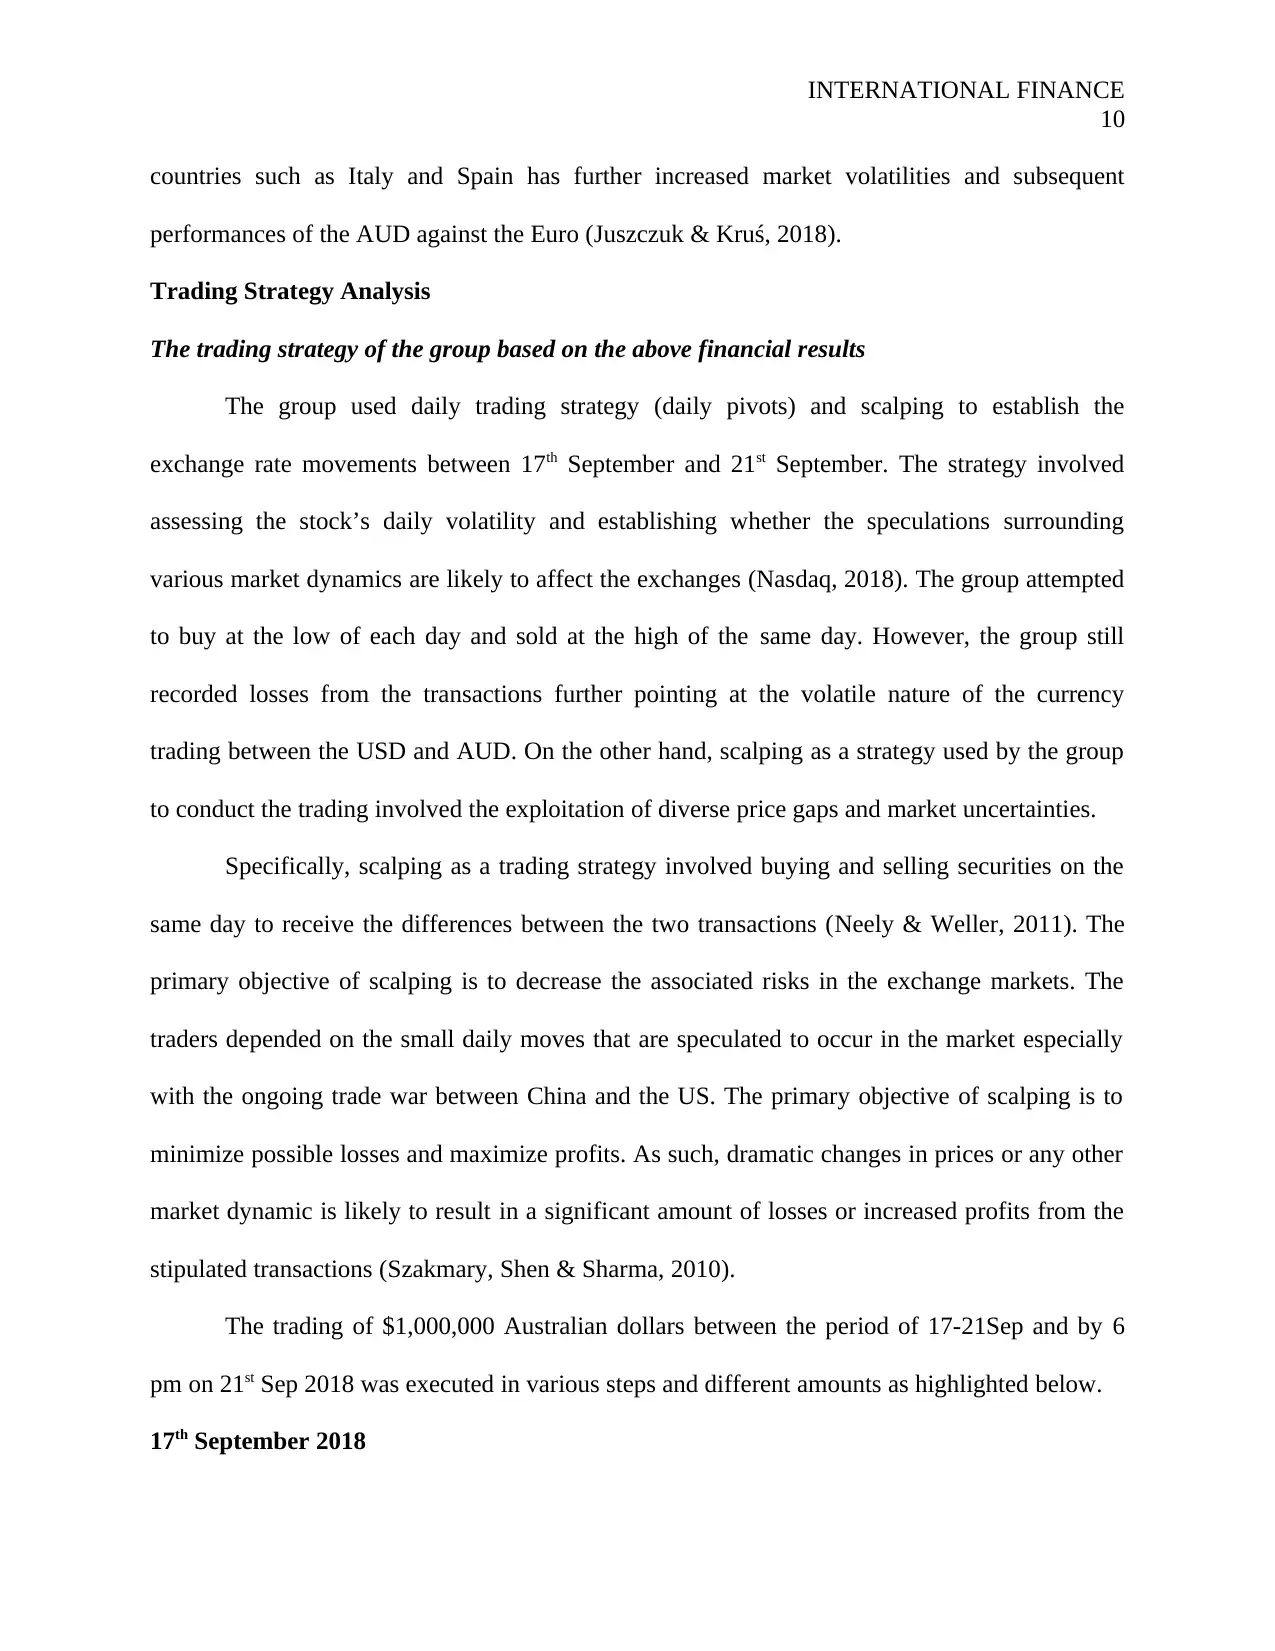
Selling the same US Dollars bought
Figure 2: Selling the same US Dollars bought
Source: OANDA (2018)
On this particular day, about $200,000 Australian dollars that were used to buy US
Dollars generated approximately $142,965. However, when the same amount generated
($142,965) from the transaction was used to buy back Australian dollars on the same day, a loss
of $204 AUD was recorded. The trading was motivated by a host of different factors that
included speculations on the possible impacts of trade wars between China and the US on the
economy of Australia (Nayak, Mishra & Rath, 2017).
18th September 2018
Buying UD Dollars
11
Buying UD Dollars
Figure 1: Buying UD Dollars
Source: OANDA (2018)
Selling the same US Dollars bought
Figure 2: Selling the same US Dollars bought
Source: OANDA (2018)
On this particular day, about $200,000 Australian dollars that were used to buy US
Dollars generated approximately $142,965. However, when the same amount generated
($142,965) from the transaction was used to buy back Australian dollars on the same day, a loss
of $204 AUD was recorded. The trading was motivated by a host of different factors that
included speculations on the possible impacts of trade wars between China and the US on the
economy of Australia (Nayak, Mishra & Rath, 2017).
18th September 2018
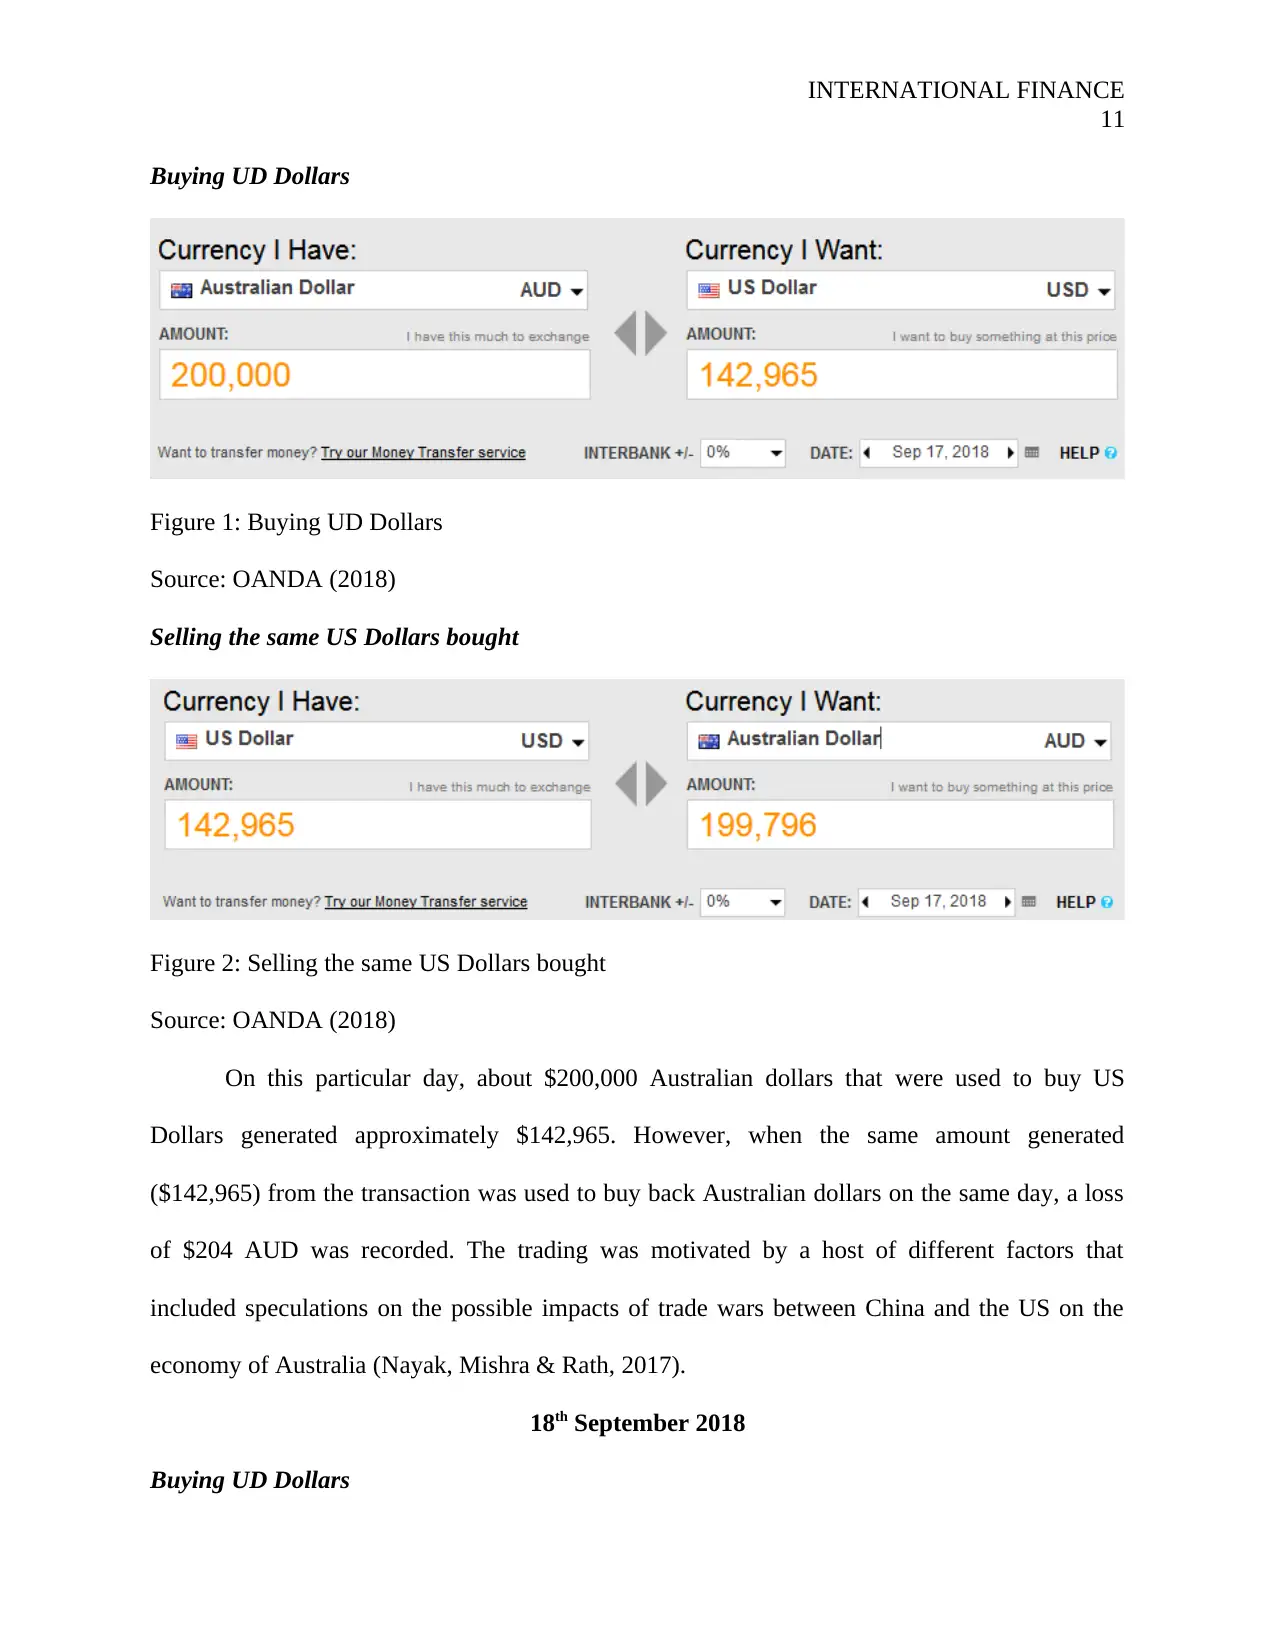
Buying UD Dollars
INTERNATIONAL FINANCE
12
Figure 3: Buying UD Dollars
Source: OANDA (2018)
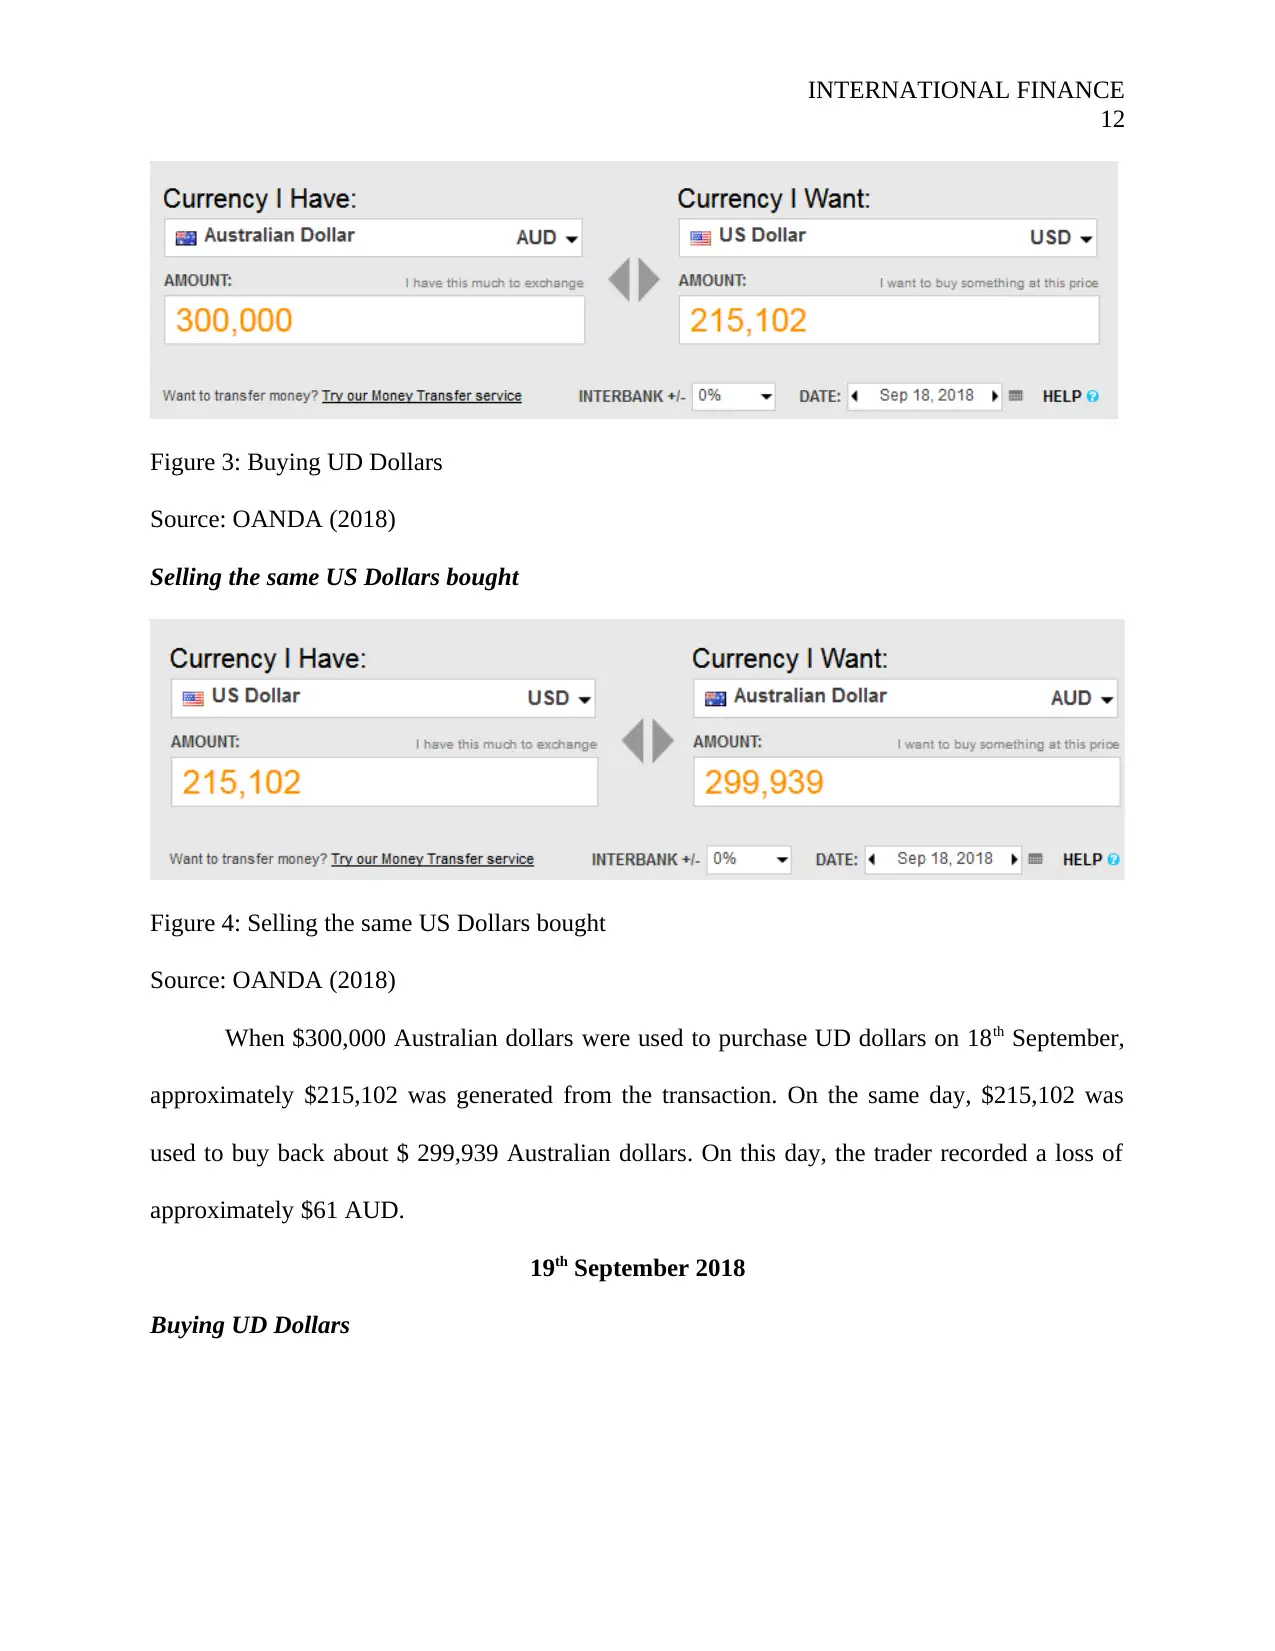
Selling the same US Dollars bought
Figure 4: Selling the same US Dollars bought
Source: OANDA (2018)
When $300,000 Australian dollars were used to purchase UD dollars on 18th September,
approximately $215,102 was generated from the transaction. On the same day, $215,102 was
used to buy back about $ 299,939 Australian dollars. On this day, the trader recorded a loss of
approximately $61 AUD.
19th September 2018
Buying UD Dollars
12
Figure 3: Buying UD Dollars
Source: OANDA (2018)
Selling the same US Dollars bought
Figure 4: Selling the same US Dollars bought
Source: OANDA (2018)
When $300,000 Australian dollars were used to purchase UD dollars on 18th September,
approximately $215,102 was generated from the transaction. On the same day, $215,102 was
used to buy back about $ 299,939 Australian dollars. On this day, the trader recorded a loss of
approximately $61 AUD.
19th September 2018
Buying UD Dollars
⊘ This is a preview!⊘
Do you want full access?
Subscribe today to unlock all pages.
Trusted by 1+ million students worldwide
1 out of 19
Related Documents


Your All-in-One AI-Powered Toolkit for Academic Success.
+13062052269
info@desklib.com
Available 24*7 on WhatsApp / Email
![[object Object]](/_next/static/media/star-bottom.7253800d.svg)
Unlock your academic potential
Copyright © 2020–2026 A2Z Services. All Rights Reserved. Developed and managed by ZUCOL.