International Business Environment: Brazil and Russia's FDI Trends
VerifiedAdded on 2021/06/15
|32
|7795
|110
Report
AI Summary
This report provides an in-depth analysis of the international business environment, focusing on the outward foreign direct investment (OFDI) trends of Brazilian and Russian companies. It examines the challenges faced by these companies, particularly those related to economic crises and political instability, as they expand their operations abroad. The report highlights the role of OFDI in national development, analyzing its contributions to both countries and utilizing various theories to discuss current trends. It explores the determinants of OFDI, including economic performance, political stability, geographical distance, state of institution, and cultural effects. The report also details the sectoral focus of investments, such as financial services, oil exploration, and construction, and compares the OFDI patterns, including destinations and motivations, of both countries. The report also discusses the impact of the Eurasian Economic Union (EEU) on Russian FDI and the importance of economic motives and government support in Brazil's internationalization strategy.
International business environment1
INTERNATIONAL BUSINESS ENVIRONMENT
Name:
Department:
School:
Date:
INTERNATIONAL BUSINESS ENVIRONMENT
Name:
Department:
School:
Date:
Paraphrase This Document
Need a fresh take? Get an instant paraphrase of this document with our AI Paraphraser
International business environment 2
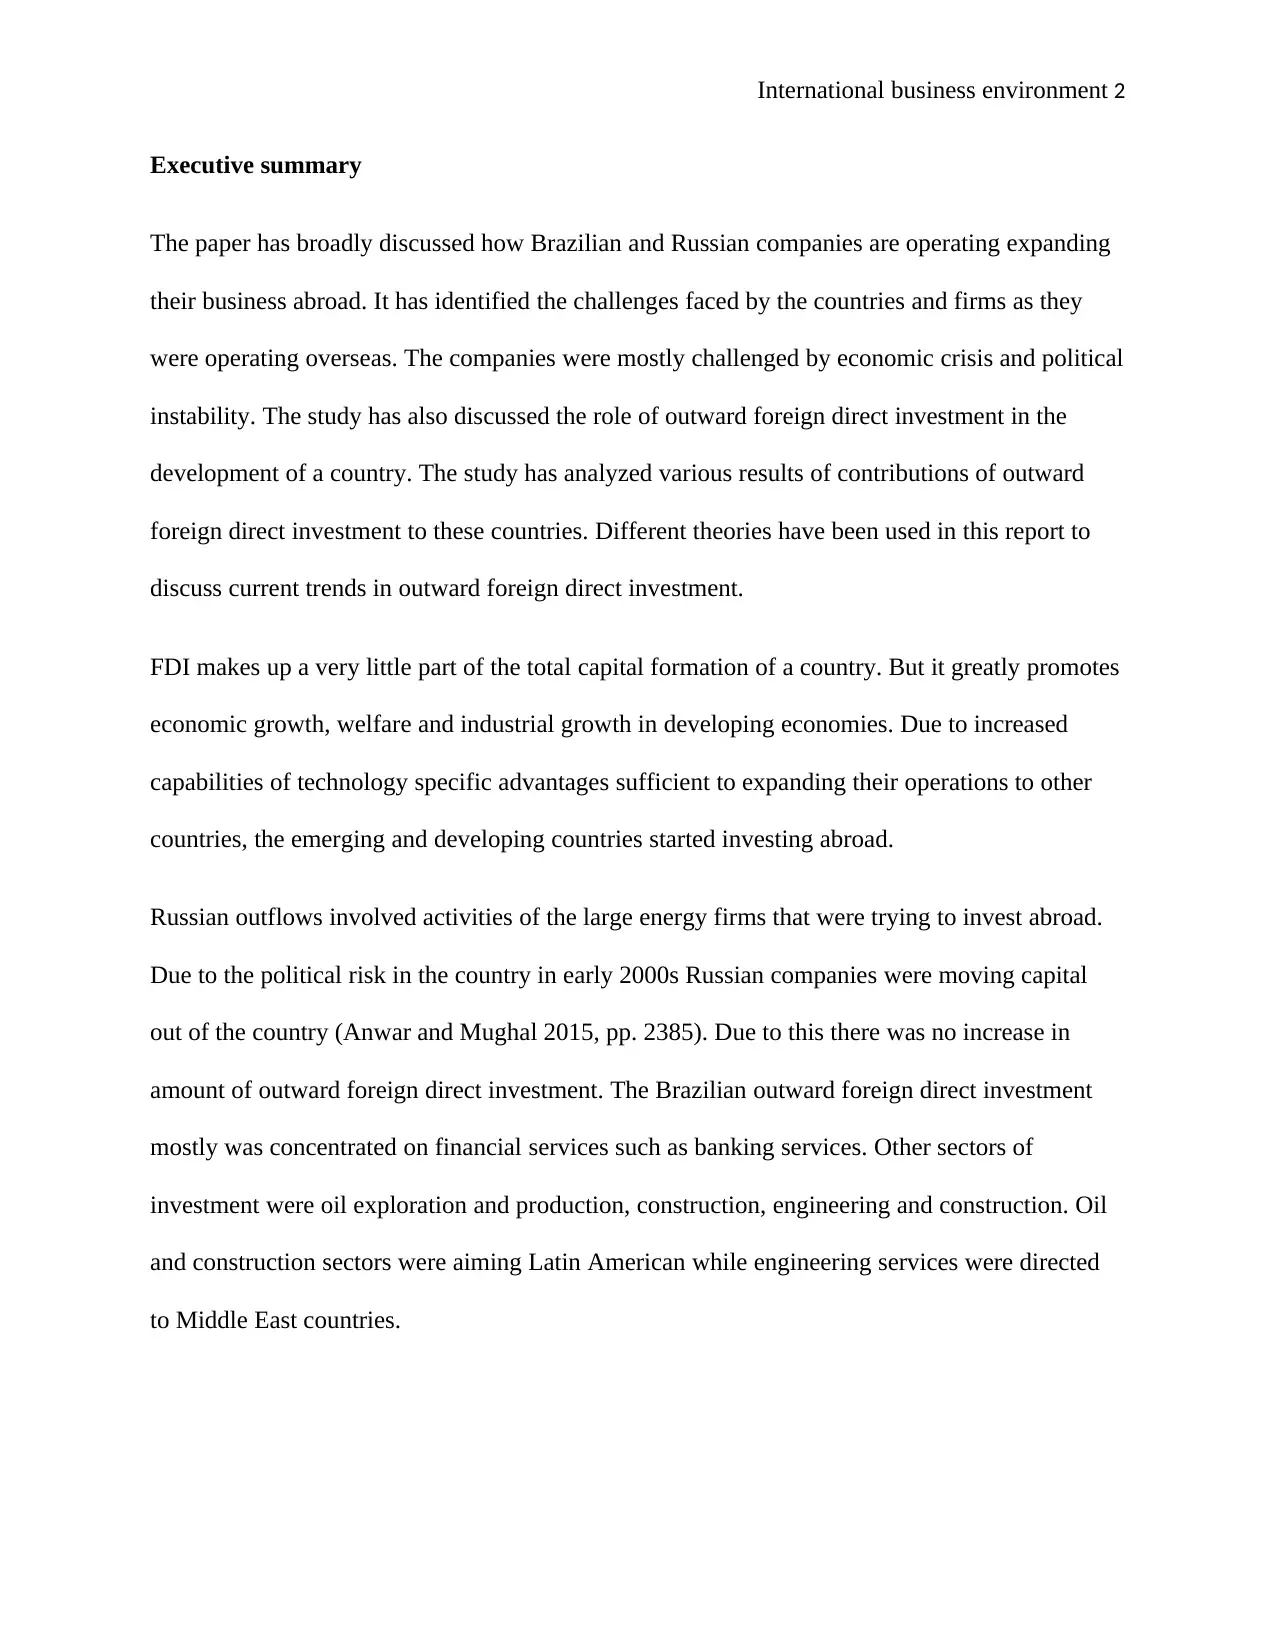
Executive summary
The paper has broadly discussed how Brazilian and Russian companies are operating expanding
their business abroad. It has identified the challenges faced by the countries and firms as they
were operating overseas. The companies were mostly challenged by economic crisis and political
instability. The study has also discussed the role of outward foreign direct investment in the
development of a country. The study has analyzed various results of contributions of outward
foreign direct investment to these countries. Different theories have been used in this report to
discuss current trends in outward foreign direct investment.
FDI makes up a very little part of the total capital formation of a country. But it greatly promotes
economic growth, welfare and industrial growth in developing economies. Due to increased
capabilities of technology specific advantages sufficient to expanding their operations to other
countries, the emerging and developing countries started investing abroad.
Russian outflows involved activities of the large energy firms that were trying to invest abroad.
Due to the political risk in the country in early 2000s Russian companies were moving capital
out of the country (Anwar and Mughal 2015, pp. 2385). Due to this there was no increase in
amount of outward foreign direct investment. The Brazilian outward foreign direct investment
mostly was concentrated on financial services such as banking services. Other sectors of
investment were oil exploration and production, construction, engineering and construction. Oil
and construction sectors were aiming Latin American while engineering services were directed
to Middle East countries.
International business environment 3
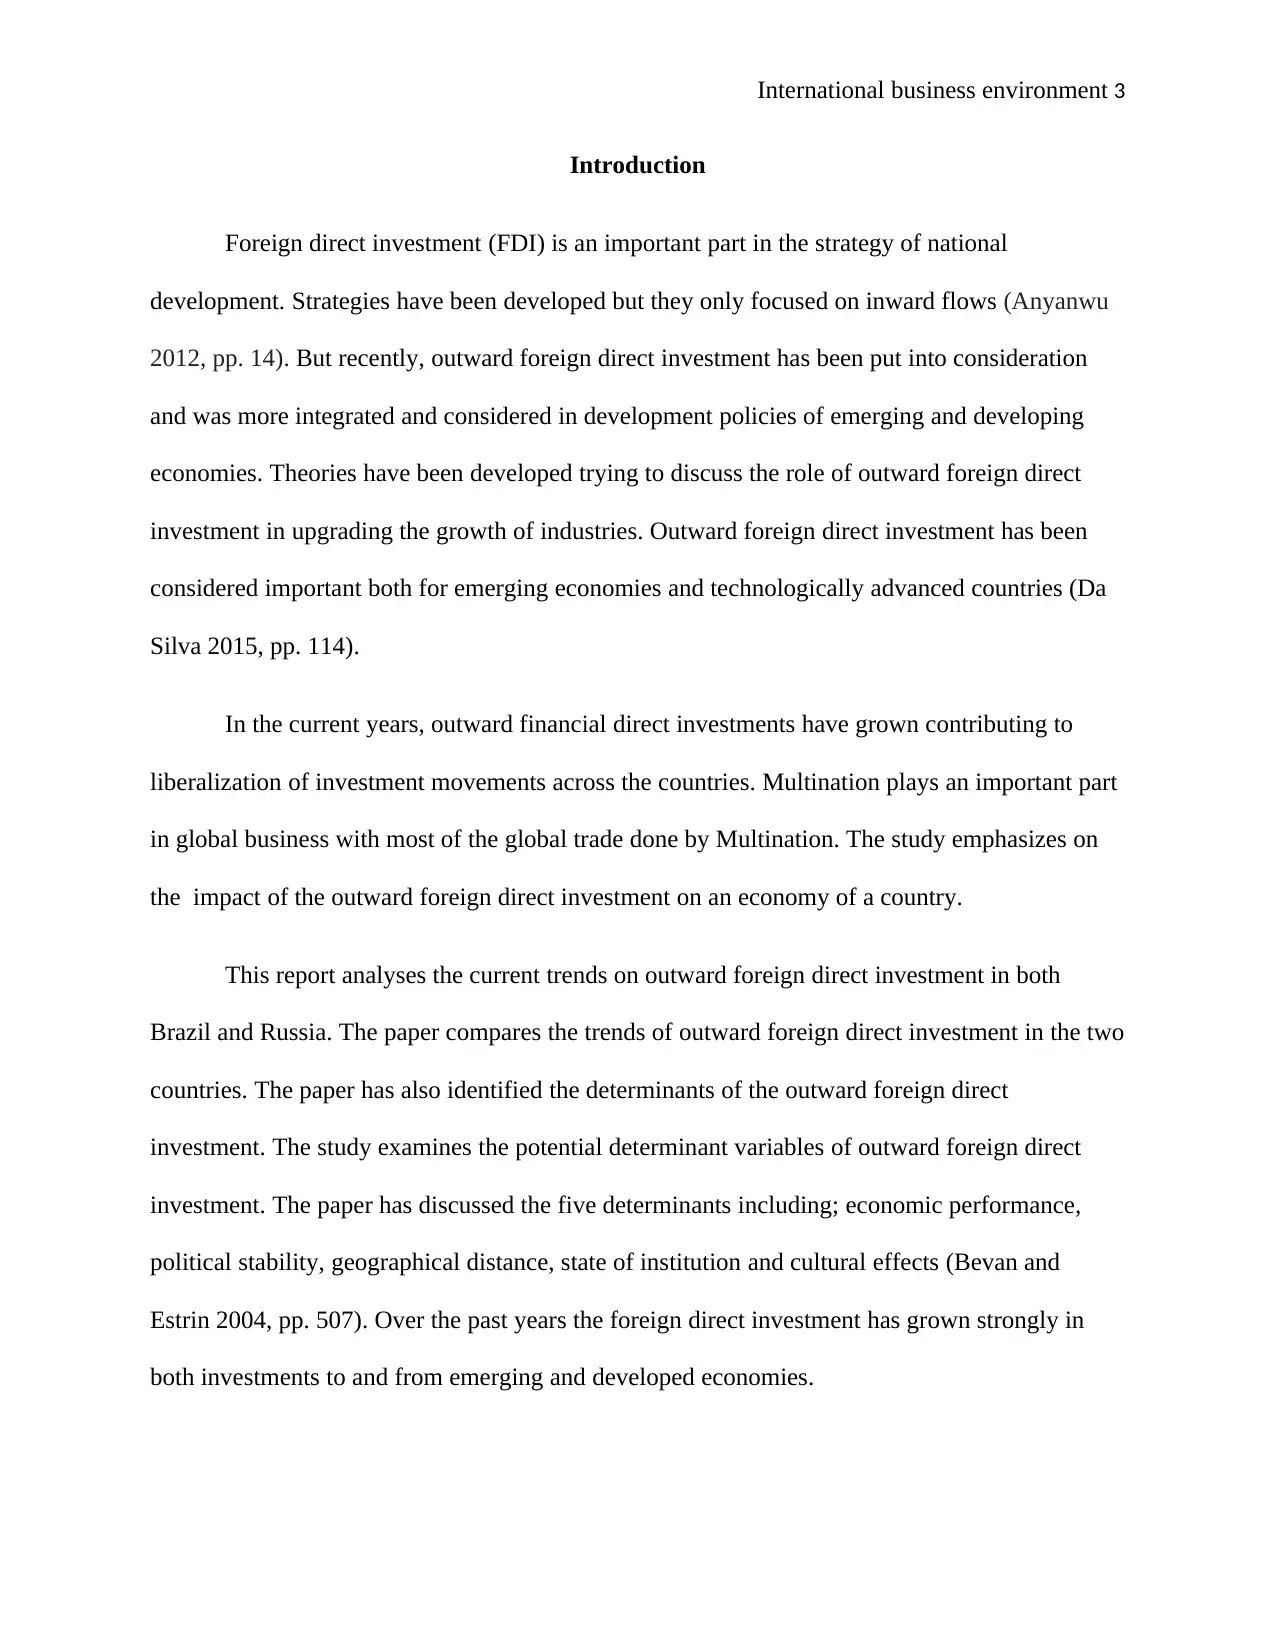
Introduction
Foreign direct investment (FDI) is an important part in the strategy of national
development. Strategies have been developed but they only focused on inward flows (Anyanwu
2012, pp. 14). But recently, outward foreign direct investment has been put into consideration
and was more integrated and considered in development policies of emerging and developing
economies. Theories have been developed trying to discuss the role of outward foreign direct
investment in upgrading the growth of industries. Outward foreign direct investment has been
considered important both for emerging economies and technologically advanced countries (Da
Silva 2015, pp. 114).
In the current years, outward financial direct investments have grown contributing to
liberalization of investment movements across the countries. Multination plays an important part
in global business with most of the global trade done by Multination. The study emphasizes on
the impact of the outward foreign direct investment on an economy of a country.
This report analyses the current trends on outward foreign direct investment in both
Brazil and Russia. The paper compares the trends of outward foreign direct investment in the two
countries. The paper has also identified the determinants of the outward foreign direct
investment. The study examines the potential determinant variables of outward foreign direct
investment. The paper has discussed the five determinants including; economic performance,
political stability, geographical distance, state of institution and cultural effects (Bevan and
Estrin 2004, pp. 507). Over the past years the foreign direct investment has grown strongly in
both investments to and from emerging and developed economies.
⊘ This is a preview!⊘
Do you want full access?
Subscribe today to unlock all pages.
Trusted by 1+ million students worldwide
International business environment 4
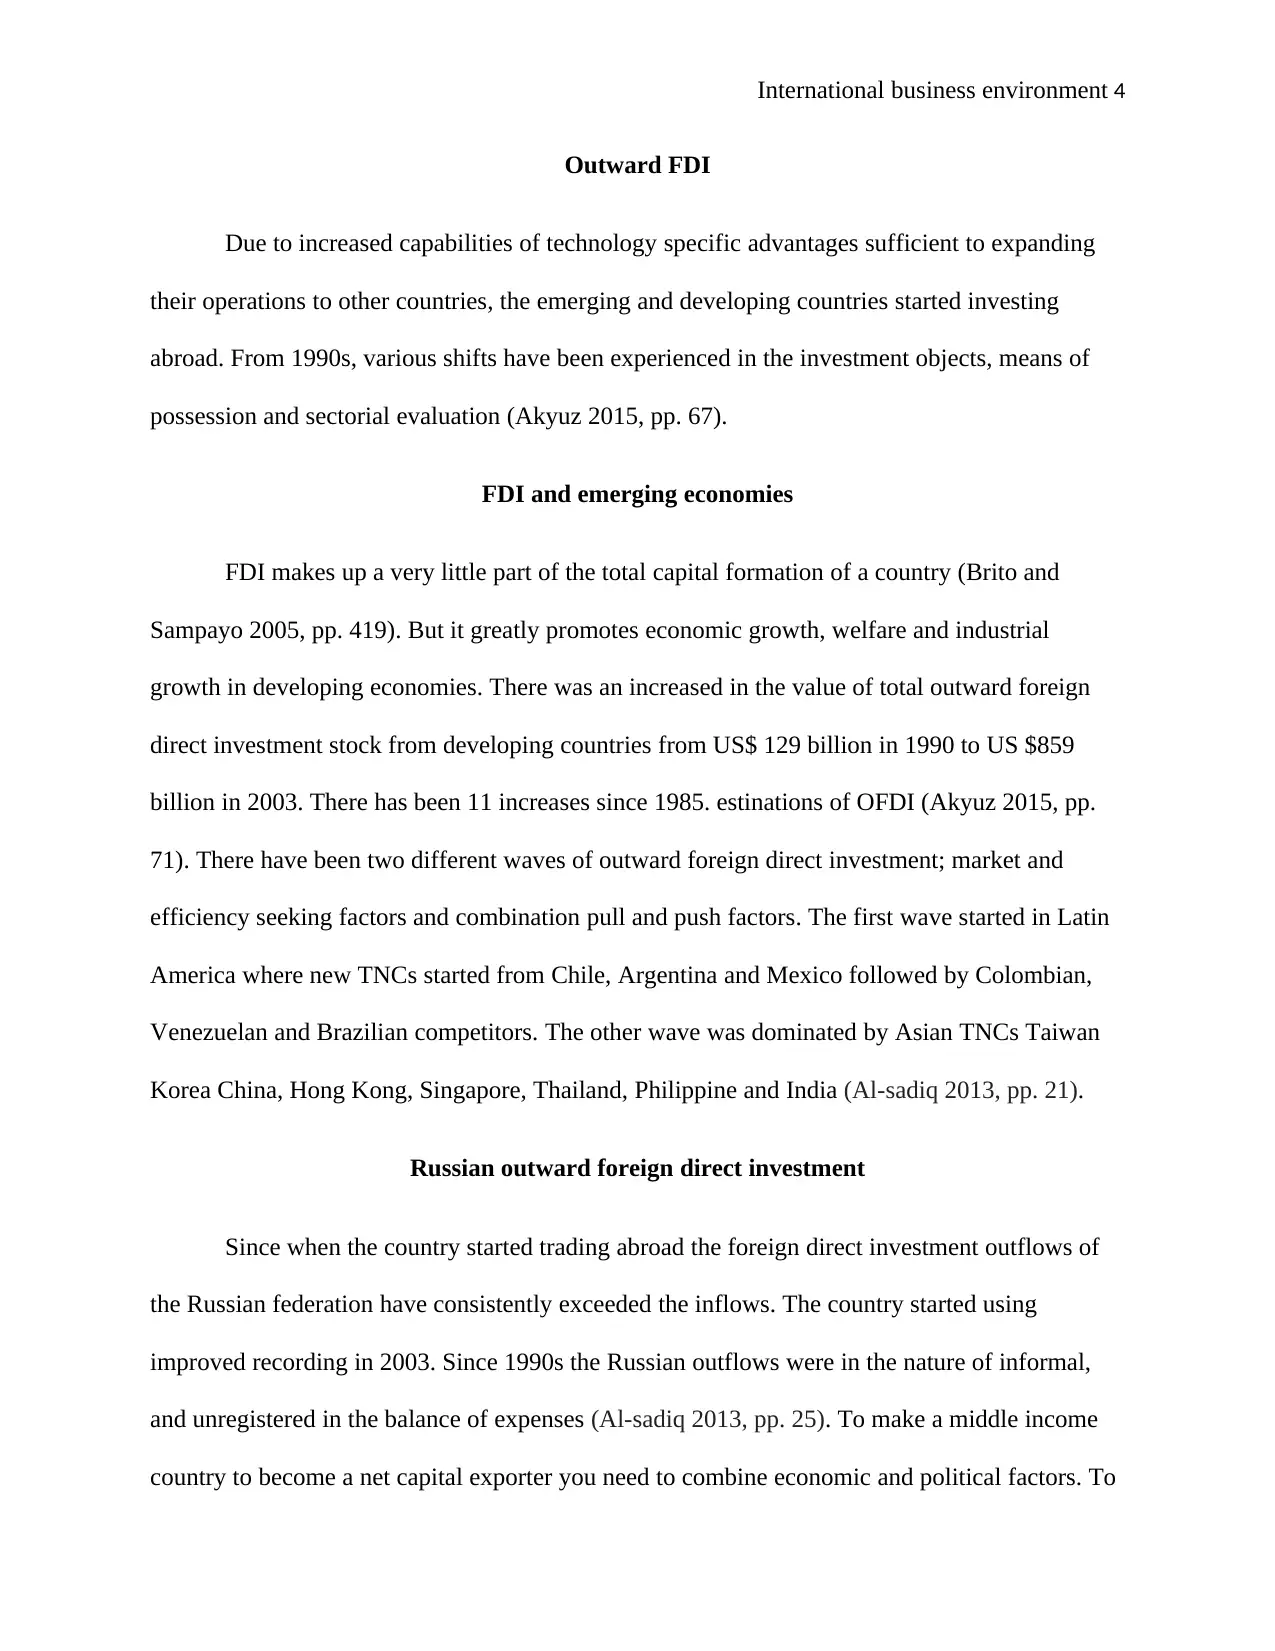
Outward FDI
Due to increased capabilities of technology specific advantages sufficient to expanding
their operations to other countries, the emerging and developing countries started investing
abroad. From 1990s, various shifts have been experienced in the investment objects, means of
possession and sectorial evaluation (Akyuz 2015, pp. 67).
FDI and emerging economies
FDI makes up a very little part of the total capital formation of a country (Brito and
Sampayo 2005, pp. 419). But it greatly promotes economic growth, welfare and industrial
growth in developing economies. There was an increased in the value of total outward foreign
direct investment stock from developing countries from US$ 129 billion in 1990 to US $859
billion in 2003. There has been 11 increases since 1985. estinations of OFDI (Akyuz 2015, pp.
71). There have been two different waves of outward foreign direct investment; market and
efficiency seeking factors and combination pull and push factors. The first wave started in Latin
America where new TNCs started from Chile, Argentina and Mexico followed by Colombian,
Venezuelan and Brazilian competitors. The other wave was dominated by Asian TNCs Taiwan
Korea China, Hong Kong, Singapore, Thailand, Philippine and India (Al-sadiq 2013, pp. 21).
Russian outward foreign direct investment
Since when the country started trading abroad the foreign direct investment outflows of
the Russian federation have consistently exceeded the inflows. The country started using
improved recording in 2003. Since 1990s the Russian outflows were in the nature of informal,
and unregistered in the balance of expenses (Al-sadiq 2013, pp. 25). To make a middle income
country to become a net capital exporter you need to combine economic and political factors. To
Paraphrase This Document
Need a fresh take? Get an instant paraphrase of this document with our AI Paraphraser
International business environment 5
combine these factors such as business environment and economic has still been hard. This was
due to their oligarchy which was created under the governance of Boris Yeltisin, Where most of
the natural resources have been privatized in the country (Le and Zak 2006, pp. 309). The
political changes happening in the government can only have a limited increase in the influence
of the state (Jones and Wren 2016, pp.35). The Russian strategic interest to take control of their
vertical value chains through outward foreign direct investment was long term (Andreff 2017,
pp. 24).
Russian outflows involved activities of the large energy firms that were trying to invest
abroad. Due to the political risk in the country in early 2000s Russian companies were moving
capital out of the country (Al-sadiq 2013, pp. 27). Due to this there was no increase in amount of
outward foreign direct investment. Russian companies’ outward foreign direct investment was
mostly aimed at resource related sectors such as metals and energy.
According to the research, Russians 2014 outward foreign direct investment were half
that of 2013 (Andreff 2017, pp. 26). This was as results of Russian companies’ reduced their
activities in abroad due to scarce financial resources and fear of restrictions by countries that
fated Russia’s actions in Ukraine. Another growth in outward foreign direct investment is
expected until they form a stable relationship with west (Kumar 2016, pp. 519).
The largest recipient and contributor of Russian foreign direct investment is Europe.
Many of the Russian companies have invested in Europe (Acaravci and Ozturk 2012, pp. 52).
Russian companies are focused in extra outward investment in production chain, technology
series and guaranteed product markets and supplies in Europe. There is an expectation of the
International business environment 6
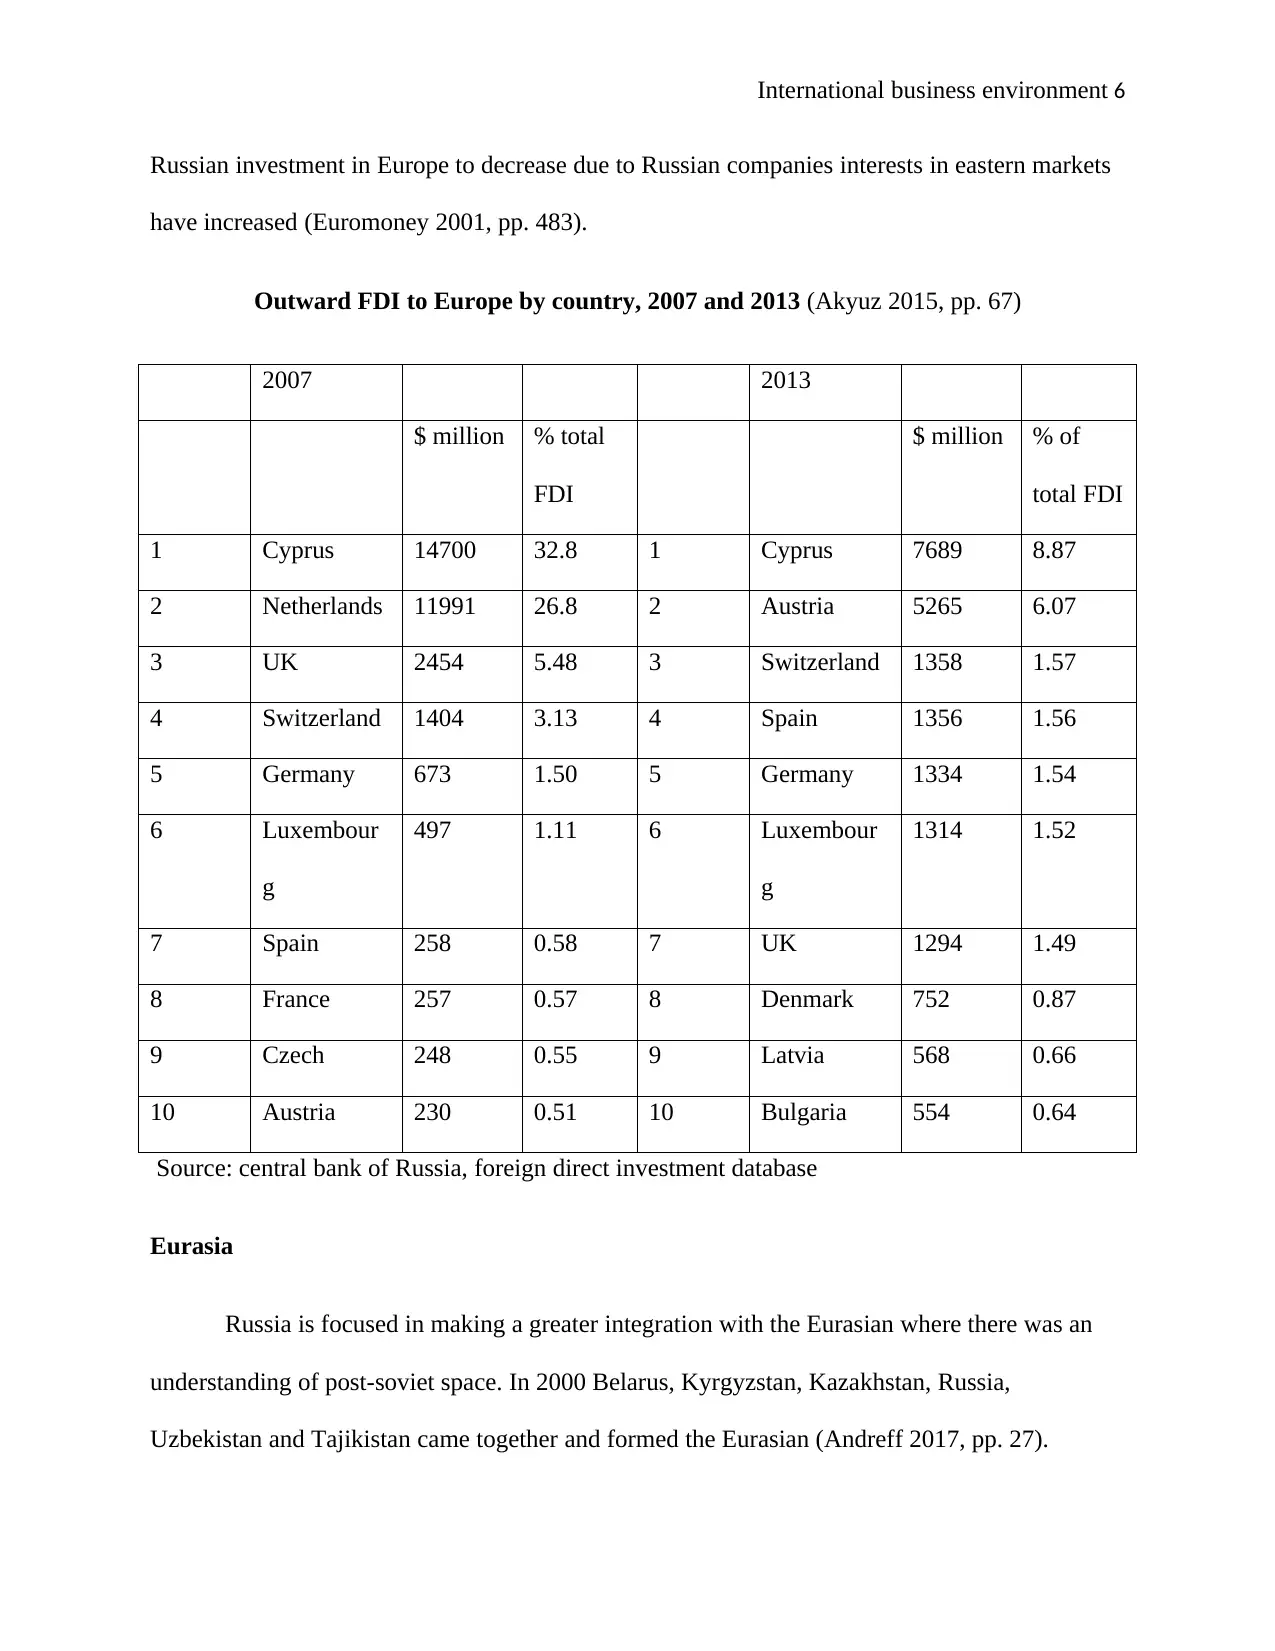
Russian investment in Europe to decrease due to Russian companies interests in eastern markets
have increased (Euromoney 2001, pp. 483).
Outward FDI to Europe by country, 2007 and 2013 (Akyuz 2015, pp. 67)
2007 2013
$ million % total
FDI
$ million % of
total FDI
1 Cyprus 14700 32.8 1 Cyprus 7689 8.87
2 Netherlands 11991 26.8 2 Austria 5265 6.07
3 UK 2454 5.48 3 Switzerland 1358 1.57
4 Switzerland 1404 3.13 4 Spain 1356 1.56
5 Germany 673 1.50 5 Germany 1334 1.54
6 Luxembour
g
497 1.11 6 Luxembour
g
1314 1.52
7 Spain 258 0.58 7 UK 1294 1.49
8 France 257 0.57 8 Denmark 752 0.87
9 Czech 248 0.55 9 Latvia 568 0.66
10 Austria 230 0.51 10 Bulgaria 554 0.64
Source: central bank of Russia, foreign direct investment database
Eurasia
Russia is focused in making a greater integration with the Eurasian where there was an
understanding of post-soviet space. In 2000 Belarus, Kyrgyzstan, Kazakhstan, Russia,
Uzbekistan and Tajikistan came together and formed the Eurasian (Andreff 2017, pp. 27).
⊘ This is a preview!⊘
Do you want full access?
Subscribe today to unlock all pages.
Trusted by 1+ million students worldwide
International business environment 7
Eurasia was formed to encourage a customs union and single economic space, manage member
states’ policies and assimilate them into the world economy.
In 2010, the Eurasian customs union was formed, and the EEU was established in 2015,
which was focused in in greater economic integration (Anwar and Mughal 2015, pp. 2388). The
EEU was made up of Belarus, Armenia, Russia, Kyrgyzstan and Kazakhstan. EEU had a
different objective from EAEC and Eurasian Custom Union which aimed at common trade,
establishing of super natural agencies, monetary and fiscal policies, economic commission,
international investment bank, and commodities commission (CIA 2006).
Currently Russian inflows from EEU members is 0.7% of the total FDI inflows and
Russian foreign direct investment outflows of 1.9% of its total outflows to members of EEU
(Akyuz 2015, pp. 76). Internalization of Brazilian companies was contributed by economic
motives, political support from their governments to invest abroad. Russia and Brazil have
particular strengths that led them to join both developing and developed countries and follow
their internationalization strategy (Andreff 2017, pp. 29).
Many companies from different countries have entered the international markets.
Fundamental changes and economic liberation in foreign regimes of BRIC have attracted high
FDI inflows to these countries and motivated companies from these countries to invest overseas
(Bartlett and Beamish 2018, pp. 121). The world investment report shows that the rate of
outward foreign direct investment growth by firms from emerging markets has outperformed the
foreign direct investment growing by firms from developing markets
Paraphrase This Document
Need a fresh take? Get an instant paraphrase of this document with our AI Paraphraser
International business environment 8
Outward foreign direct investment in Brazil
The Brazilian outward foreign direct investment mostly was concentrated on financial
services such as banking services (Jensen, Biglaiser and Li 2012, pp. 24). Other sectors of
investment were oil exploration and production, construction, engineering and construction. Oil
and construction sectors were aiming Latin American while engineering services were directed
to Middle East countries.
In 2008 there was a high Brazilian OFDI stock growth rate of 25% (Akyuz 2015, pp. 80).
This was as a result of intercompany loans from parent companies to failing subsidiaries abroad
as well as new acquirements of mining an natural-resource-based industries (Al-sadiq 2013, pp.
28).Due to worldwide economic and financial crisis which was experienced in 2009, there was
negative FDI outflow from Brazil. Through intercompany transfers the Brazilian parent
companies lost $10 billion from their foreign subsidiaries (Akyuz 2015, pp. 82). The Brazilian
companies did not venture much abroad due to depreciation and loss of market value of oversea
equity. This was due to uncertainty caused by economic crisis and international credit conditions.
Trans-border mergers and acquisition (M&As) by Brazilian MNCs failed in 2009
although its effect were not felt much in Brazil. The growth rate of Brazil’s GDP was 7.5% and
equity investment in foreign subsidiaries by Brazilian MNCs was $11.5 billion in 2010 (Cruz
2015, pp. 92). From 2010, Brazilian OFDI stock that was directed to Europe has been
significantly raising due takeovers of Austrian banks. Brazil was ranked19th largest outward
investor in 2007 where Russia was ranked 12th. In 2012, outward foreign direct investment stock
from Brazil was ranked 18th world’s most important source of OFDI with Russia being the 15th
(Al-sadiq 2013, pp. 31).
International business environment 9
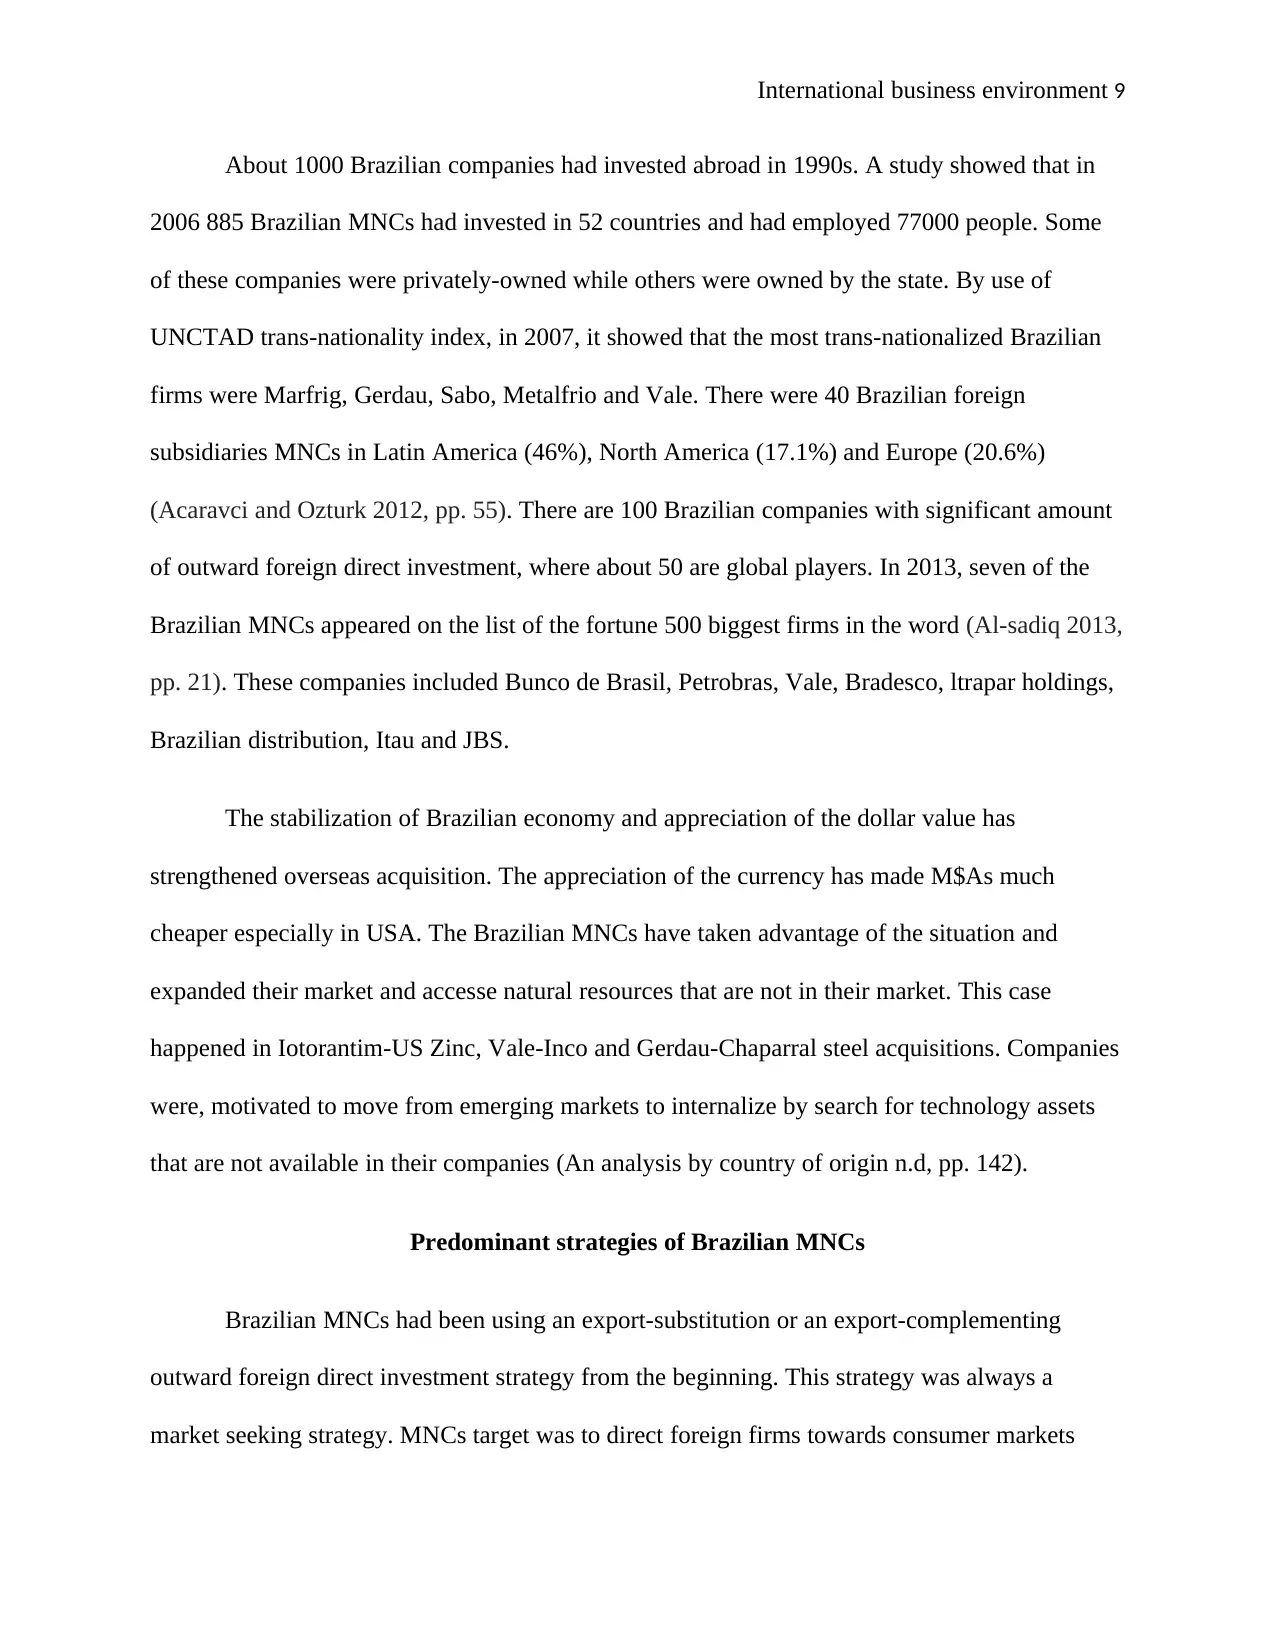
About 1000 Brazilian companies had invested abroad in 1990s. A study showed that in
2006 885 Brazilian MNCs had invested in 52 countries and had employed 77000 people. Some
of these companies were privately-owned while others were owned by the state. By use of
UNCTAD trans-nationality index, in 2007, it showed that the most trans-nationalized Brazilian
firms were Marfrig, Gerdau, Sabo, Metalfrio and Vale. There were 40 Brazilian foreign
subsidiaries MNCs in Latin America (46%), North America (17.1%) and Europe (20.6%)
(Acaravci and Ozturk 2012, pp. 55). There are 100 Brazilian companies with significant amount
of outward foreign direct investment, where about 50 are global players. In 2013, seven of the
Brazilian MNCs appeared on the list of the fortune 500 biggest firms in the word (Al-sadiq 2013,
pp. 21). These companies included Bunco de Brasil, Petrobras, Vale, Bradesco, ltrapar holdings,
Brazilian distribution, Itau and JBS.
The stabilization of Brazilian economy and appreciation of the dollar value has
strengthened overseas acquisition. The appreciation of the currency has made M$As much
cheaper especially in USA. The Brazilian MNCs have taken advantage of the situation and
expanded their market and accesse natural resources that are not in their market. This case
happened in Iotorantim-US Zinc, Vale-Inco and Gerdau-Chaparral steel acquisitions. Companies
were, motivated to move from emerging markets to internalize by search for technology assets
that are not available in their companies (An analysis by country of origin n.d, pp. 142).
Predominant strategies of Brazilian MNCs
Brazilian MNCs had been using an export-substitution or an export-complementing
outward foreign direct investment strategy from the beginning. This strategy was always a
market seeking strategy. MNCs target was to direct foreign firms towards consumer markets
⊘ This is a preview!⊘
Do you want full access?
Subscribe today to unlock all pages.
Trusted by 1+ million students worldwide
International business environment 10
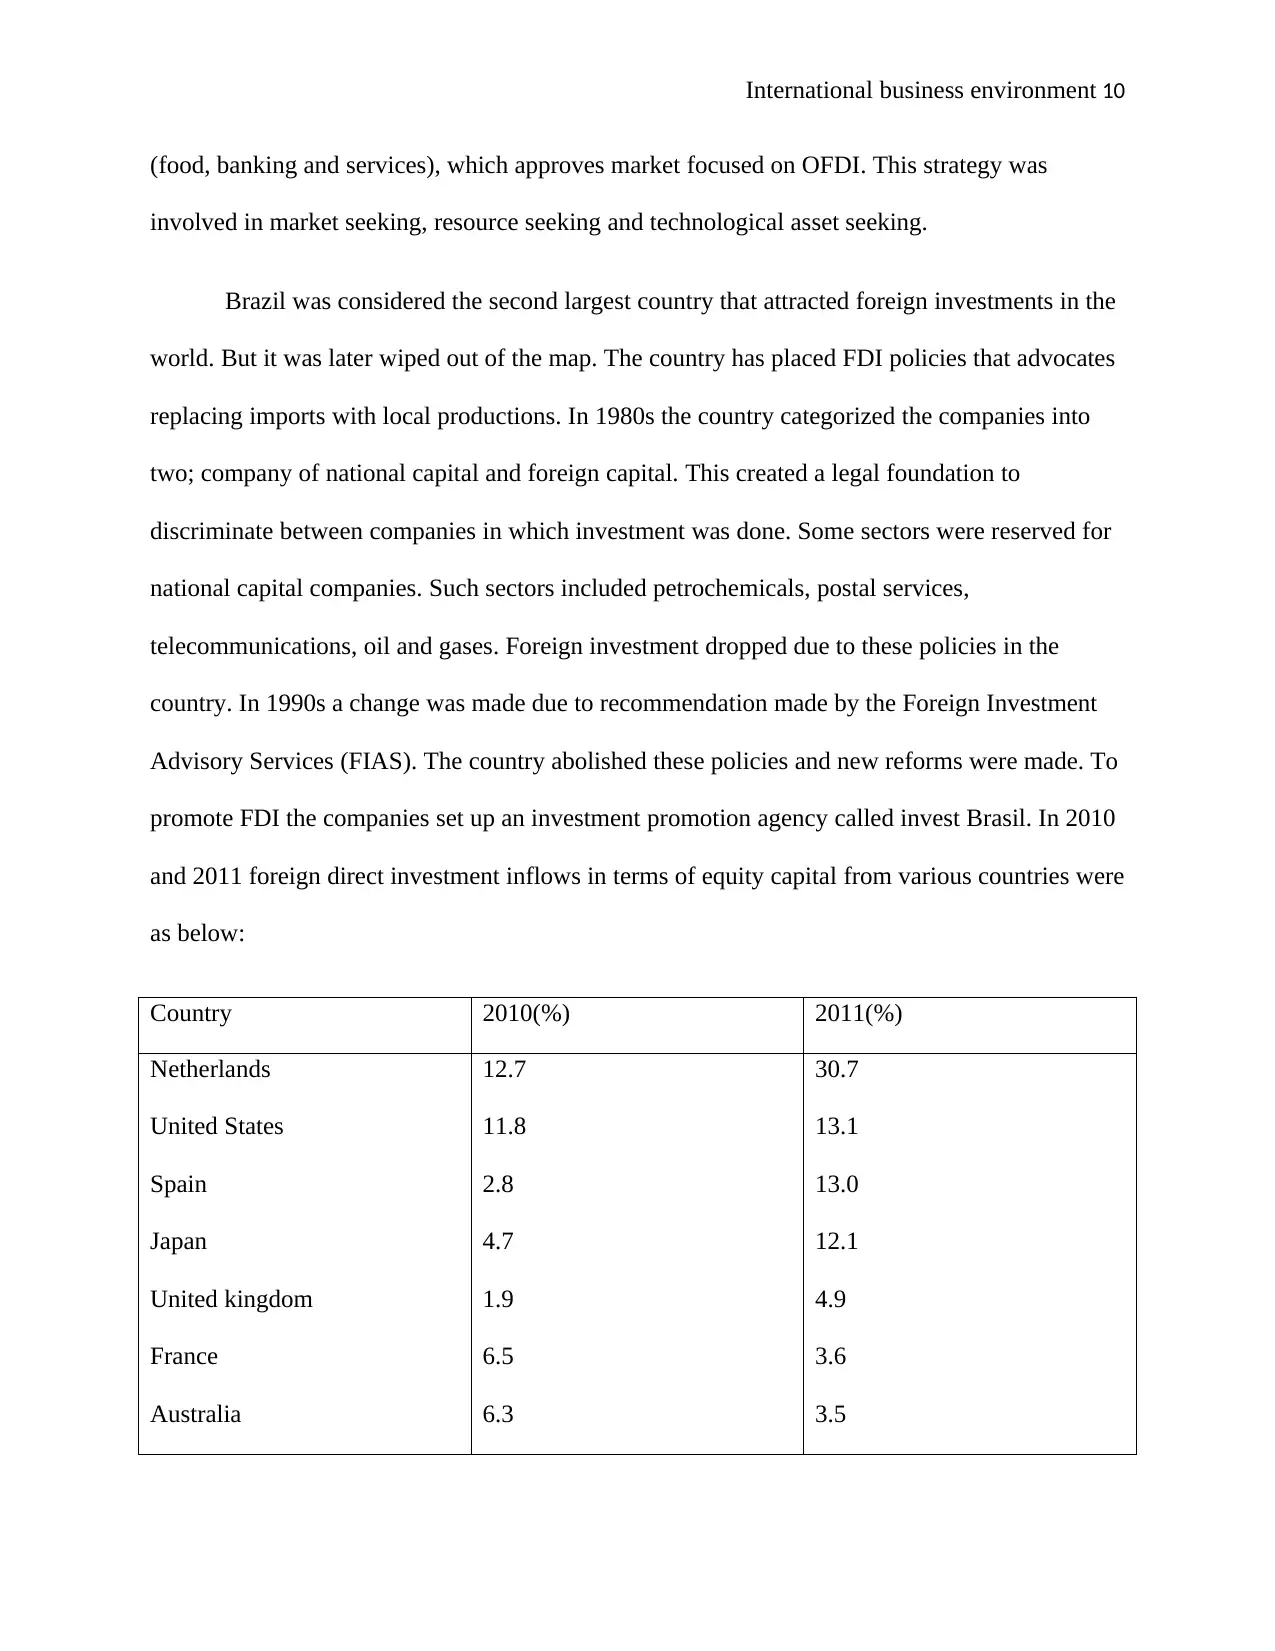
(food, banking and services), which approves market focused on OFDI. This strategy was
involved in market seeking, resource seeking and technological asset seeking.
Brazil was considered the second largest country that attracted foreign investments in the
world. But it was later wiped out of the map. The country has placed FDI policies that advocates
replacing imports with local productions. In 1980s the country categorized the companies into
two; company of national capital and foreign capital. This created a legal foundation to
discriminate between companies in which investment was done. Some sectors were reserved for
national capital companies. Such sectors included petrochemicals, postal services,
telecommunications, oil and gases. Foreign investment dropped due to these policies in the
country. In 1990s a change was made due to recommendation made by the Foreign Investment
Advisory Services (FIAS). The country abolished these policies and new reforms were made. To
promote FDI the companies set up an investment promotion agency called invest Brasil. In 2010
and 2011 foreign direct investment inflows in terms of equity capital from various countries were
as below:
Country 2010(%) 2011(%)
Netherlands
United States
Spain
Japan
United kingdom
France
Australia
12.7
11.8
2.8
4.7
1.9
6.5
6.3
30.7
13.1
13.0
12.1
4.9
3.6
3.5
Paraphrase This Document
Need a fresh take? Get an instant paraphrase of this document with our AI Paraphraser
International business environment 11
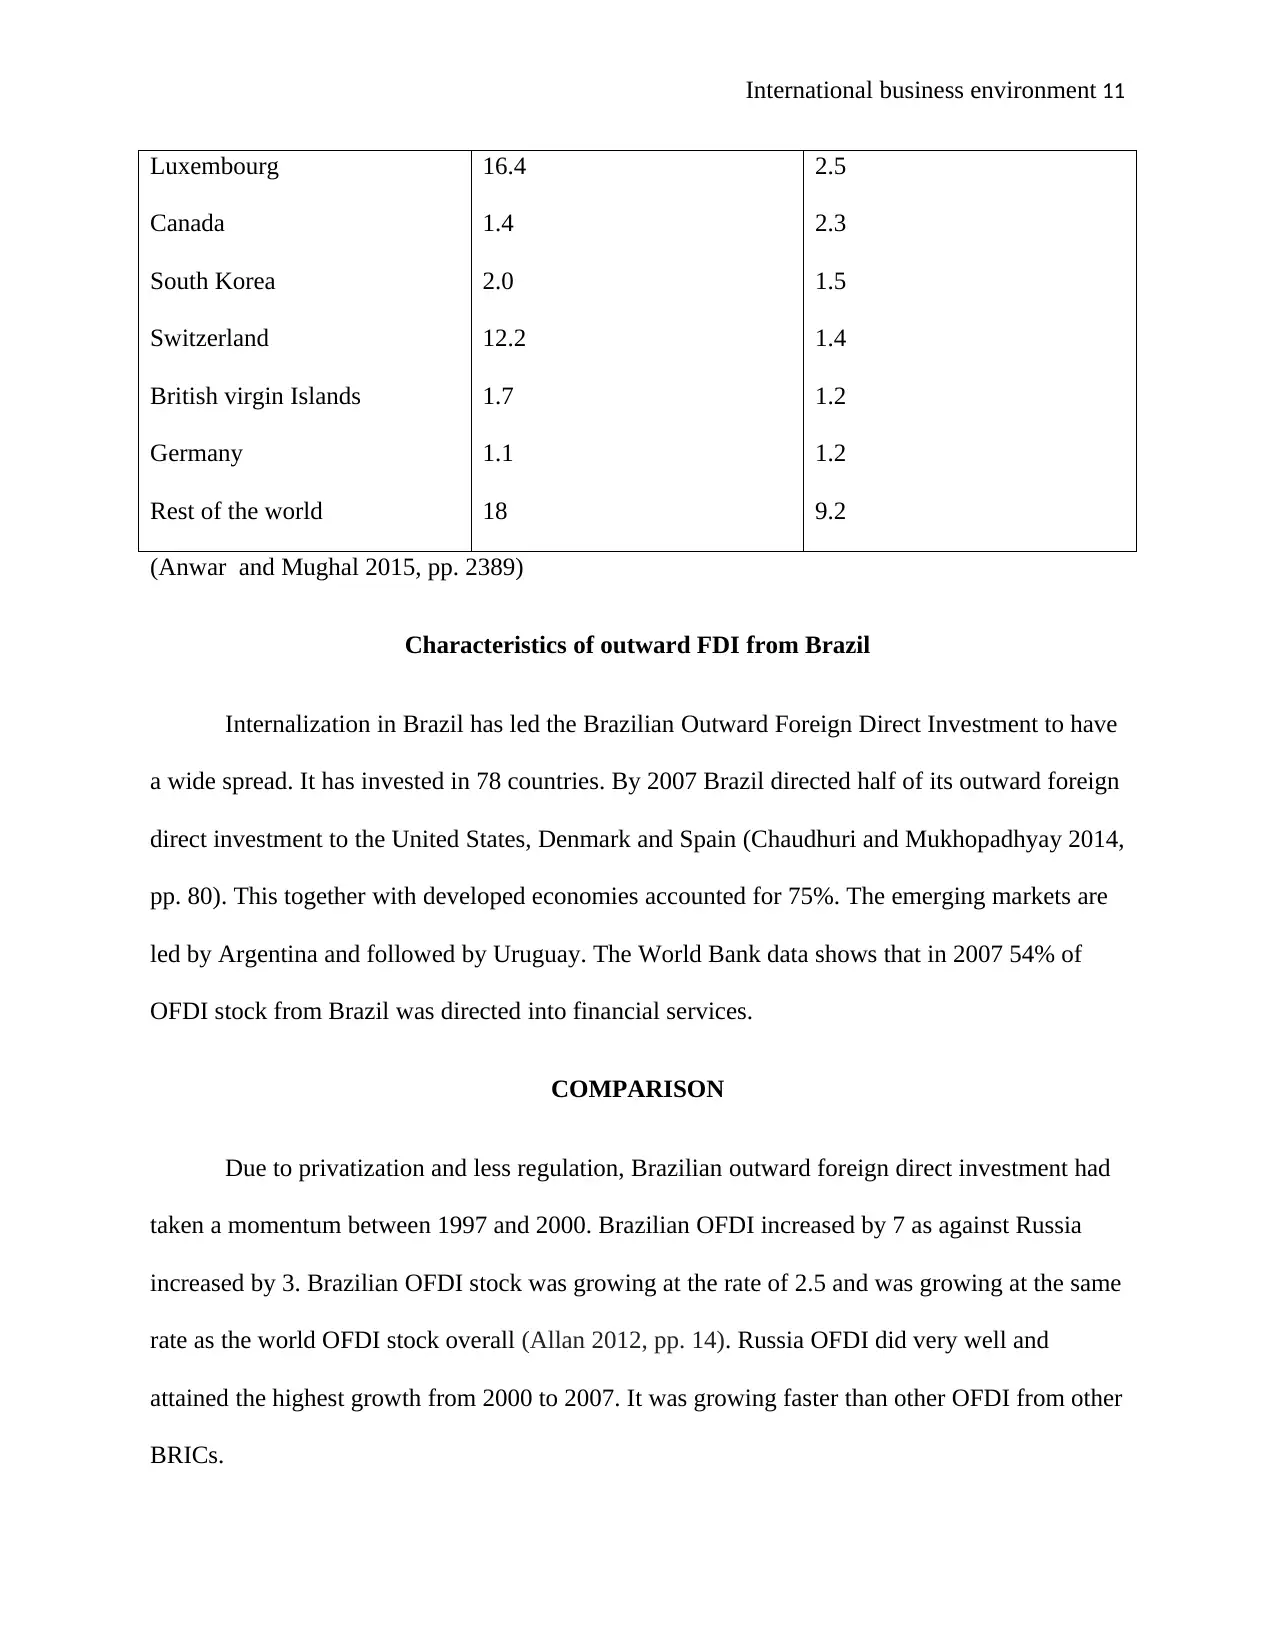
Luxembourg
Canada
South Korea
Switzerland
British virgin Islands
Germany
Rest of the world
16.4
1.4
2.0
12.2
1.7
1.1
18
2.5
2.3
1.5
1.4
1.2
1.2
9.2
(Anwar and Mughal 2015, pp. 2389)
Characteristics of outward FDI from Brazil
Internalization in Brazil has led the Brazilian Outward Foreign Direct Investment to have
a wide spread. It has invested in 78 countries. By 2007 Brazil directed half of its outward foreign
direct investment to the United States, Denmark and Spain (Chaudhuri and Mukhopadhyay 2014,
pp. 80). This together with developed economies accounted for 75%. The emerging markets are
led by Argentina and followed by Uruguay. The World Bank data shows that in 2007 54% of
OFDI stock from Brazil was directed into financial services.
COMPARISON
Due to privatization and less regulation, Brazilian outward foreign direct investment had
taken a momentum between 1997 and 2000. Brazilian OFDI increased by 7 as against Russia
increased by 3. Brazilian OFDI stock was growing at the rate of 2.5 and was growing at the same
rate as the world OFDI stock overall (Allan 2012, pp. 14). Russia OFDI did very well and
attained the highest growth from 2000 to 2007. It was growing faster than other OFDI from other
BRICs.
International business environment 12
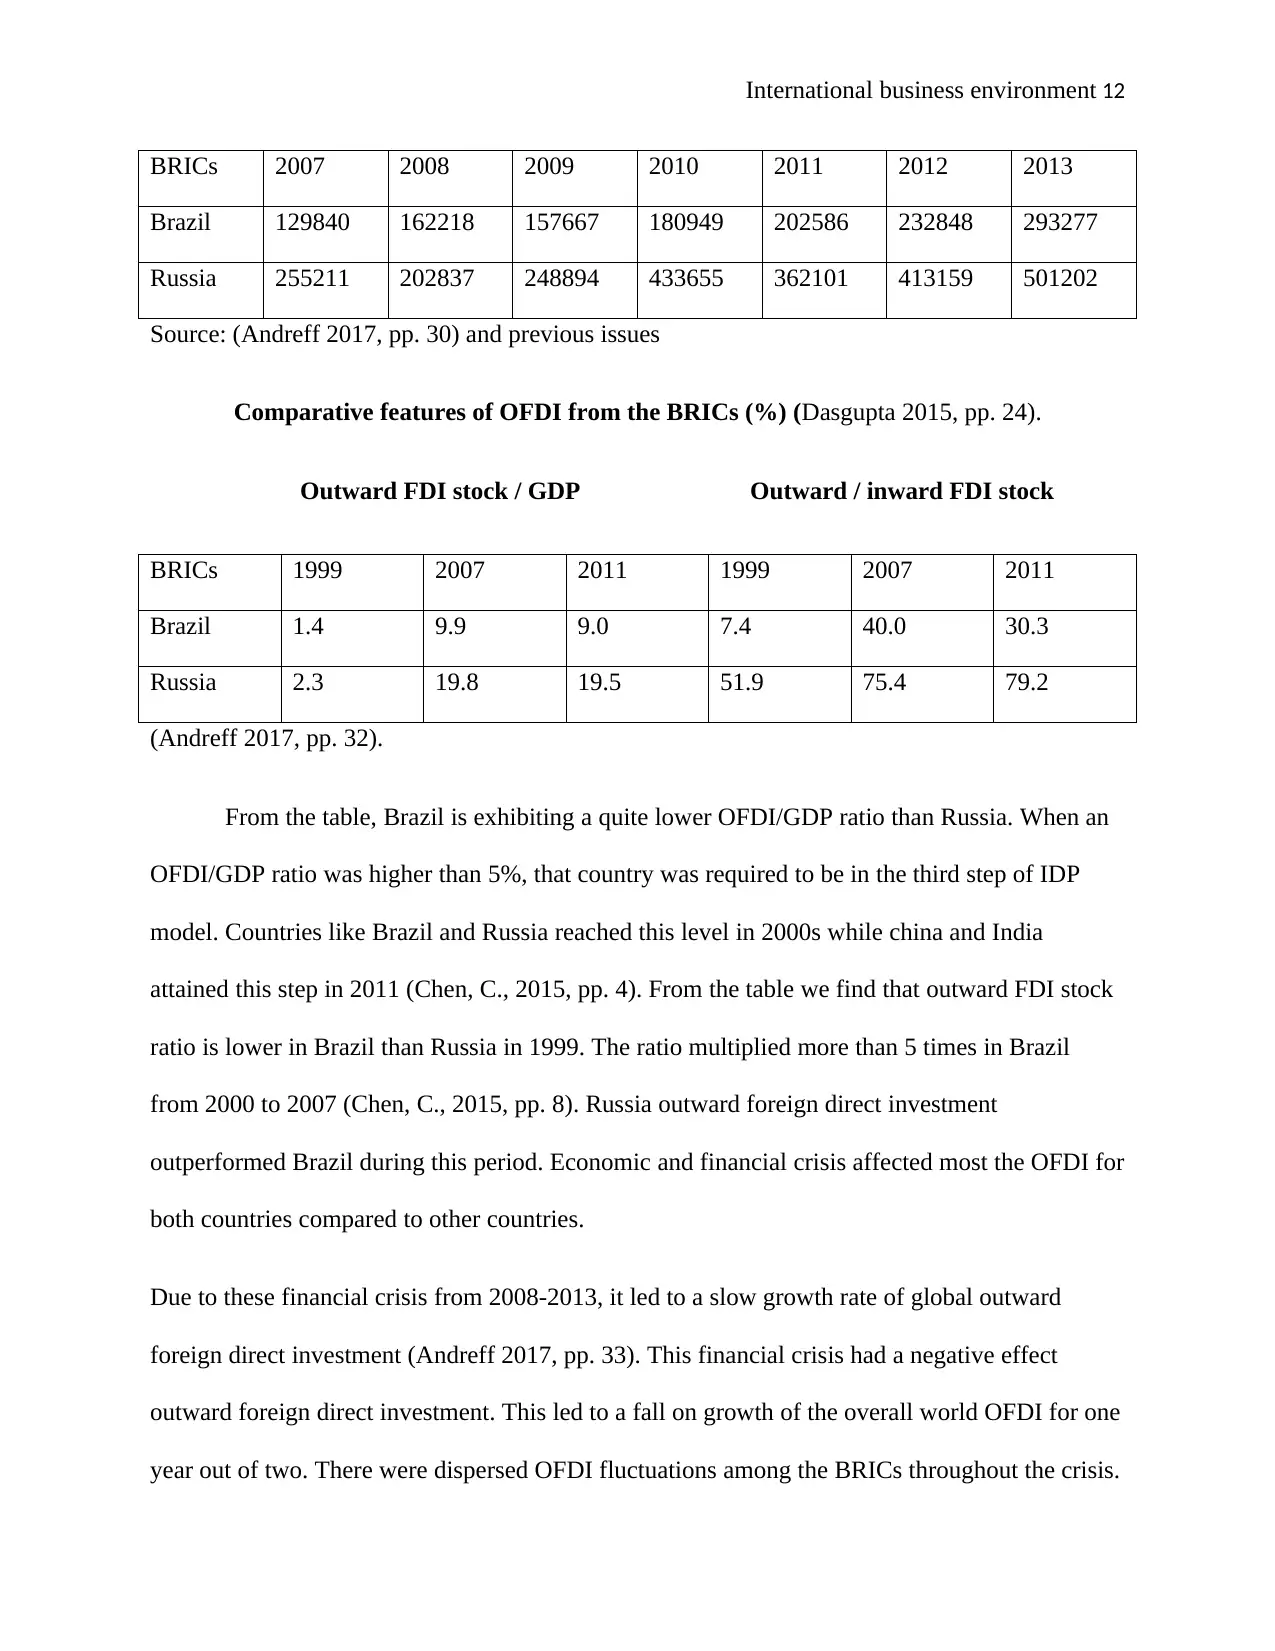
BRICs 2007 2008 2009 2010 2011 2012 2013
Brazil 129840 162218 157667 180949 202586 232848 293277
Russia 255211 202837 248894 433655 362101 413159 501202
Source: (Andreff 2017, pp. 30) and previous issues
Comparative features of OFDI from the BRICs (%) (Dasgupta 2015, pp. 24).
Outward FDI stock / GDP Outward / inward FDI stock
BRICs 1999 2007 2011 1999 2007 2011
Brazil 1.4 9.9 9.0 7.4 40.0 30.3
Russia 2.3 19.8 19.5 51.9 75.4 79.2
(Andreff 2017, pp. 32).
From the table, Brazil is exhibiting a quite lower OFDI/GDP ratio than Russia. When an
OFDI/GDP ratio was higher than 5%, that country was required to be in the third step of IDP
model. Countries like Brazil and Russia reached this level in 2000s while china and India
attained this step in 2011 (Chen, C., 2015, pp. 4). From the table we find that outward FDI stock
ratio is lower in Brazil than Russia in 1999. The ratio multiplied more than 5 times in Brazil
from 2000 to 2007 (Chen, C., 2015, pp. 8). Russia outward foreign direct investment
outperformed Brazil during this period. Economic and financial crisis affected most the OFDI for
both countries compared to other countries.
Due to these financial crisis from 2008-2013, it led to a slow growth rate of global outward
foreign direct investment (Andreff 2017, pp. 33). This financial crisis had a negative effect
outward foreign direct investment. This led to a fall on growth of the overall world OFDI for one
year out of two. There were dispersed OFDI fluctuations among the BRICs throughout the crisis.
⊘ This is a preview!⊘
Do you want full access?
Subscribe today to unlock all pages.
Trusted by 1+ million students worldwide
1 out of 32
Related Documents


Your All-in-One AI-Powered Toolkit for Academic Success.
+13062052269
info@desklib.com
Available 24*7 on WhatsApp / Email
![[object Object]](/_next/static/media/star-bottom.7253800d.svg)
Unlock your academic potential
Copyright © 2020–2026 A2Z Services. All Rights Reserved. Developed and managed by ZUCOL.