Financial Management: Project Appraisal and Investment Analysis
VerifiedAdded on 2022/12/05
|15
|3245
|115
Report
AI Summary
This report delves into the core concepts of international financial management, emphasizing project appraisal techniques and investment decision-making. It begins with an introduction to the field, highlighting the importance of wealth maximization in a global context. The report then proceeds to analyze various financial scenarios, calculating the expected net present value (NPV) and standard deviation (SD) of different projects. It evaluates the financial viability of projects under optimistic, pessimistic, and realistic forecasts, providing insights into the probabilities of different outcomes, including the risk of liquidation. Furthermore, the report compares and contrasts the NPV and internal rate of return (IRR) methods, arguing for the superiority of NPV in project appraisal. Finally, the report ranks multiple projects based on their NPVs, offering recommendations for optimal fund allocation and investment strategies. The analysis includes detailed calculations, interpretations, and conclusions, providing a comprehensive understanding of the financial management principles discussed.

INTERNATIONAL
FINANCIAL
MANAGEMENT
FINANCIAL
MANAGEMENT
Paraphrase This Document
Need a fresh take? Get an instant paraphrase of this document with our AI Paraphraser
TABLE OF CONTENTS
INTRODUCTION...........................................................................................................................3
QUESTION 1...................................................................................................................................3
a. The expected net present value...............................................................................................3
b. Standard deviation of net present value..................................................................................4
QUESTION 2...................................................................................................................................5
a. Calculation of expected NPV and SD of NPV........................................................................5
b. Chances that event will turn out to be more worse and probability of avoiding liquidation. .7
c. In case NPV is greater than positive that is £100m and its probability of occurring..............8
QUESTION 3...................................................................................................................................8
a. NPV for every project and ranking all the projects.................................................................8
b. Reason behind undertaking NPV as a superior method of project appraisal other than
internal rate of return (IRR)......................................................................................................10
c. Calculation of wisest allocation of the funds in order to achieve the optimum return that
each project will provide...........................................................................................................10
d. Calculation of probability of the product producing a negative NPV..................................11
CONCLUSION..............................................................................................................................13
REFERENCES..............................................................................................................................14
INTRODUCTION
International financial management is referred to as the management of the finance
within the international environment wherein trading and business is being undertaken in foreign
currency. The major aim of undertaking effective international financial management is wealth
maximisation. This is pertaining to the fact that when the finance will be managed in effective
and efficient manner then this will result in effective management of the finance all over the
globe. There are many aspect related to international financial management like the political risk,
foreign exchange, market imperfection and the enhanced opportunity set. The present report will
outline that how the different project appraisal techniques in order to evaluate which project is
better in investing and which is not. In addition to this the different between NPV and IRR will
also be highlighted along with calculation which is helpful in taking decision relating to
investment.
QUESTION 1
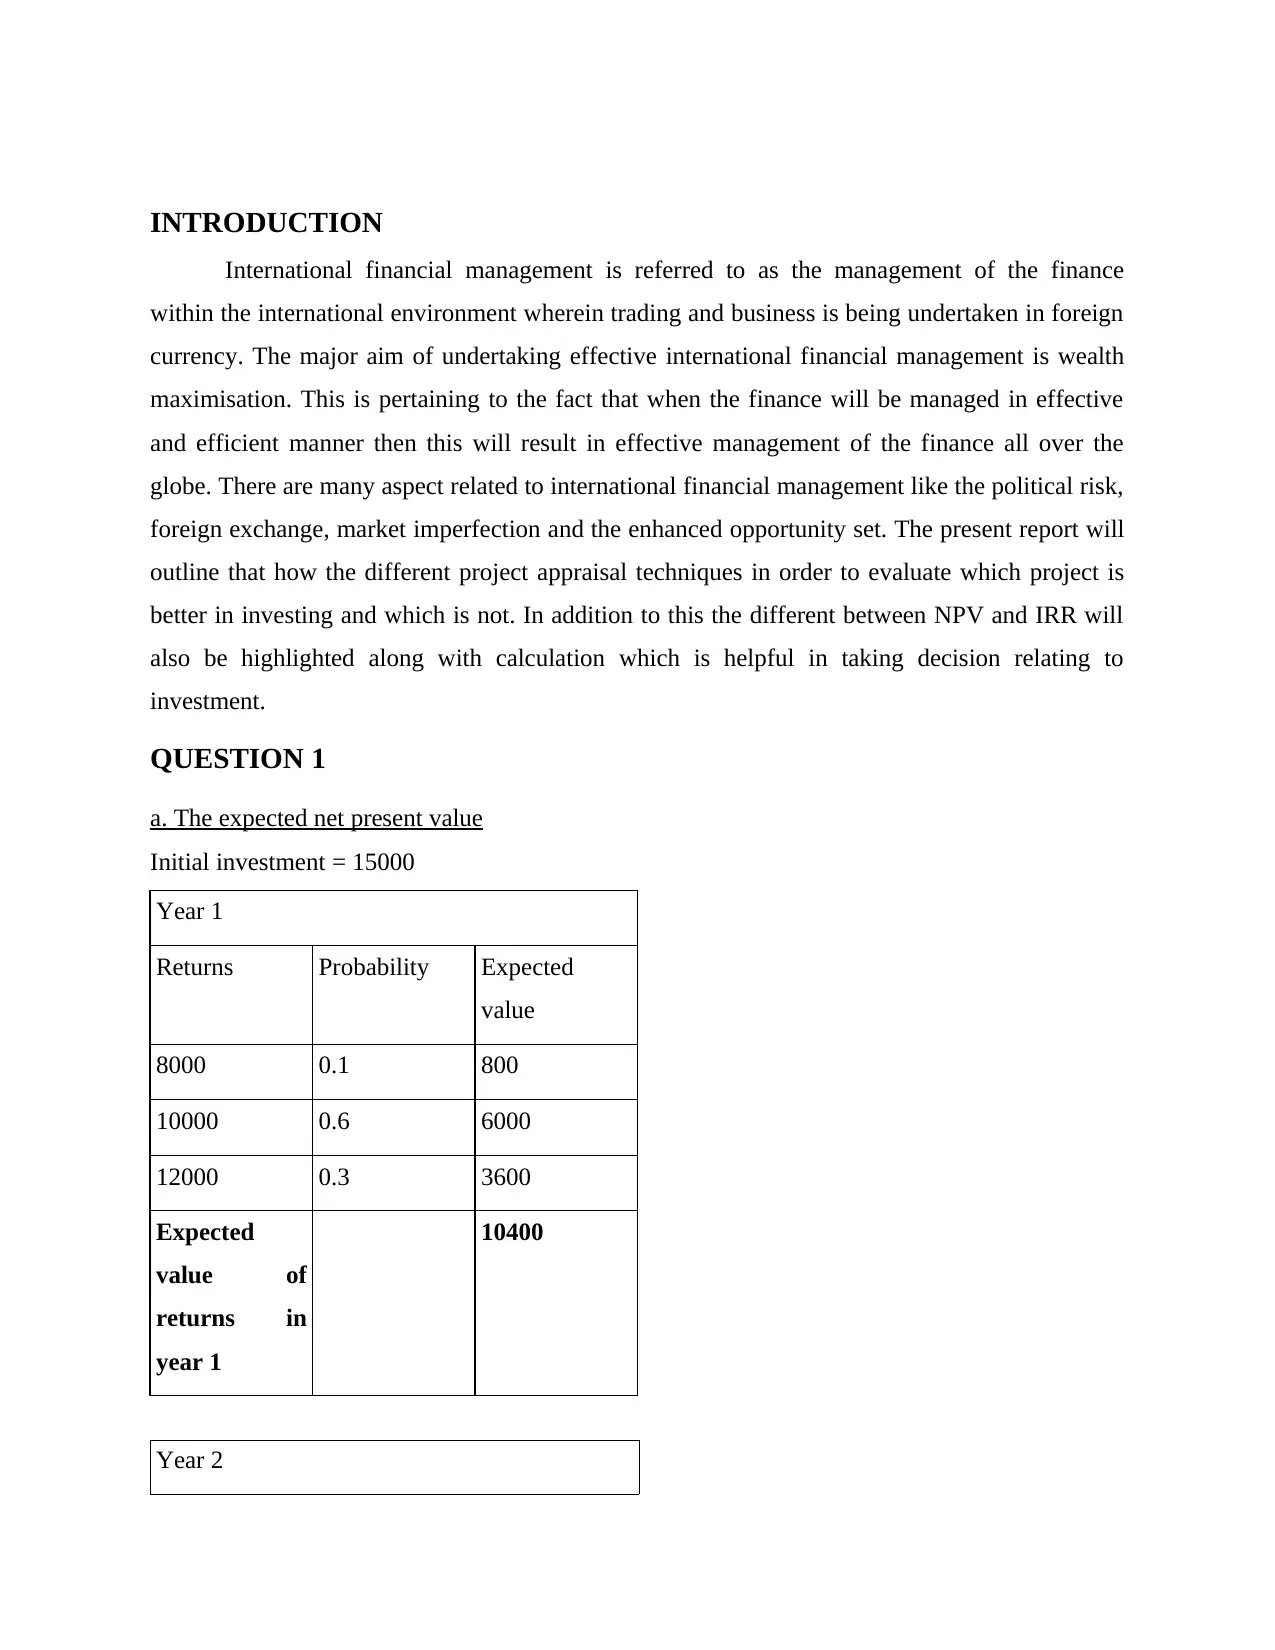
a. The expected net present value
Initial investment = 15000
Year 1
Returns Probability Expected
value
8000 0.1 800
10000 0.6 6000
12000 0.3 3600
Expected
value of
returns in
year 1
10400
Year 2
International financial management is referred to as the management of the finance
within the international environment wherein trading and business is being undertaken in foreign
currency. The major aim of undertaking effective international financial management is wealth
maximisation. This is pertaining to the fact that when the finance will be managed in effective
and efficient manner then this will result in effective management of the finance all over the
globe. There are many aspect related to international financial management like the political risk,
foreign exchange, market imperfection and the enhanced opportunity set. The present report will
outline that how the different project appraisal techniques in order to evaluate which project is
better in investing and which is not. In addition to this the different between NPV and IRR will
also be highlighted along with calculation which is helpful in taking decision relating to
investment.
QUESTION 1
a. The expected net present value
Initial investment = 15000
Year 1
Returns Probability Expected
value
8000 0.1 800
10000 0.6 6000
12000 0.3 3600
Expected
value of
returns in
year 1
10400
Year 2
⊘ This is a preview!⊘
Do you want full access?
Subscribe today to unlock all pages.
Trusted by 1+ million students worldwide
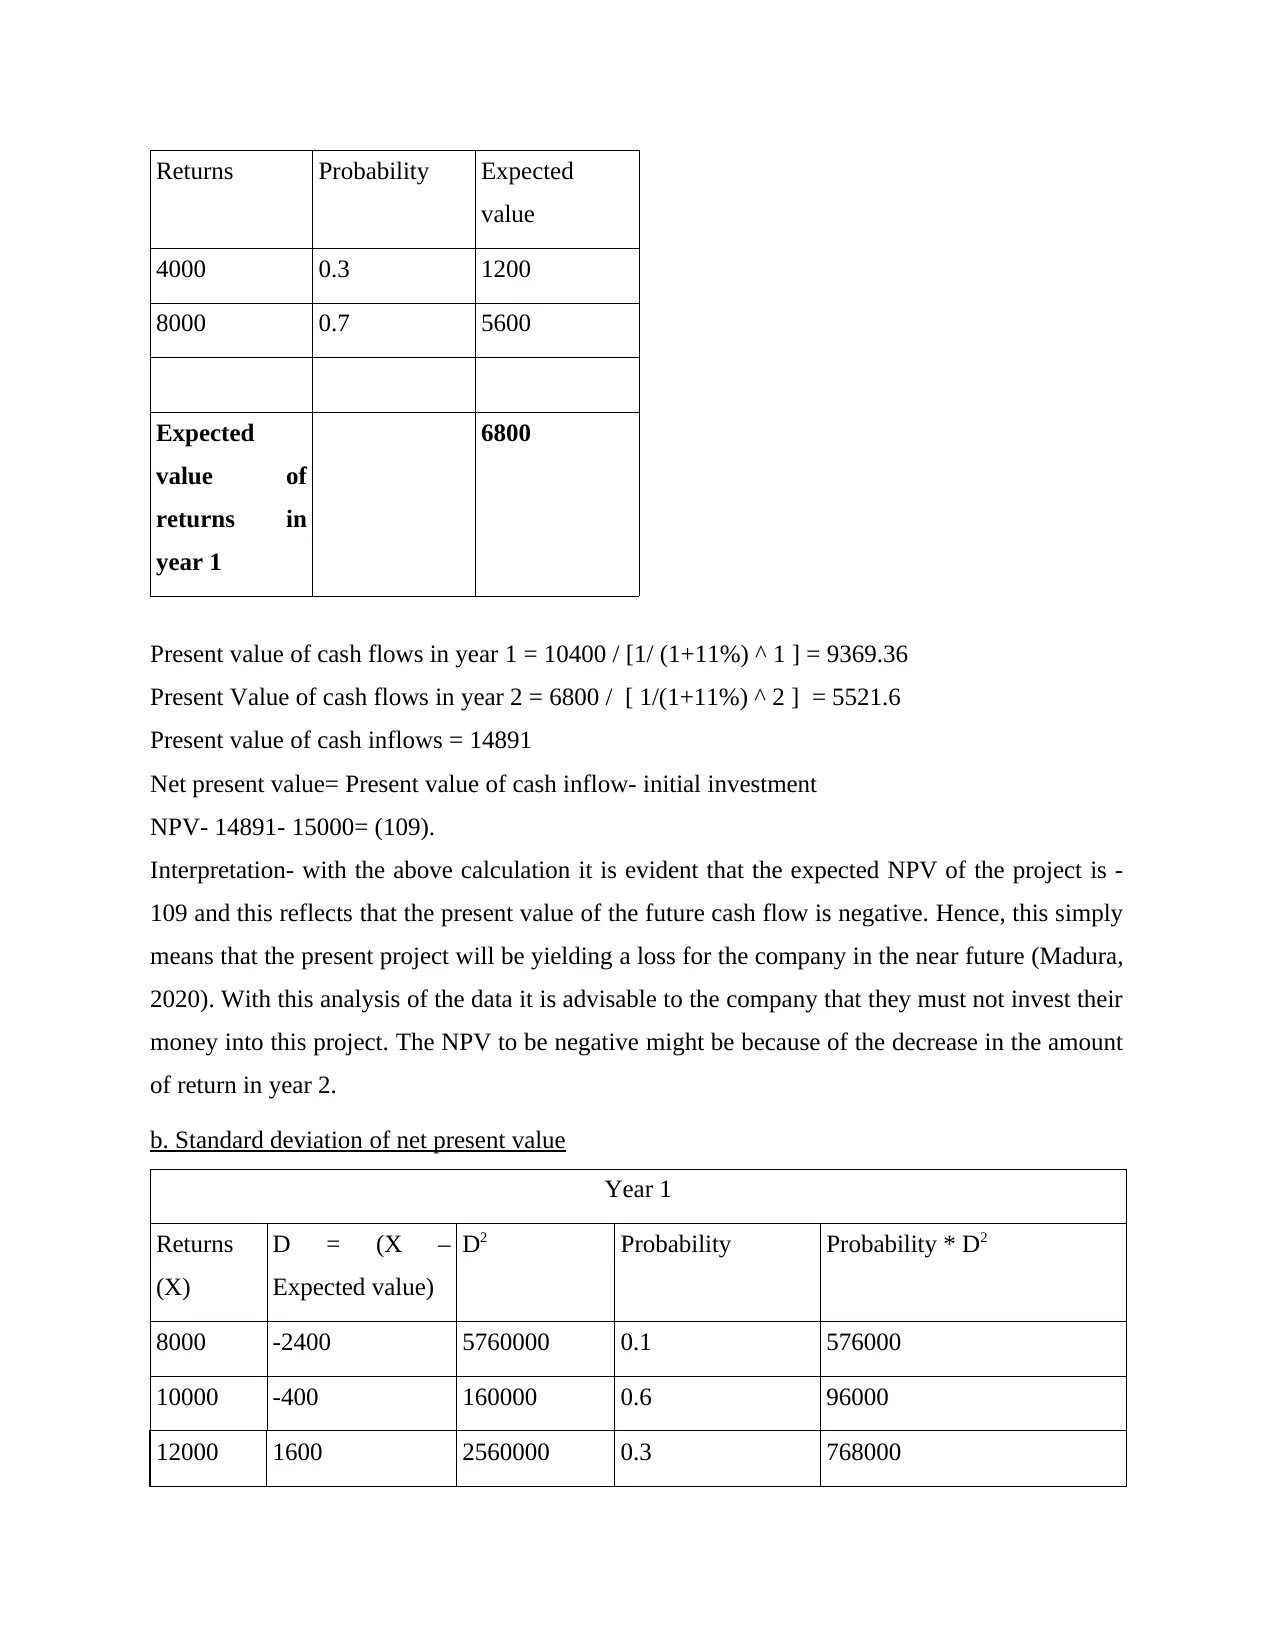
Returns Probability Expected
value
4000 0.3 1200
8000 0.7 5600
Expected
value of
returns in
year 1
6800
Present value of cash flows in year 1 = 10400 / [1/ (1+11%) ^ 1 ] = 9369.36
Present Value of cash flows in year 2 = 6800 / [ 1/(1+11%) ^ 2 ] = 5521.6
Present value of cash inflows = 14891
Net present value= Present value of cash inflow- initial investment
NPV- 14891- 15000= (109).
Interpretation- with the above calculation it is evident that the expected NPV of the project is -
109 and this reflects that the present value of the future cash flow is negative. Hence, this simply
means that the present project will be yielding a loss for the company in the near future (Madura,
2020). With this analysis of the data it is advisable to the company that they must not invest their
money into this project. The NPV to be negative might be because of the decrease in the amount
of return in year 2.
b. Standard deviation of net present value
Year 1
Returns
(X)
D = (X –
Expected value)
D2 Probability Probability * D2
8000 -2400 5760000 0.1 576000
10000 -400 160000 0.6 96000
12000 1600 2560000 0.3 768000
Paraphrase This Document
Need a fresh take? Get an instant paraphrase of this document with our AI Paraphraser
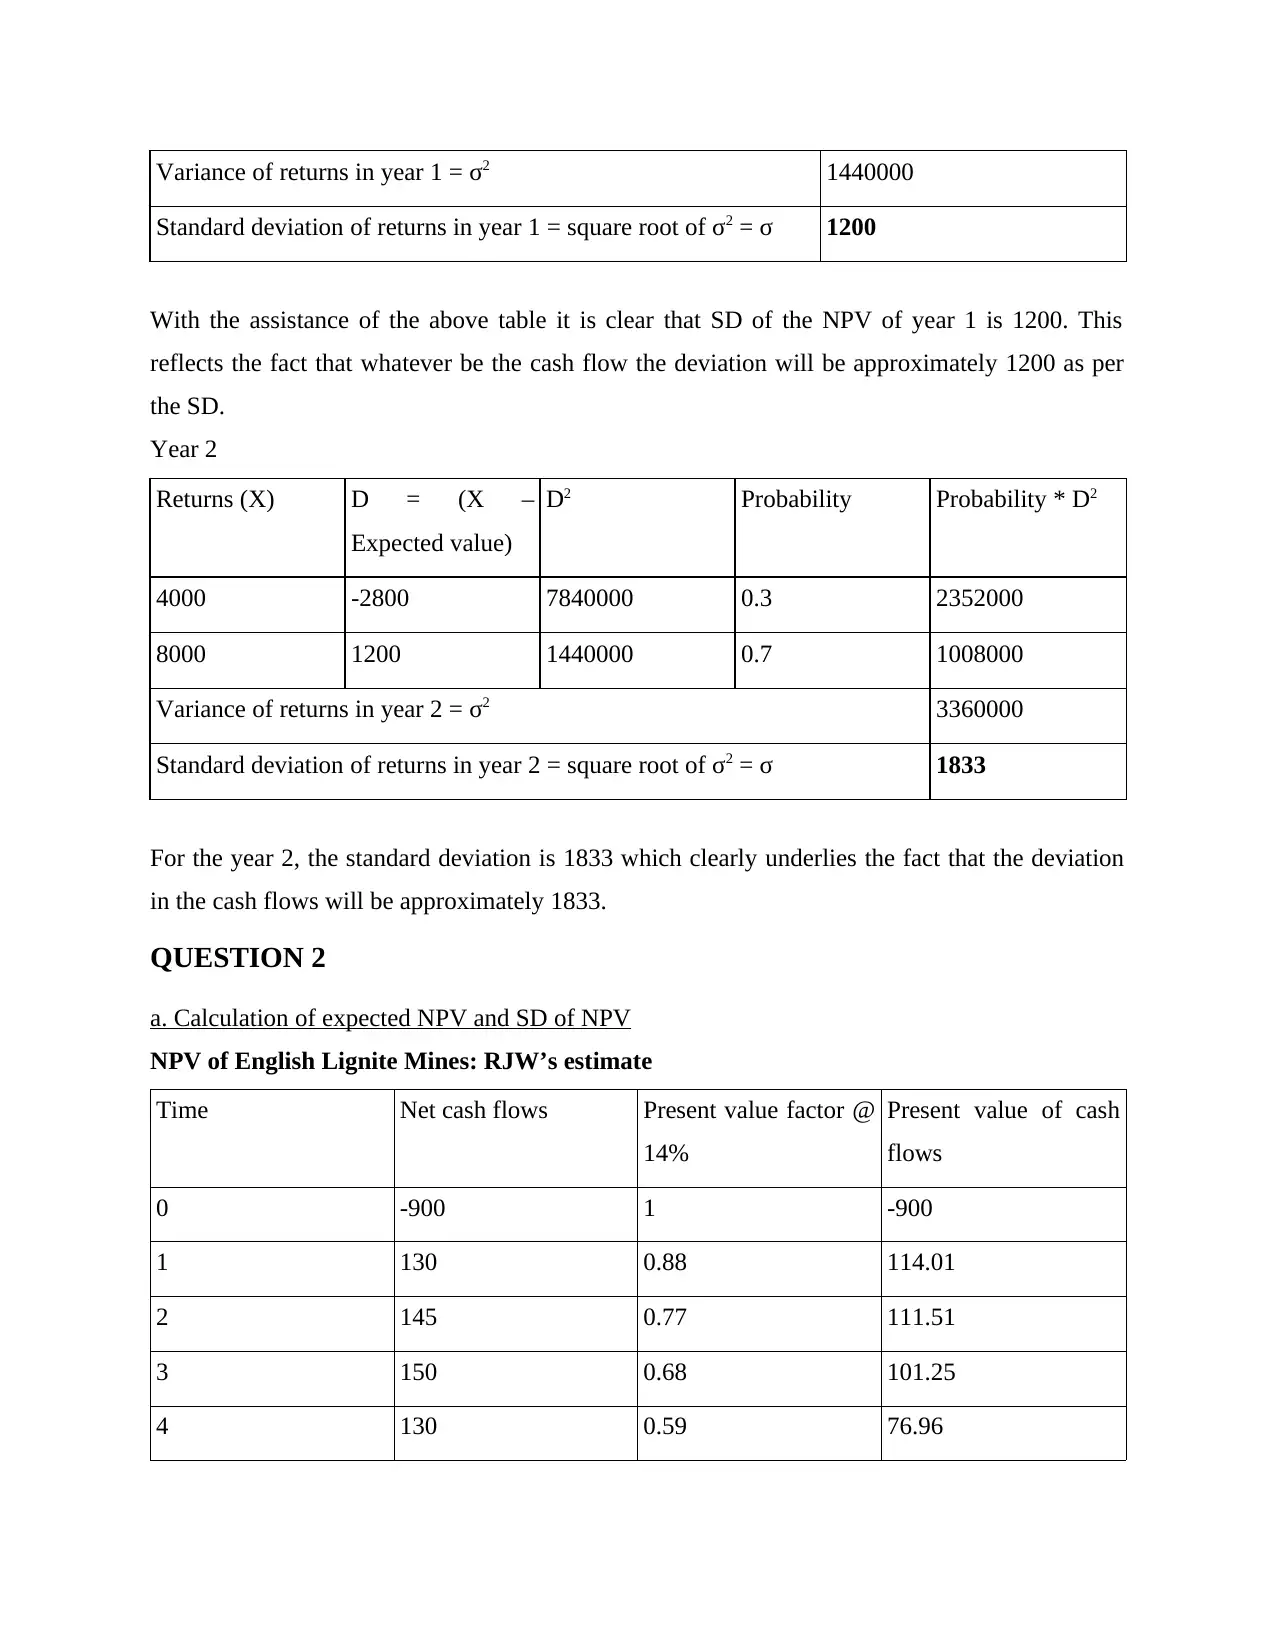
Variance of returns in year 1 = σ2 1440000
Standard deviation of returns in year 1 = square root of σ2 = σ 1200
With the assistance of the above table it is clear that SD of the NPV of year 1 is 1200. This
reflects the fact that whatever be the cash flow the deviation will be approximately 1200 as per
the SD.
Year 2
Returns (X) D = (X –
Expected value)
D2 Probability Probability * D2
4000 -2800 7840000 0.3 2352000
8000 1200 1440000 0.7 1008000
Variance of returns in year 2 = σ2 3360000
Standard deviation of returns in year 2 = square root of σ2 = σ 1833
For the year 2, the standard deviation is 1833 which clearly underlies the fact that the deviation
in the cash flows will be approximately 1833.
QUESTION 2
a. Calculation of expected NPV and SD of NPV
NPV of English Lignite Mines: RJW’s estimate
Time Net cash flows Present value factor @
14%
Present value of cash
flows
0 -900 1 -900
1 130 0.88 114.01
2 145 0.77 111.51
3 150 0.68 101.25
4 130 0.59 76.96
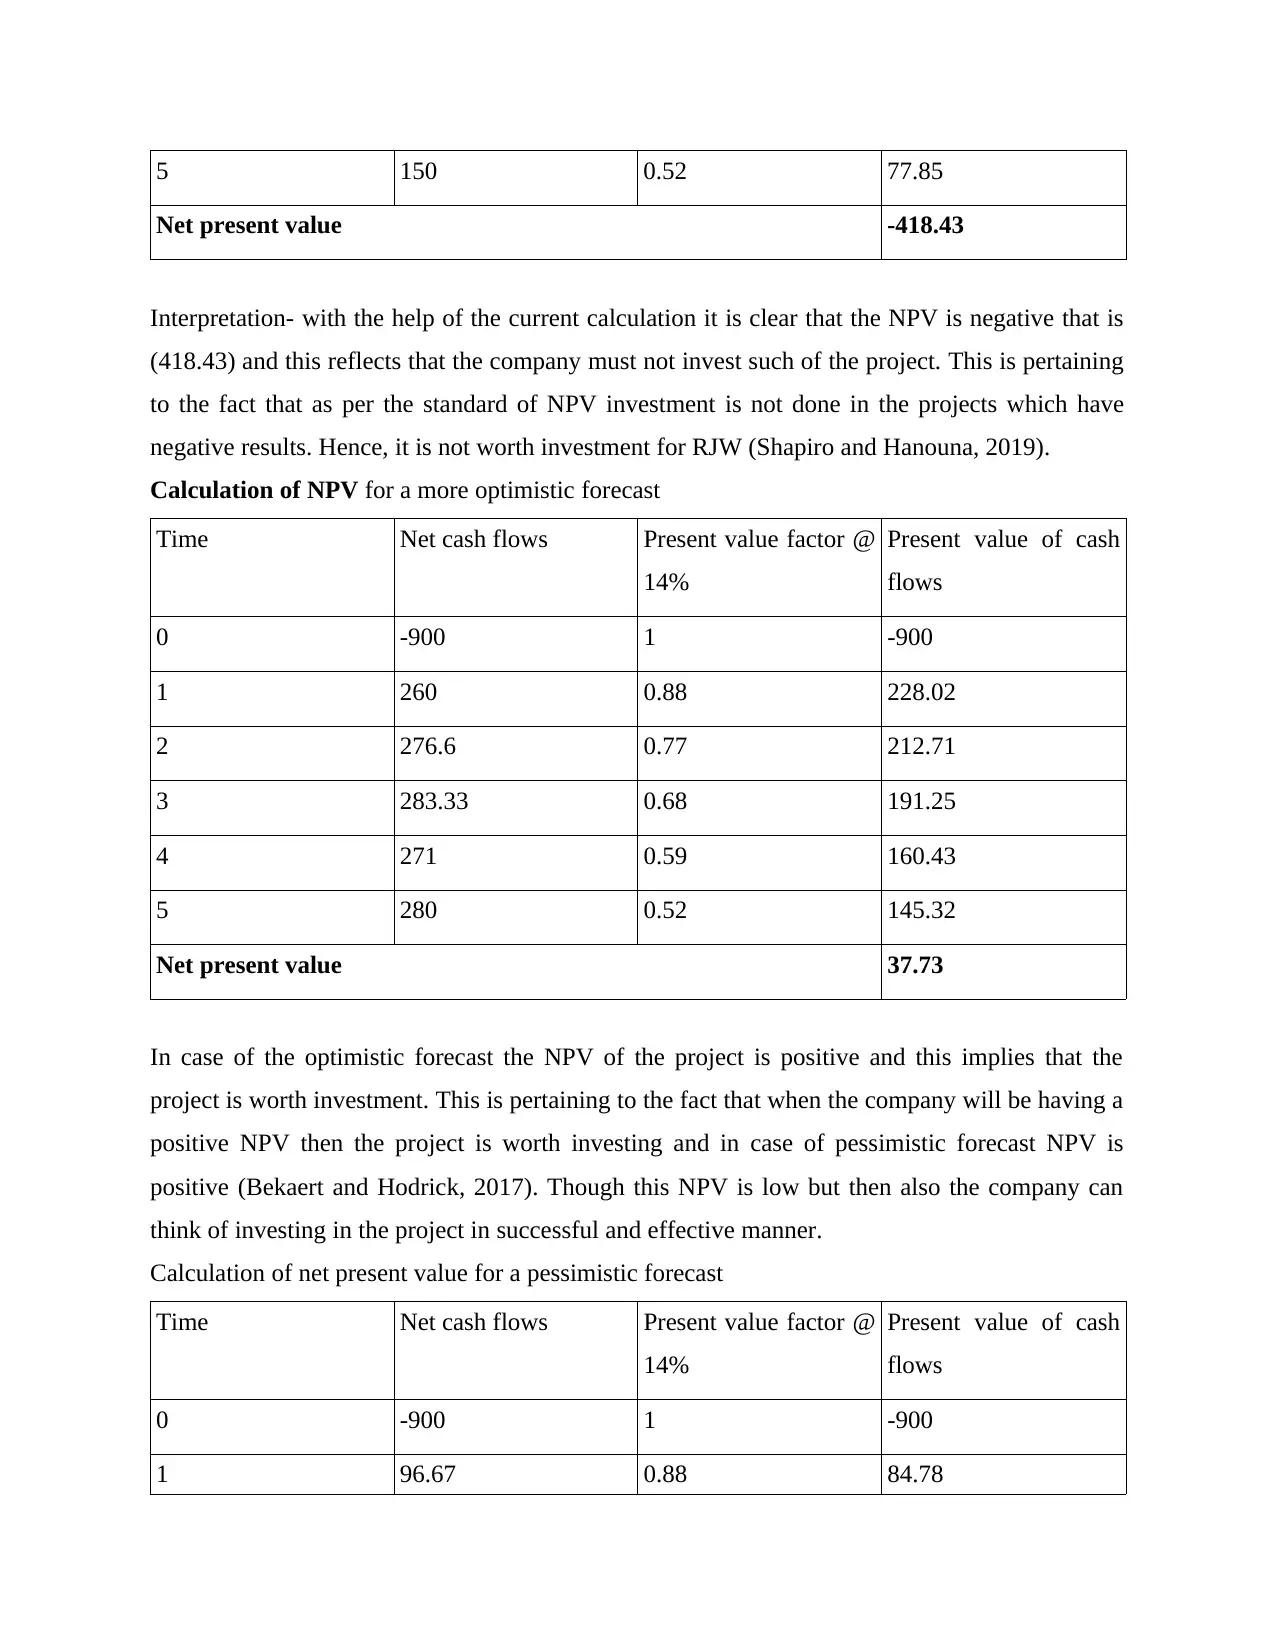
5 150 0.52 77.85
Net present value -418.43
Interpretation- with the help of the current calculation it is clear that the NPV is negative that is
(418.43) and this reflects that the company must not invest such of the project. This is pertaining
to the fact that as per the standard of NPV investment is not done in the projects which have
negative results. Hence, it is not worth investment for RJW (Shapiro and Hanouna, 2019).
Calculation of NPV for a more optimistic forecast
Time Net cash flows Present value factor @
14%
Present value of cash
flows
0 -900 1 -900
1 260 0.88 228.02
2 276.6 0.77 212.71
3 283.33 0.68 191.25
4 271 0.59 160.43
5 280 0.52 145.32
Net present value 37.73
In case of the optimistic forecast the NPV of the project is positive and this implies that the
project is worth investment. This is pertaining to the fact that when the company will be having a
positive NPV then the project is worth investing and in case of pessimistic forecast NPV is
positive (Bekaert and Hodrick, 2017). Though this NPV is low but then also the company can
think of investing in the project in successful and effective manner.
Calculation of net present value for a pessimistic forecast
Time Net cash flows Present value factor @
14%
Present value of cash
flows
0 -900 1 -900
1 96.67 0.88 84.78
⊘ This is a preview!⊘
Do you want full access?
Subscribe today to unlock all pages.
Trusted by 1+ million students worldwide
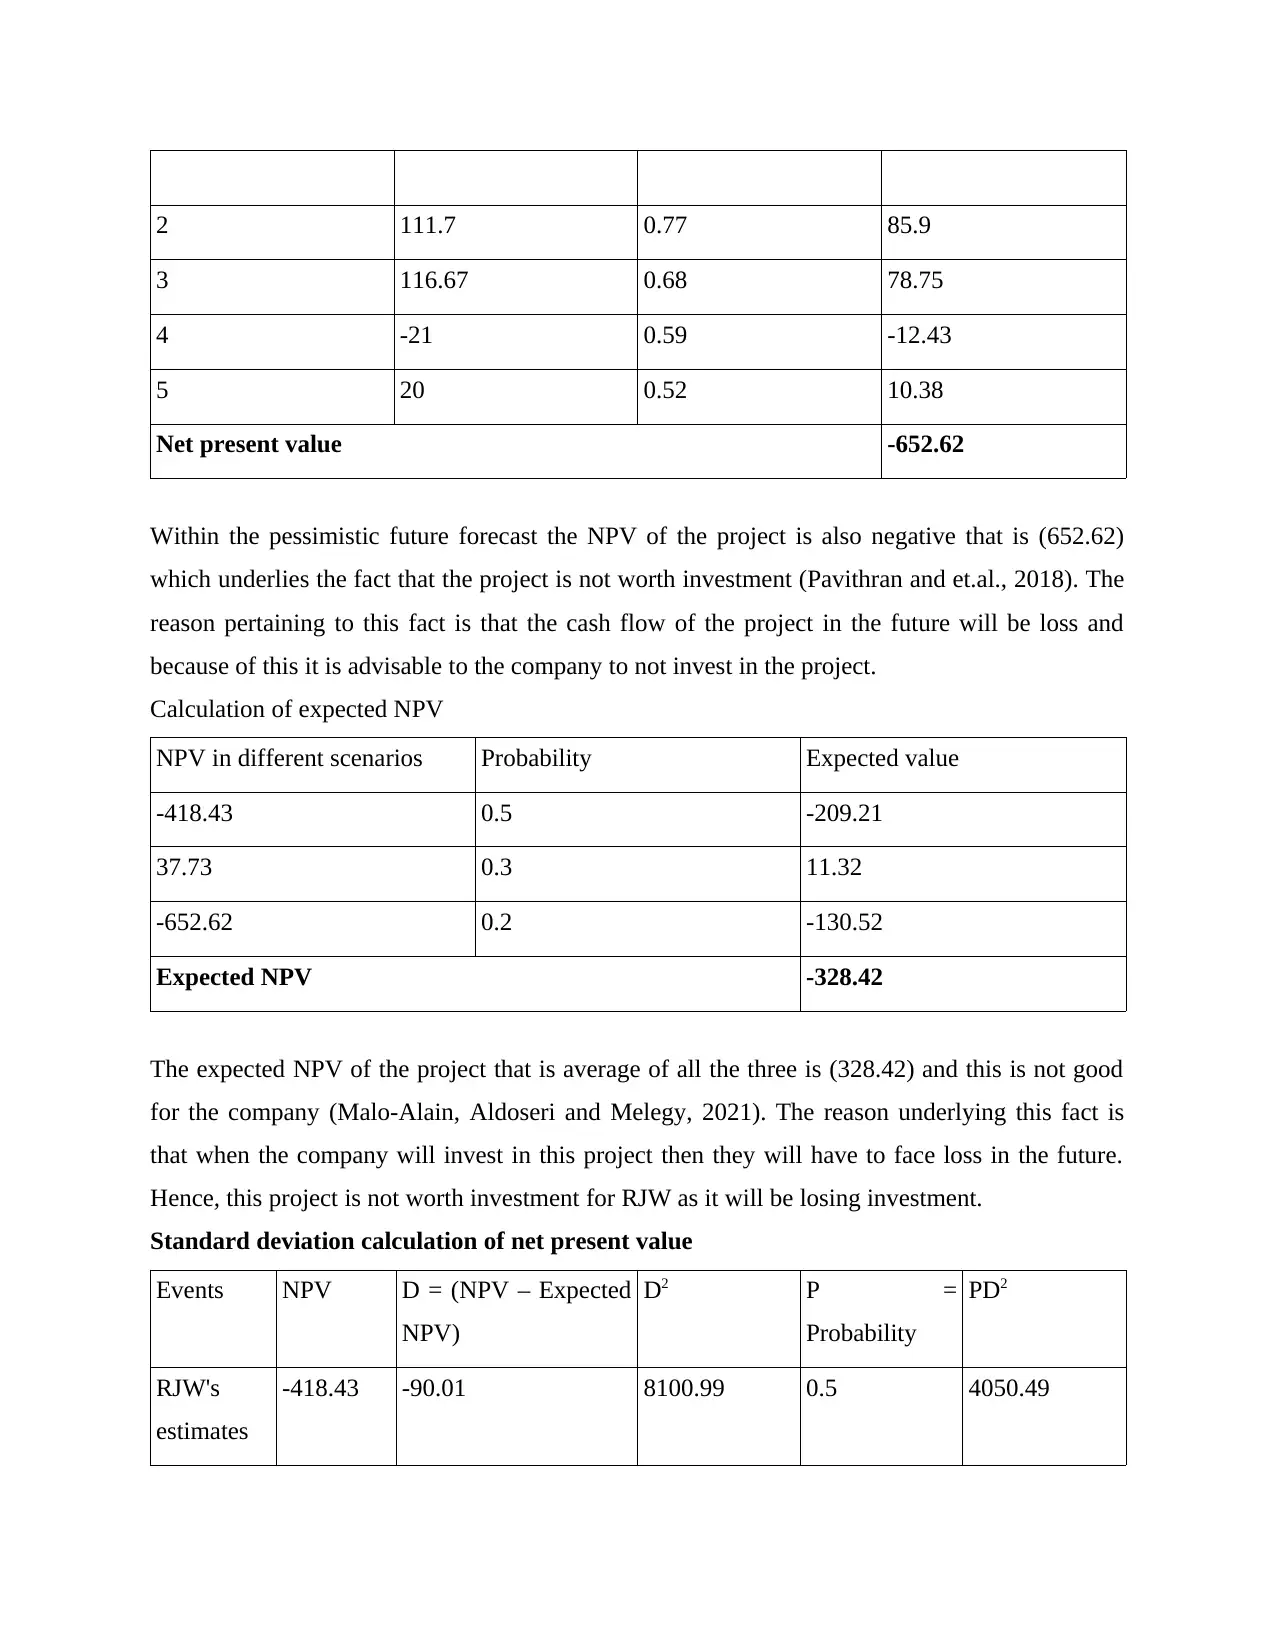
2 111.7 0.77 85.9
3 116.67 0.68 78.75
4 -21 0.59 -12.43
5 20 0.52 10.38
Net present value -652.62
Within the pessimistic future forecast the NPV of the project is also negative that is (652.62)
which underlies the fact that the project is not worth investment (Pavithran and et.al., 2018). The
reason pertaining to this fact is that the cash flow of the project in the future will be loss and
because of this it is advisable to the company to not invest in the project.
Calculation of expected NPV
NPV in different scenarios Probability Expected value
-418.43 0.5 -209.21
37.73 0.3 11.32
-652.62 0.2 -130.52
Expected NPV -328.42
The expected NPV of the project that is average of all the three is (328.42) and this is not good
for the company (Malo-Alain, Aldoseri and Melegy, 2021). The reason underlying this fact is
that when the company will invest in this project then they will have to face loss in the future.
Hence, this project is not worth investment for RJW as it will be losing investment.
Standard deviation calculation of net present value
Events NPV D = (NPV – Expected
NPV)
D2 P =
Probability
PD2
RJW's
estimates
-418.43 -90.01 8100.99 0.5 4050.49
Paraphrase This Document
Need a fresh take? Get an instant paraphrase of this document with our AI Paraphraser
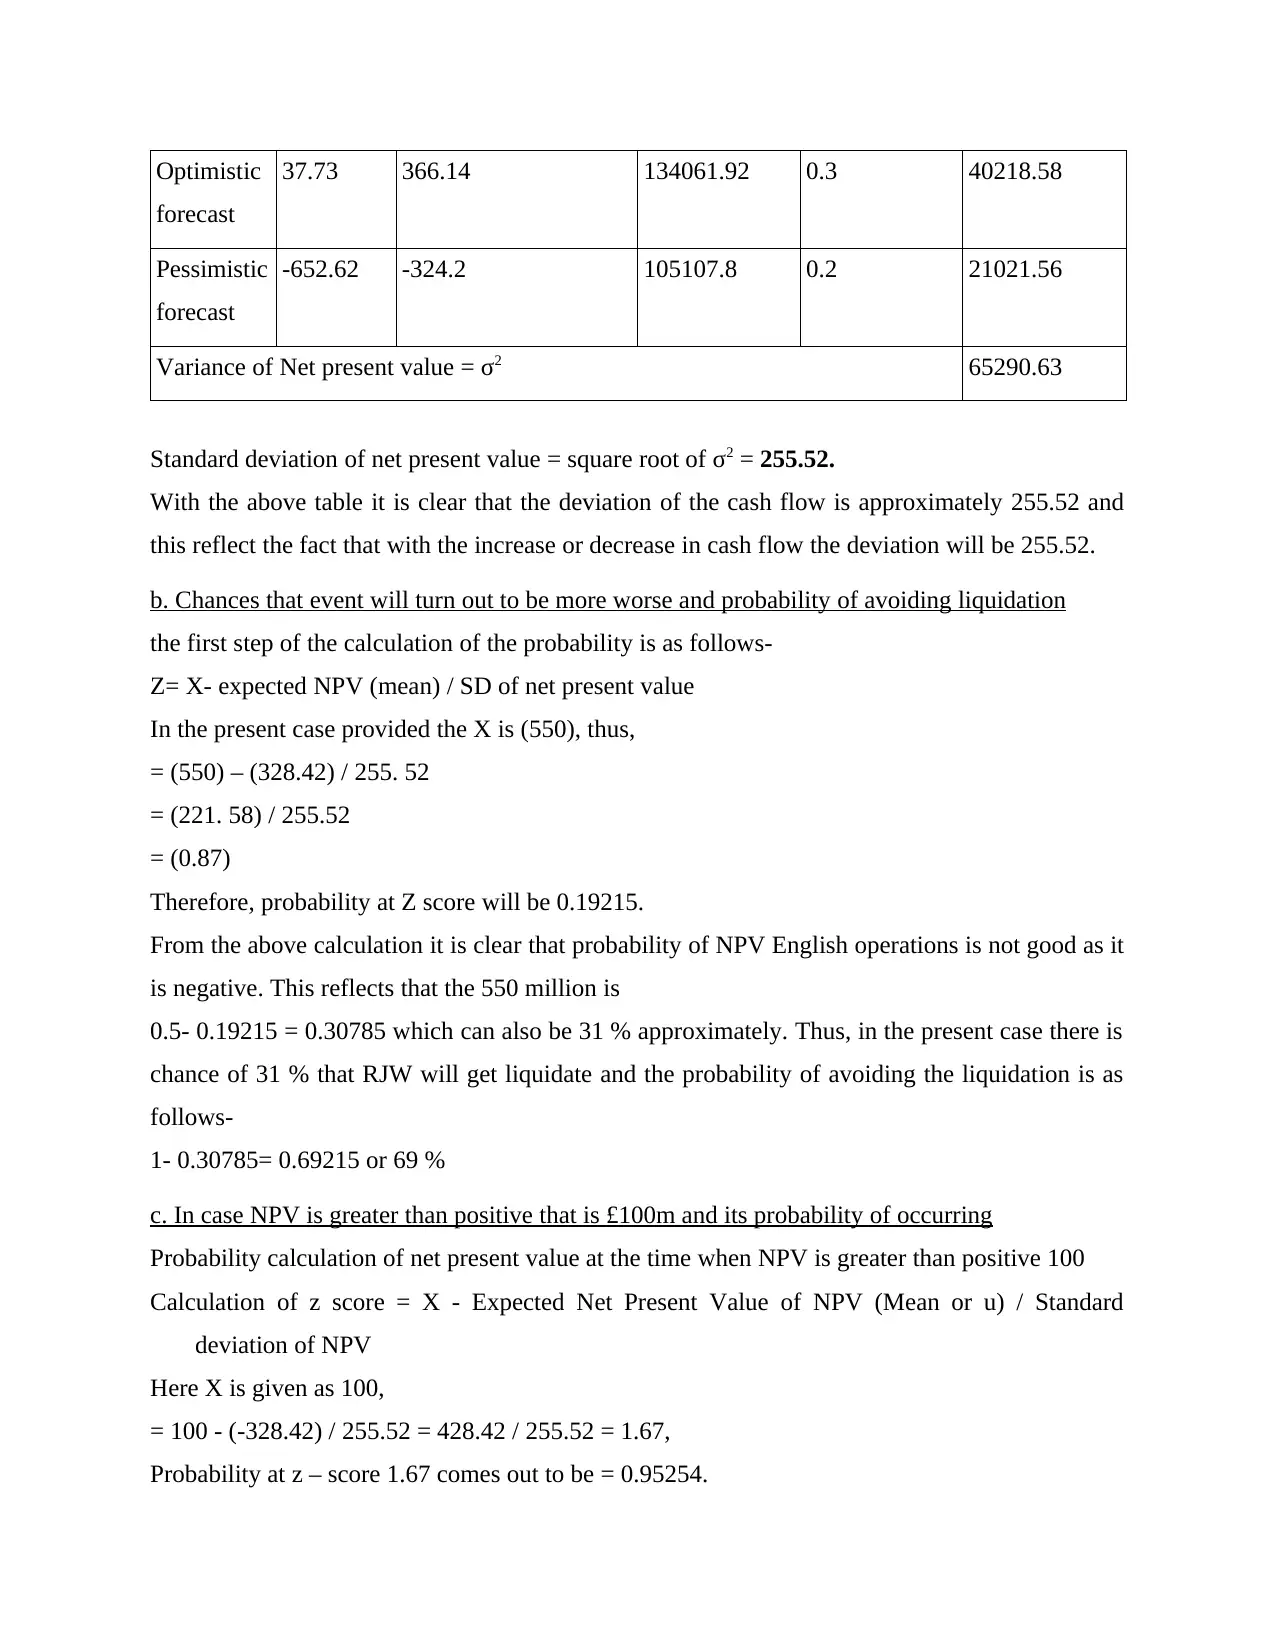
Optimistic
forecast
37.73 366.14 134061.92 0.3 40218.58
Pessimistic
forecast
-652.62 -324.2 105107.8 0.2 21021.56
Variance of Net present value = σ2 65290.63
Standard deviation of net present value = square root of σ2 = 255.52.
With the above table it is clear that the deviation of the cash flow is approximately 255.52 and
this reflect the fact that with the increase or decrease in cash flow the deviation will be 255.52.
b. Chances that event will turn out to be more worse and probability of avoiding liquidation
the first step of the calculation of the probability is as follows-
Z= X- expected NPV (mean) / SD of net present value
In the present case provided the X is (550), thus,
= (550) – (328.42) / 255. 52
= (221. 58) / 255.52
= (0.87)
Therefore, probability at Z score will be 0.19215.
From the above calculation it is clear that probability of NPV English operations is not good as it
is negative. This reflects that the 550 million is
0.5- 0.19215 = 0.30785 which can also be 31 % approximately. Thus, in the present case there is
chance of 31 % that RJW will get liquidate and the probability of avoiding the liquidation is as
follows-
1- 0.30785= 0.69215 or 69 %
c. In case NPV is greater than positive that is £100m and its probability of occurring
Probability calculation of net present value at the time when NPV is greater than positive 100
Calculation of z score = X - Expected Net Present Value of NPV (Mean or u) / Standard
deviation of NPV
Here X is given as 100,
= 100 - (-328.42) / 255.52 = 428.42 / 255.52 = 1.67,
Probability at z – score 1.67 comes out to be = 0.95254.
forecast
37.73 366.14 134061.92 0.3 40218.58
Pessimistic
forecast
-652.62 -324.2 105107.8 0.2 21021.56
Variance of Net present value = σ2 65290.63
Standard deviation of net present value = square root of σ2 = 255.52.
With the above table it is clear that the deviation of the cash flow is approximately 255.52 and
this reflect the fact that with the increase or decrease in cash flow the deviation will be 255.52.
b. Chances that event will turn out to be more worse and probability of avoiding liquidation
the first step of the calculation of the probability is as follows-
Z= X- expected NPV (mean) / SD of net present value
In the present case provided the X is (550), thus,
= (550) – (328.42) / 255. 52
= (221. 58) / 255.52
= (0.87)
Therefore, probability at Z score will be 0.19215.
From the above calculation it is clear that probability of NPV English operations is not good as it
is negative. This reflects that the 550 million is
0.5- 0.19215 = 0.30785 which can also be 31 % approximately. Thus, in the present case there is
chance of 31 % that RJW will get liquidate and the probability of avoiding the liquidation is as
follows-
1- 0.30785= 0.69215 or 69 %
c. In case NPV is greater than positive that is £100m and its probability of occurring
Probability calculation of net present value at the time when NPV is greater than positive 100
Calculation of z score = X - Expected Net Present Value of NPV (Mean or u) / Standard
deviation of NPV
Here X is given as 100,
= 100 - (-328.42) / 255.52 = 428.42 / 255.52 = 1.67,
Probability at z – score 1.67 comes out to be = 0.95254.
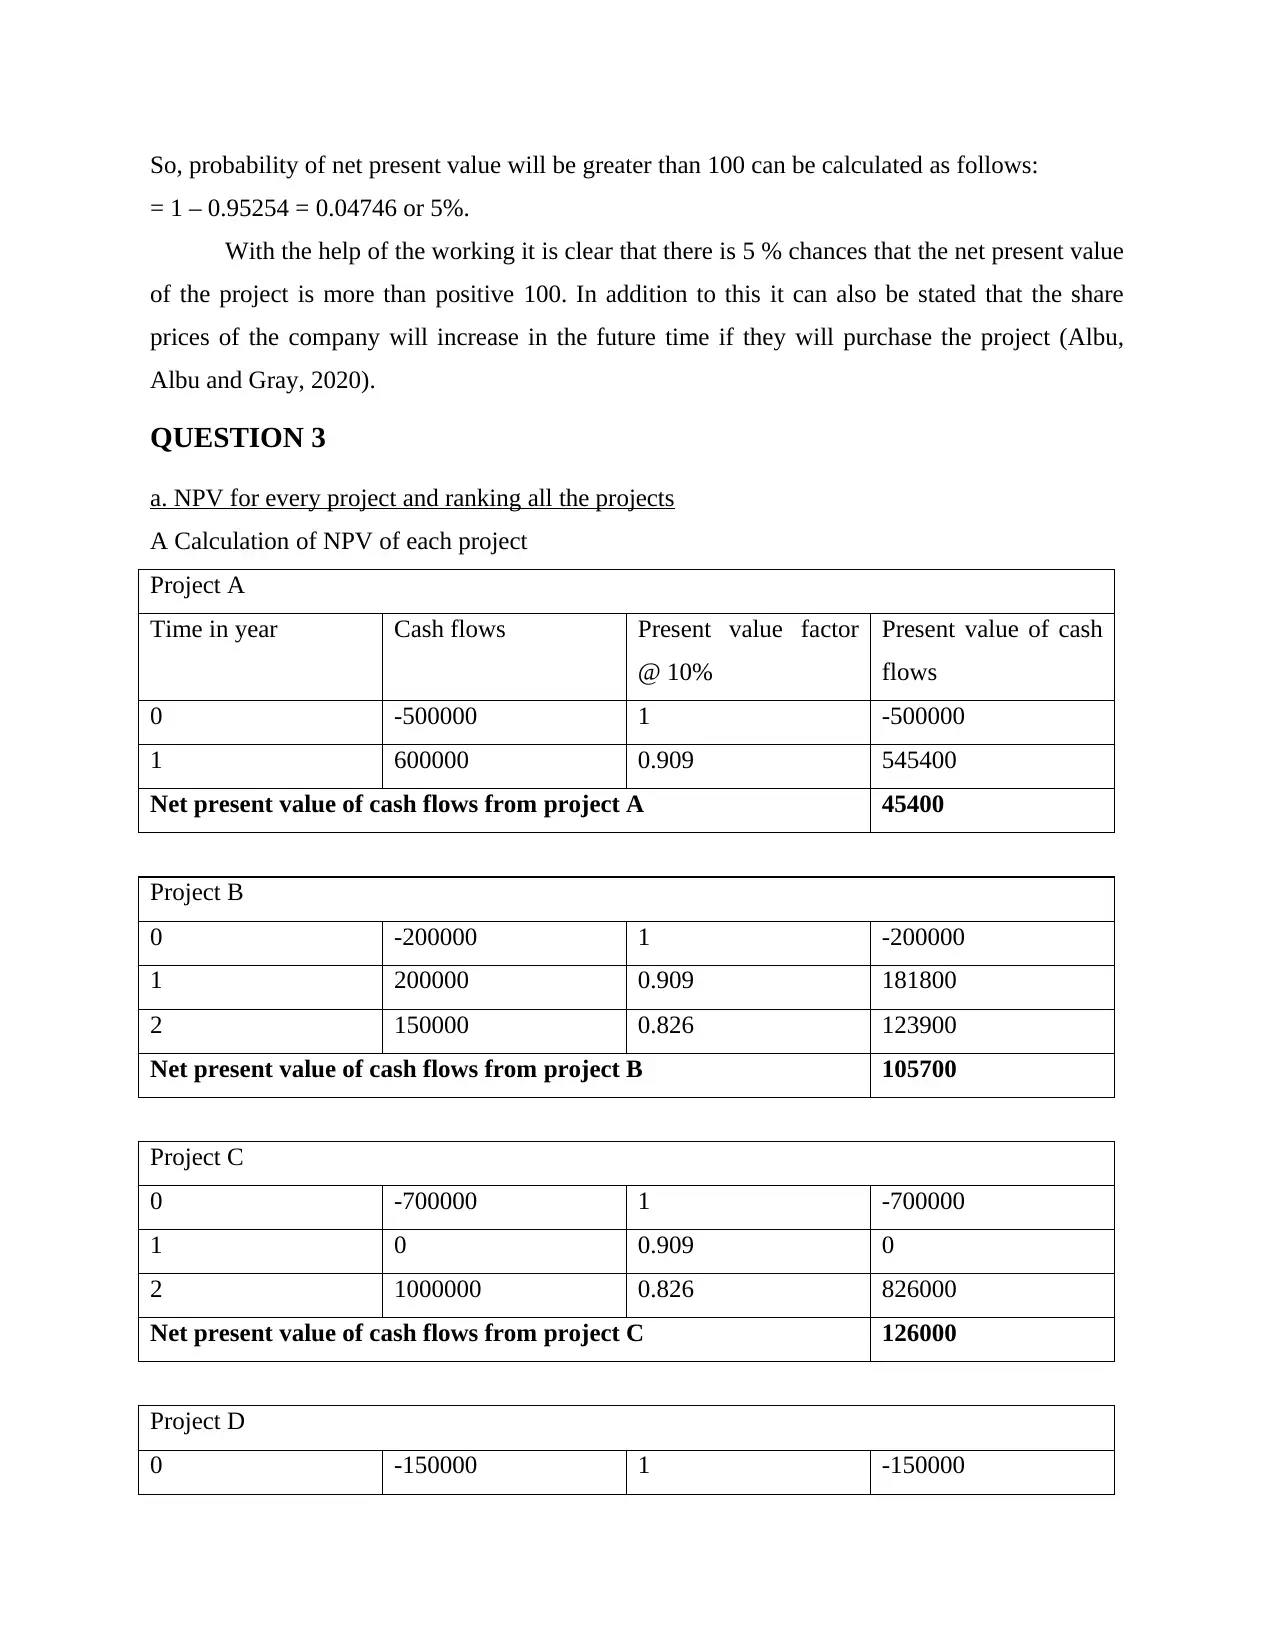
So, probability of net present value will be greater than 100 can be calculated as follows:
= 1 – 0.95254 = 0.04746 or 5%.
With the help of the working it is clear that there is 5 % chances that the net present value
of the project is more than positive 100. In addition to this it can also be stated that the share
prices of the company will increase in the future time if they will purchase the project (Albu,
Albu and Gray, 2020).
QUESTION 3
a. NPV for every project and ranking all the projects
A Calculation of NPV of each project
Project A
Time in year Cash flows Present value factor
@ 10%
Present value of cash
flows
0 -500000 1 -500000
1 600000 0.909 545400
Net present value of cash flows from project A 45400
Project B
0 -200000 1 -200000
1 200000 0.909 181800
2 150000 0.826 123900
Net present value of cash flows from project B 105700
Project C
0 -700000 1 -700000
1 0 0.909 0
2 1000000 0.826 826000
Net present value of cash flows from project C 126000
Project D
0 -150000 1 -150000
⊘ This is a preview!⊘
Do you want full access?
Subscribe today to unlock all pages.
Trusted by 1+ million students worldwide
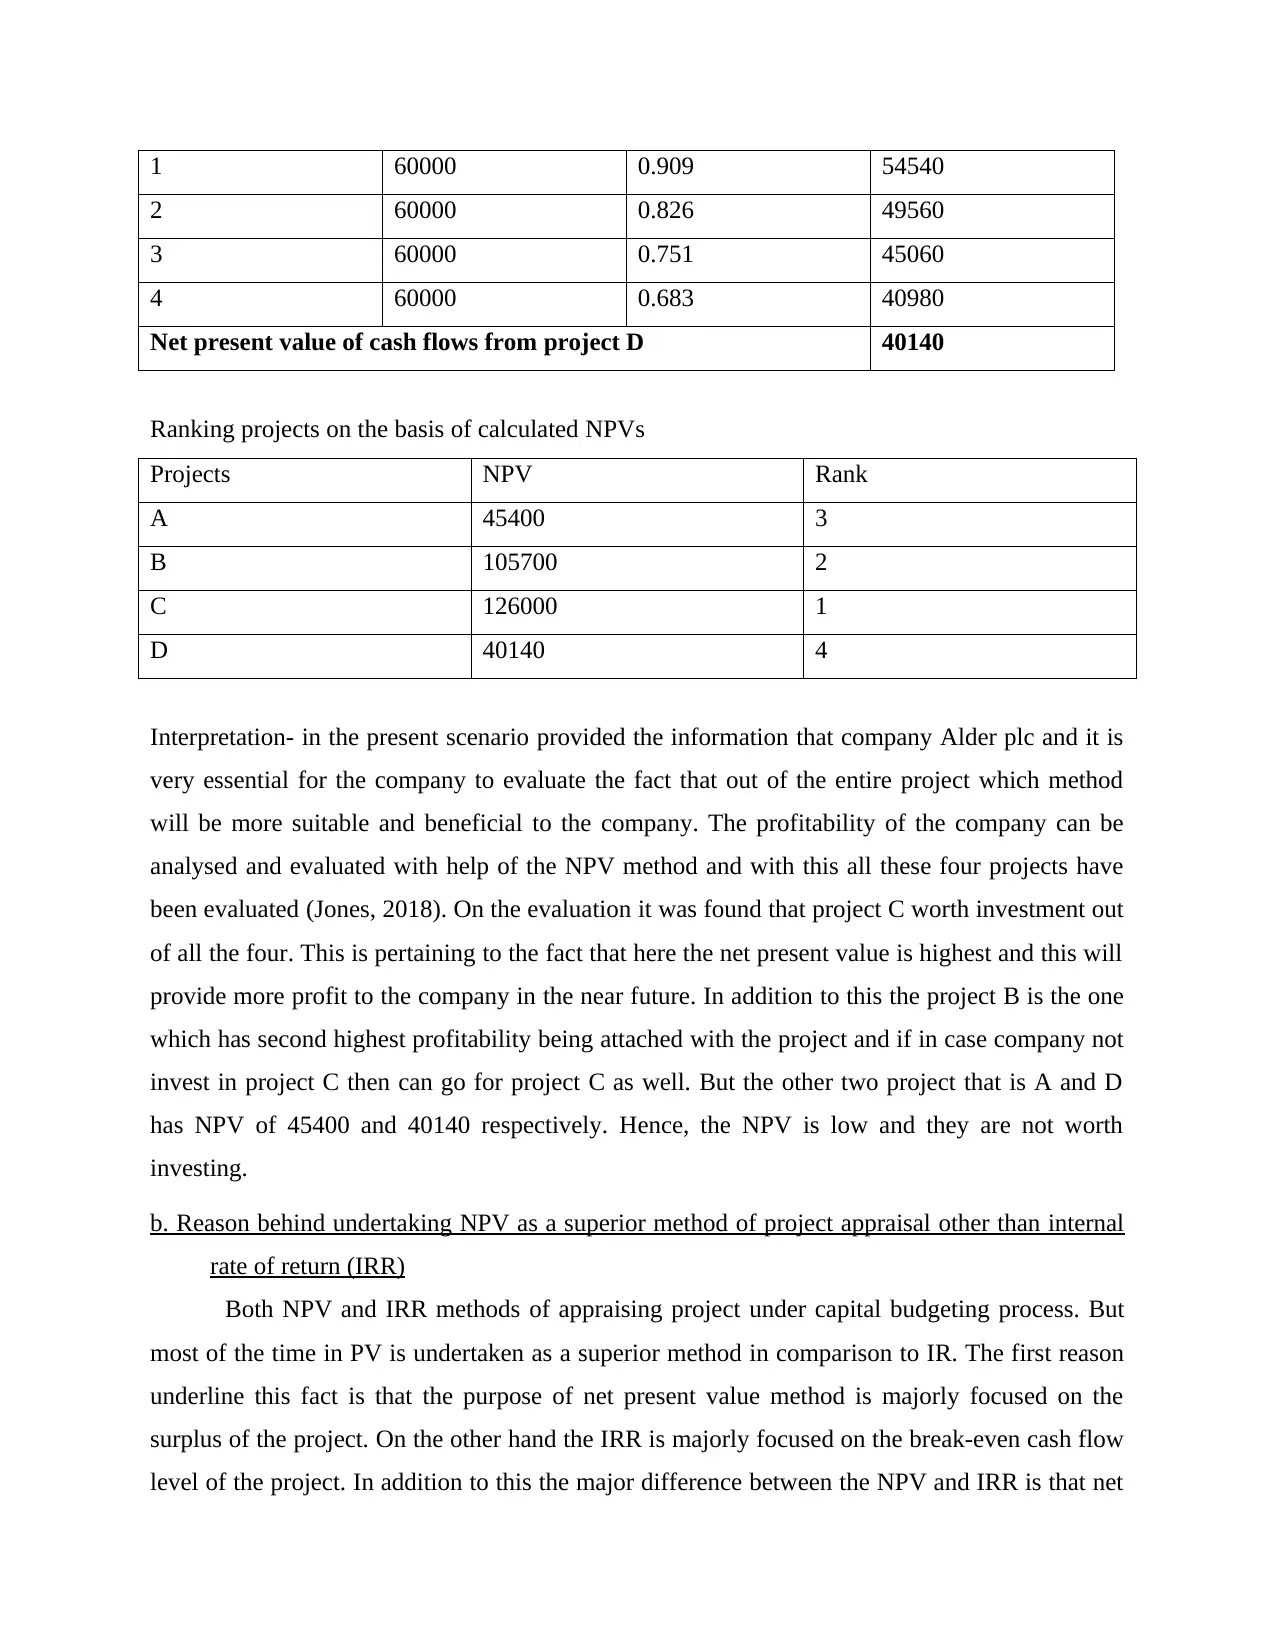
1 60000 0.909 54540
2 60000 0.826 49560
3 60000 0.751 45060
4 60000 0.683 40980
Net present value of cash flows from project D 40140
Ranking projects on the basis of calculated NPVs
Projects NPV Rank
A 45400 3
B 105700 2
C 126000 1
D 40140 4
Interpretation- in the present scenario provided the information that company Alder plc and it is
very essential for the company to evaluate the fact that out of the entire project which method
will be more suitable and beneficial to the company. The profitability of the company can be
analysed and evaluated with help of the NPV method and with this all these four projects have
been evaluated (Jones, 2018). On the evaluation it was found that project C worth investment out
of all the four. This is pertaining to the fact that here the net present value is highest and this will
provide more profit to the company in the near future. In addition to this the project B is the one
which has second highest profitability being attached with the project and if in case company not
invest in project C then can go for project C as well. But the other two project that is A and D
has NPV of 45400 and 40140 respectively. Hence, the NPV is low and they are not worth
investing.
b. Reason behind undertaking NPV as a superior method of project appraisal other than internal
rate of return (IRR)
Both NPV and IRR methods of appraising project under capital budgeting process. But
most of the time in PV is undertaken as a superior method in comparison to IR. The first reason
underline this fact is that the purpose of net present value method is majorly focused on the
surplus of the project. On the other hand the IRR is majorly focused on the break-even cash flow
level of the project. In addition to this the major difference between the NPV and IRR is that net
Paraphrase This Document
Need a fresh take? Get an instant paraphrase of this document with our AI Paraphraser
present value method presents the outcome in the form of dollar return where as the present its
decision in form of percentage format. Hence at time of taking investment decision the dollar
return is more reliable as compared to the percentage return (Cassis and Wójcik, eds., 2018).
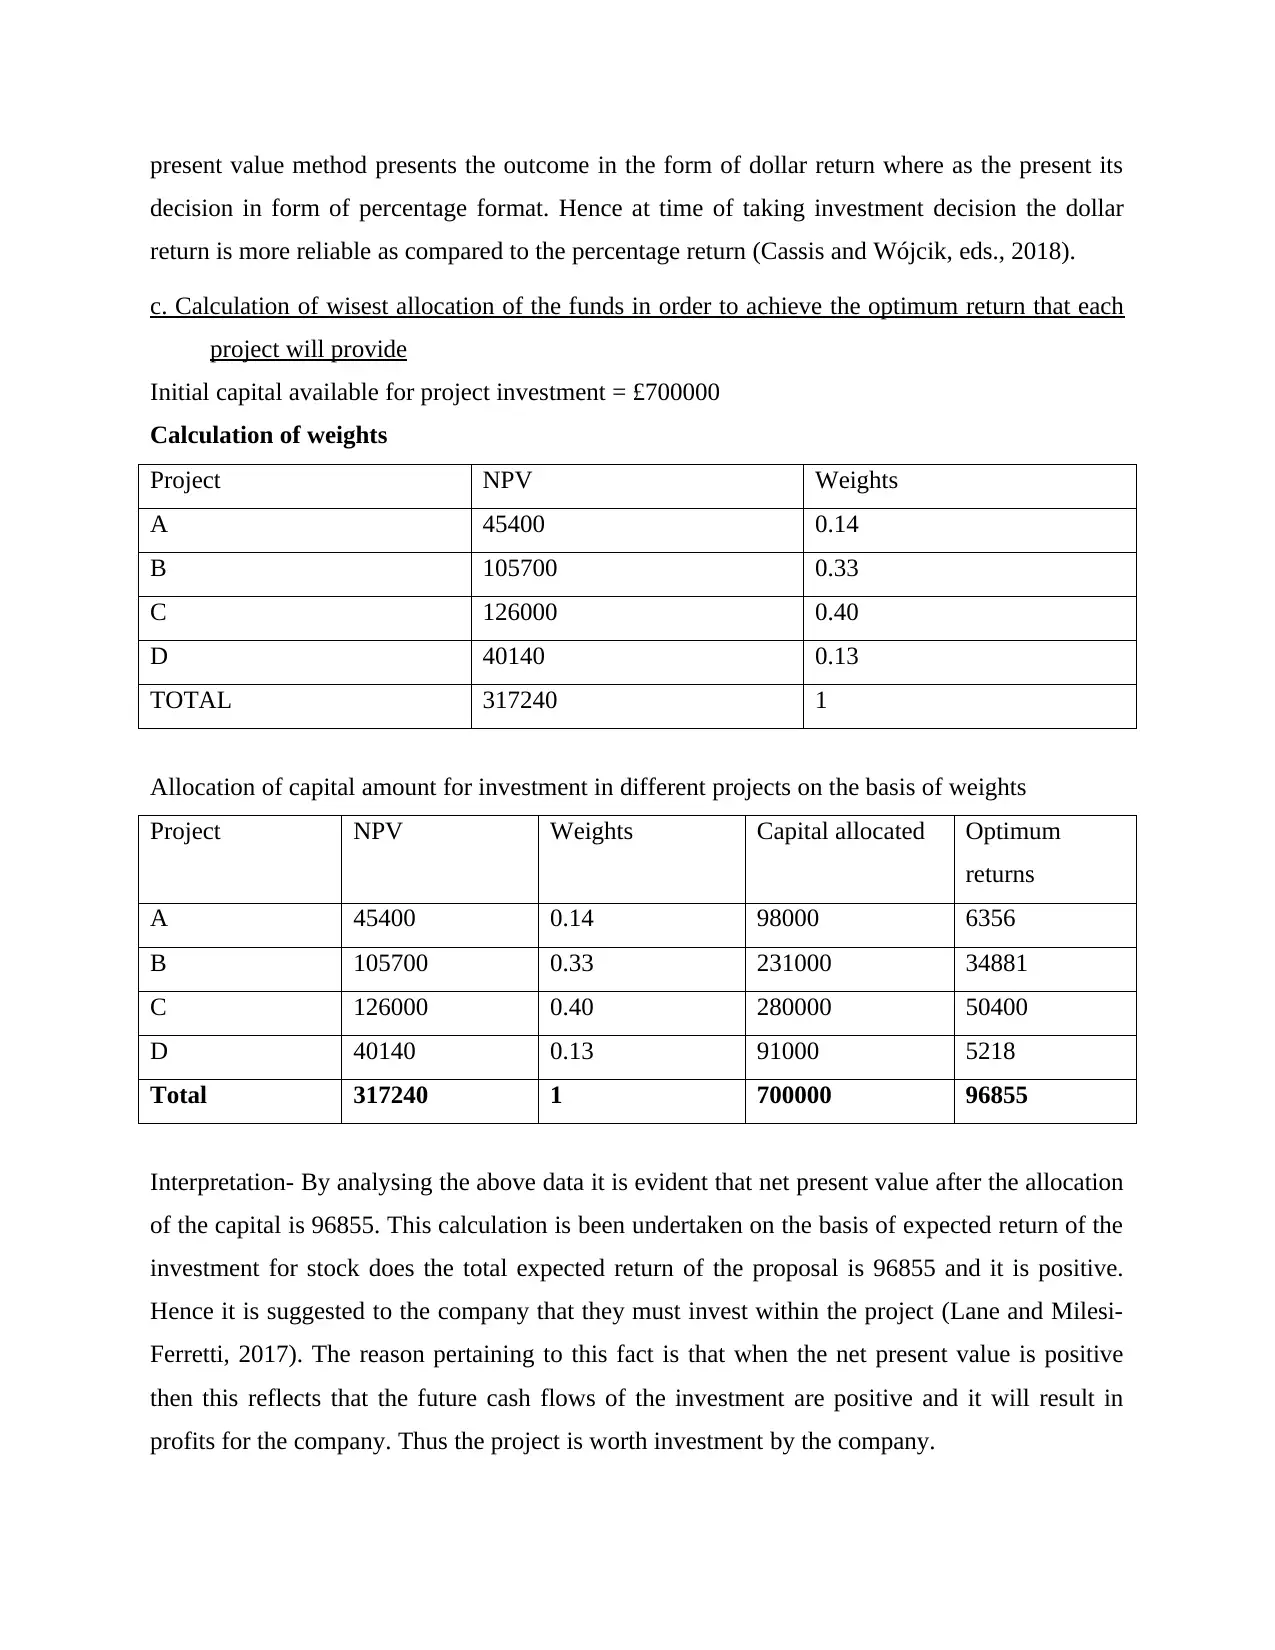
c. Calculation of wisest allocation of the funds in order to achieve the optimum return that each
project will provide
Initial capital available for project investment = £700000
Calculation of weights
Project NPV Weights
A 45400 0.14
B 105700 0.33
C 126000 0.40
D 40140 0.13
TOTAL 317240 1
Allocation of capital amount for investment in different projects on the basis of weights
Project NPV Weights Capital allocated Optimum
returns
A 45400 0.14 98000 6356
B 105700 0.33 231000 34881
C 126000 0.40 280000 50400
D 40140 0.13 91000 5218
Total 317240 1 700000 96855
Interpretation- By analysing the above data it is evident that net present value after the allocation
of the capital is 96855. This calculation is been undertaken on the basis of expected return of the
investment for stock does the total expected return of the proposal is 96855 and it is positive.
Hence it is suggested to the company that they must invest within the project (Lane and Milesi-
Ferretti, 2017). The reason pertaining to this fact is that when the net present value is positive
then this reflects that the future cash flows of the investment are positive and it will result in
profits for the company. Thus the project is worth investment by the company.
decision in form of percentage format. Hence at time of taking investment decision the dollar
return is more reliable as compared to the percentage return (Cassis and Wójcik, eds., 2018).
c. Calculation of wisest allocation of the funds in order to achieve the optimum return that each
project will provide
Initial capital available for project investment = £700000
Calculation of weights
Project NPV Weights
A 45400 0.14
B 105700 0.33
C 126000 0.40
D 40140 0.13
TOTAL 317240 1
Allocation of capital amount for investment in different projects on the basis of weights
Project NPV Weights Capital allocated Optimum
returns
A 45400 0.14 98000 6356
B 105700 0.33 231000 34881
C 126000 0.40 280000 50400
D 40140 0.13 91000 5218
Total 317240 1 700000 96855
Interpretation- By analysing the above data it is evident that net present value after the allocation
of the capital is 96855. This calculation is been undertaken on the basis of expected return of the
investment for stock does the total expected return of the proposal is 96855 and it is positive.
Hence it is suggested to the company that they must invest within the project (Lane and Milesi-
Ferretti, 2017). The reason pertaining to this fact is that when the net present value is positive
then this reflects that the future cash flows of the investment are positive and it will result in
profits for the company. Thus the project is worth investment by the company.
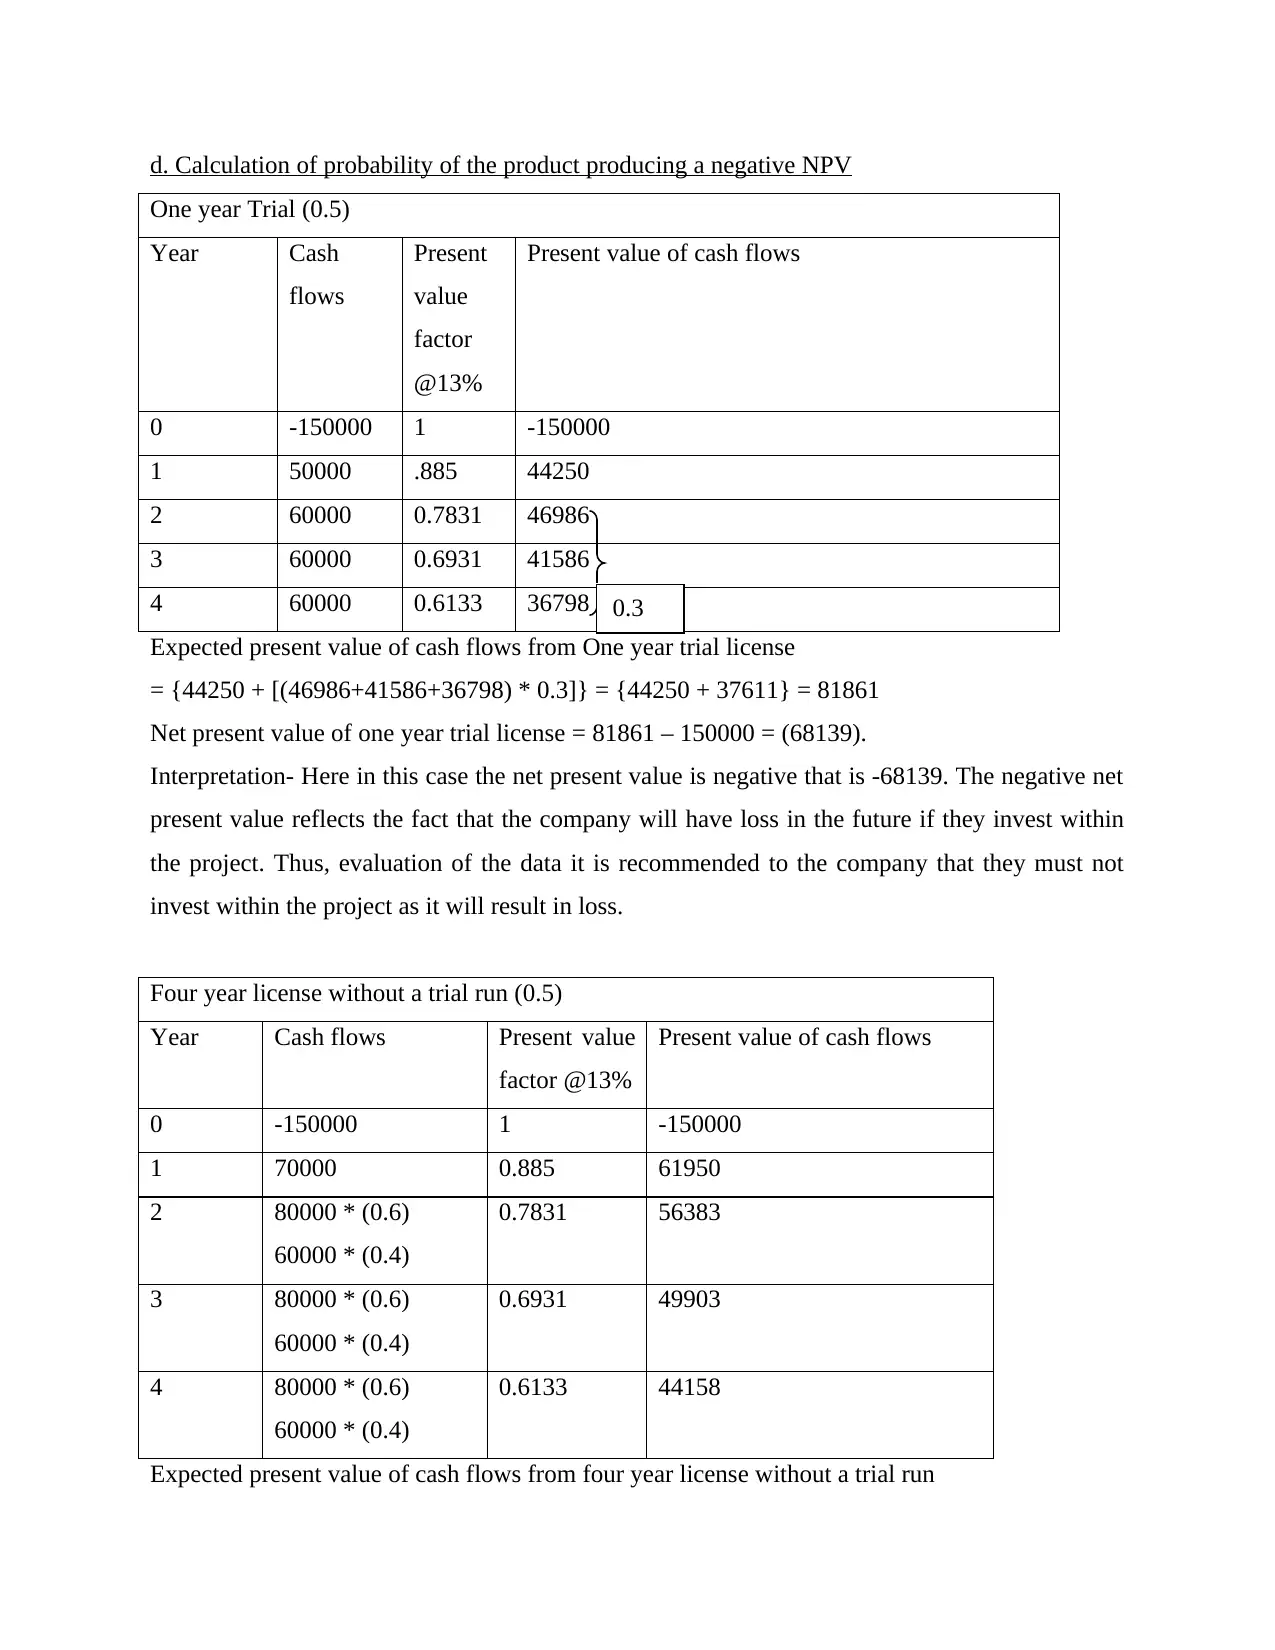
d. Calculation of probability of the product producing a negative NPV
One year Trial (0.5)
Year Cash
flows
Present
value
factor
@13%
Present value of cash flows
0 -150000 1 -150000
1 50000 .885 44250
2 60000 0.7831 46986
3 60000 0.6931 41586
4 60000 0.6133 36798
Expected present value of cash flows from One year trial license
= {44250 + [(46986+41586+36798) * 0.3]} = {44250 + 37611} = 81861
Net present value of one year trial license = 81861 – 150000 = (68139).
Interpretation- Here in this case the net present value is negative that is -68139. The negative net
present value reflects the fact that the company will have loss in the future if they invest within
the project. Thus, evaluation of the data it is recommended to the company that they must not
invest within the project as it will result in loss.
Four year license without a trial run (0.5)
Year Cash flows Present value
factor @13%
Present value of cash flows
0 -150000 1 -150000
1 70000 0.885 61950
2 80000 * (0.6)
60000 * (0.4)
0.7831 56383
3 80000 * (0.6)
60000 * (0.4)
0.6931 49903
4 80000 * (0.6)
60000 * (0.4)
0.6133 44158
Expected present value of cash flows from four year license without a trial run
0.3
⊘ This is a preview!⊘
Do you want full access?
Subscribe today to unlock all pages.
Trusted by 1+ million students worldwide
1 out of 15
Related Documents


![International Finance Management Assignment - Finance [Course Code]](/_next/image/?url=https%3A%2F%2Fdesklib.com%2Fmedia%2Fimages%2Ffd%2F69271dad5c5f4f2c8ab93e7e6daf77ee.jpg&w=256&q=75)


Your All-in-One AI-Powered Toolkit for Academic Success.
+13062052269
info@desklib.com
Available 24*7 on WhatsApp / Email
![[object Object]](/_next/static/media/star-bottom.7253800d.svg)
Unlock your academic potential
Copyright © 2020–2026 A2Z Services. All Rights Reserved. Developed and managed by ZUCOL.