International Financial Management (LCBB6002) Report - Assessment 2
VerifiedAdded on 2022/12/14
|16
|3130
|391
Report
AI Summary
This report provides an in-depth analysis of International Financial Management, addressing key concepts such as Net Present Value (NPV) and Internal Rate of Return (IRR). The report begins with an introduction to international finance and then delves into specific questions related to project evaluation and investment decisions. It includes calculations of expected NPV, standard deviation of NPV, and the ranking of projects based on their NPVs. The report also discusses the superiority of NPV over IRR in project appraisal, capital allocation strategies for maximizing returns, and the evaluation of investment opportunities using different licensing scenarios. The analysis covers cash flow projections, present value calculations, and the application of financial metrics to guide investment choices, concluding with a comprehensive discussion of the findings and recommendations. This comprehensive report provides valuable insights into the practical application of financial management principles in an international context.

International financial
management
management
Paraphrase This Document
Need a fresh take? Get an instant paraphrase of this document with our AI Paraphraser

TABLE OF CONTENT
Introduction......................................................................................................................................1
Main body........................................................................................................................................1
Que.1............................................................................................................................................1
Question2.....................................................................................................................................3
Que. 3...........................................................................................................................................5
Conclusion.....................................................................................................................................12
REFERENCES..............................................................................................................................13
Introduction
International Financial Management which is popularly known as International Finance. It refers
to the management of finance on the international market (Jinadu and et.al201) . International
Financial Management provides and platform to all the companies through which they can trade
and exchange the money and product with the help of international let them a high profit and
spread brand awareness in the globe. Financial management helps the companies and business of
entire world to deal with each other. In this report a 2 year projected cash flow has been
mentioned. The standard deviation of NPV is also being discussed in this report. Cost of capital
is also being calculated in this report. Internal rate of return for the project is also being discussed
in this report. Net present value any company and investor can recognise the projects and their
highest value so that with the help of net present value they may know the better project and they
may get clarification in which project they want to invest. It is very useful that the monetary
value of money always changes so it is not necessary that the value of money remain the same in
the future. It may decline or it may increase as per the time duration (Davradakis and et.al2019).
So NPV also uses discount factor through which it can provide better result in outcome to the
investor's and also the companies and business so that they can choose best project among
temple of projects and may get higher return.
Main body
Que.1.
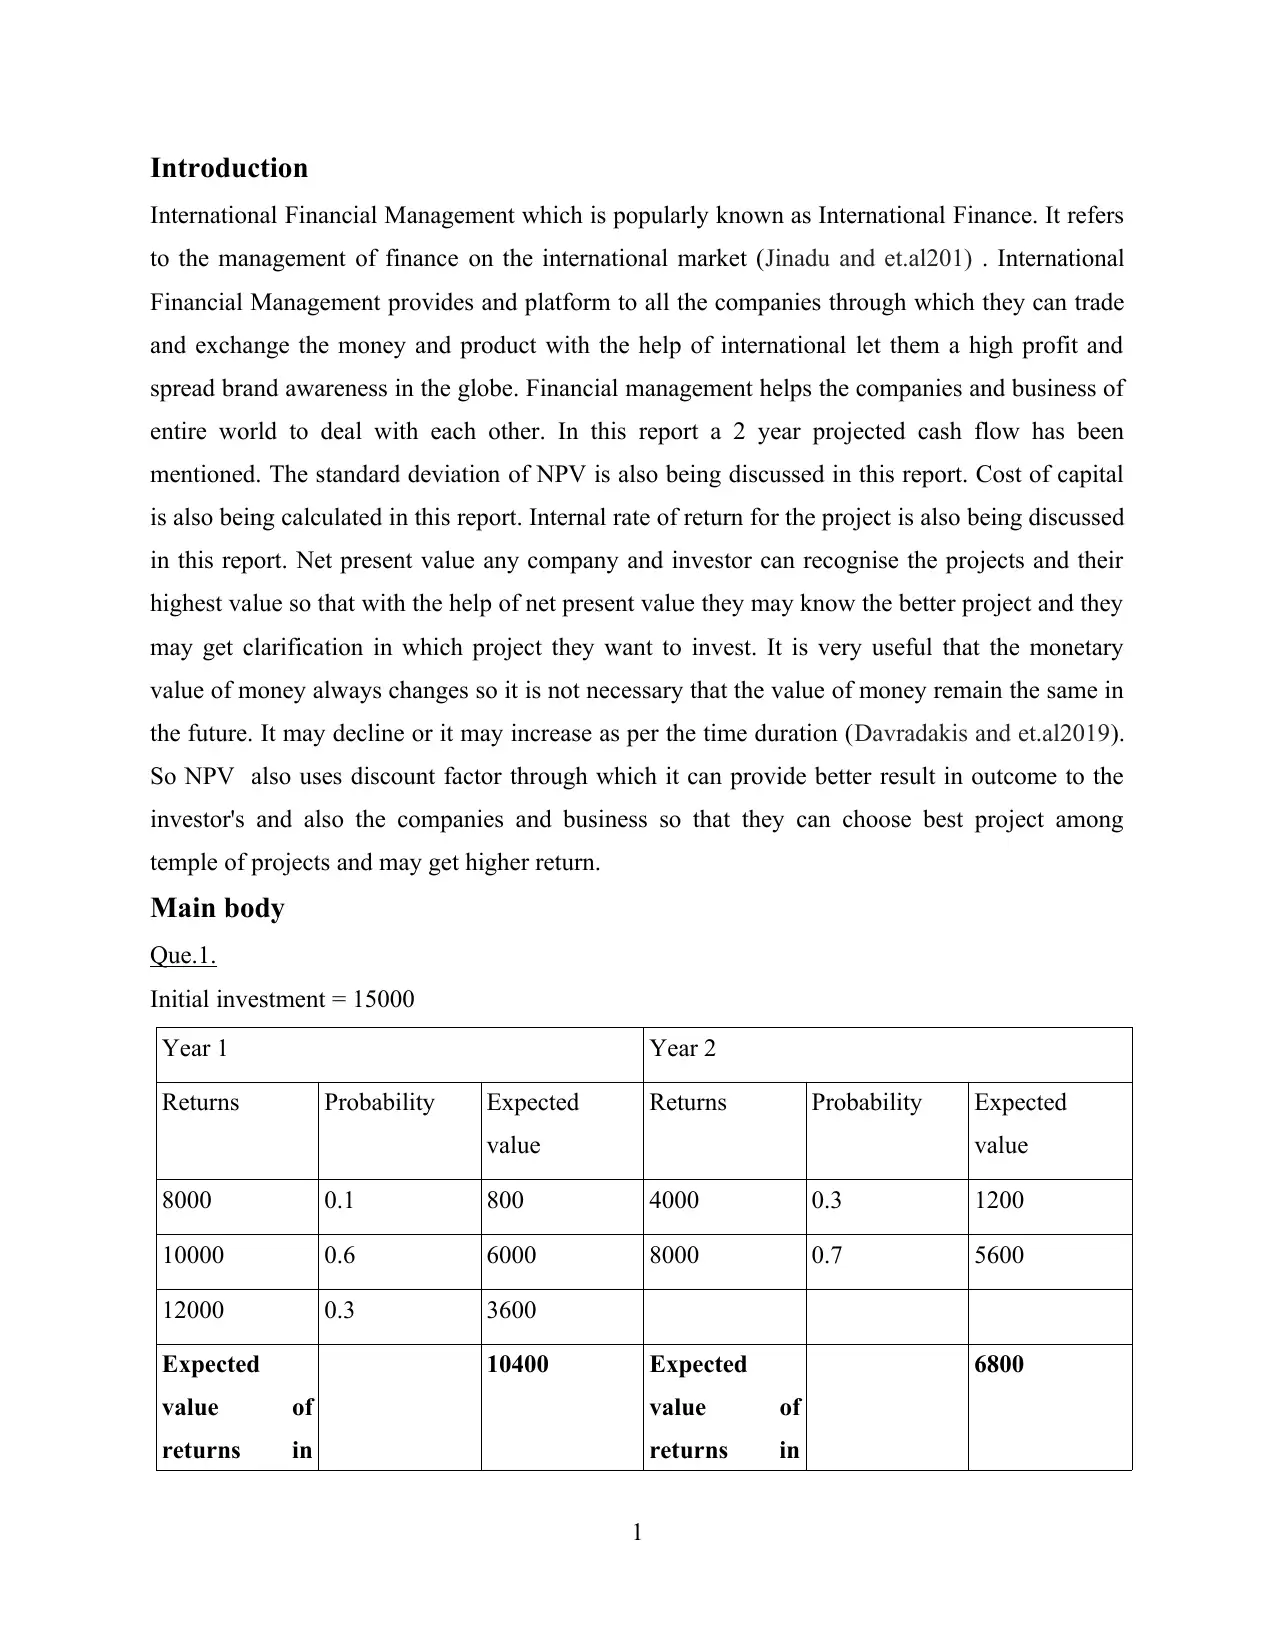
Initial investment = 15000
Year 1 Year 2
Returns Probability Expected
value
Returns Probability Expected
value
8000 0.1 800 4000 0.3 1200
10000 0.6 6000 8000 0.7 5600
12000 0.3 3600
Expected
value of
returns in
10400 Expected
value of
returns in
6800
1
International Financial Management which is popularly known as International Finance. It refers
to the management of finance on the international market (Jinadu and et.al201) . International
Financial Management provides and platform to all the companies through which they can trade
and exchange the money and product with the help of international let them a high profit and
spread brand awareness in the globe. Financial management helps the companies and business of
entire world to deal with each other. In this report a 2 year projected cash flow has been
mentioned. The standard deviation of NPV is also being discussed in this report. Cost of capital
is also being calculated in this report. Internal rate of return for the project is also being discussed
in this report. Net present value any company and investor can recognise the projects and their
highest value so that with the help of net present value they may know the better project and they
may get clarification in which project they want to invest. It is very useful that the monetary
value of money always changes so it is not necessary that the value of money remain the same in
the future. It may decline or it may increase as per the time duration (Davradakis and et.al2019).
So NPV also uses discount factor through which it can provide better result in outcome to the
investor's and also the companies and business so that they can choose best project among
temple of projects and may get higher return.
Main body
Que.1.
Initial investment = 15000
Year 1 Year 2
Returns Probability Expected
value
Returns Probability Expected
value
8000 0.1 800 4000 0.3 1200
10000 0.6 6000 8000 0.7 5600
12000 0.3 3600
Expected
value of
returns in
10400 Expected
value of
returns in
6800
1
⊘ This is a preview!⊘
Do you want full access?
Subscribe today to unlock all pages.
Trusted by 1+ million students worldwide
year 1 year 2
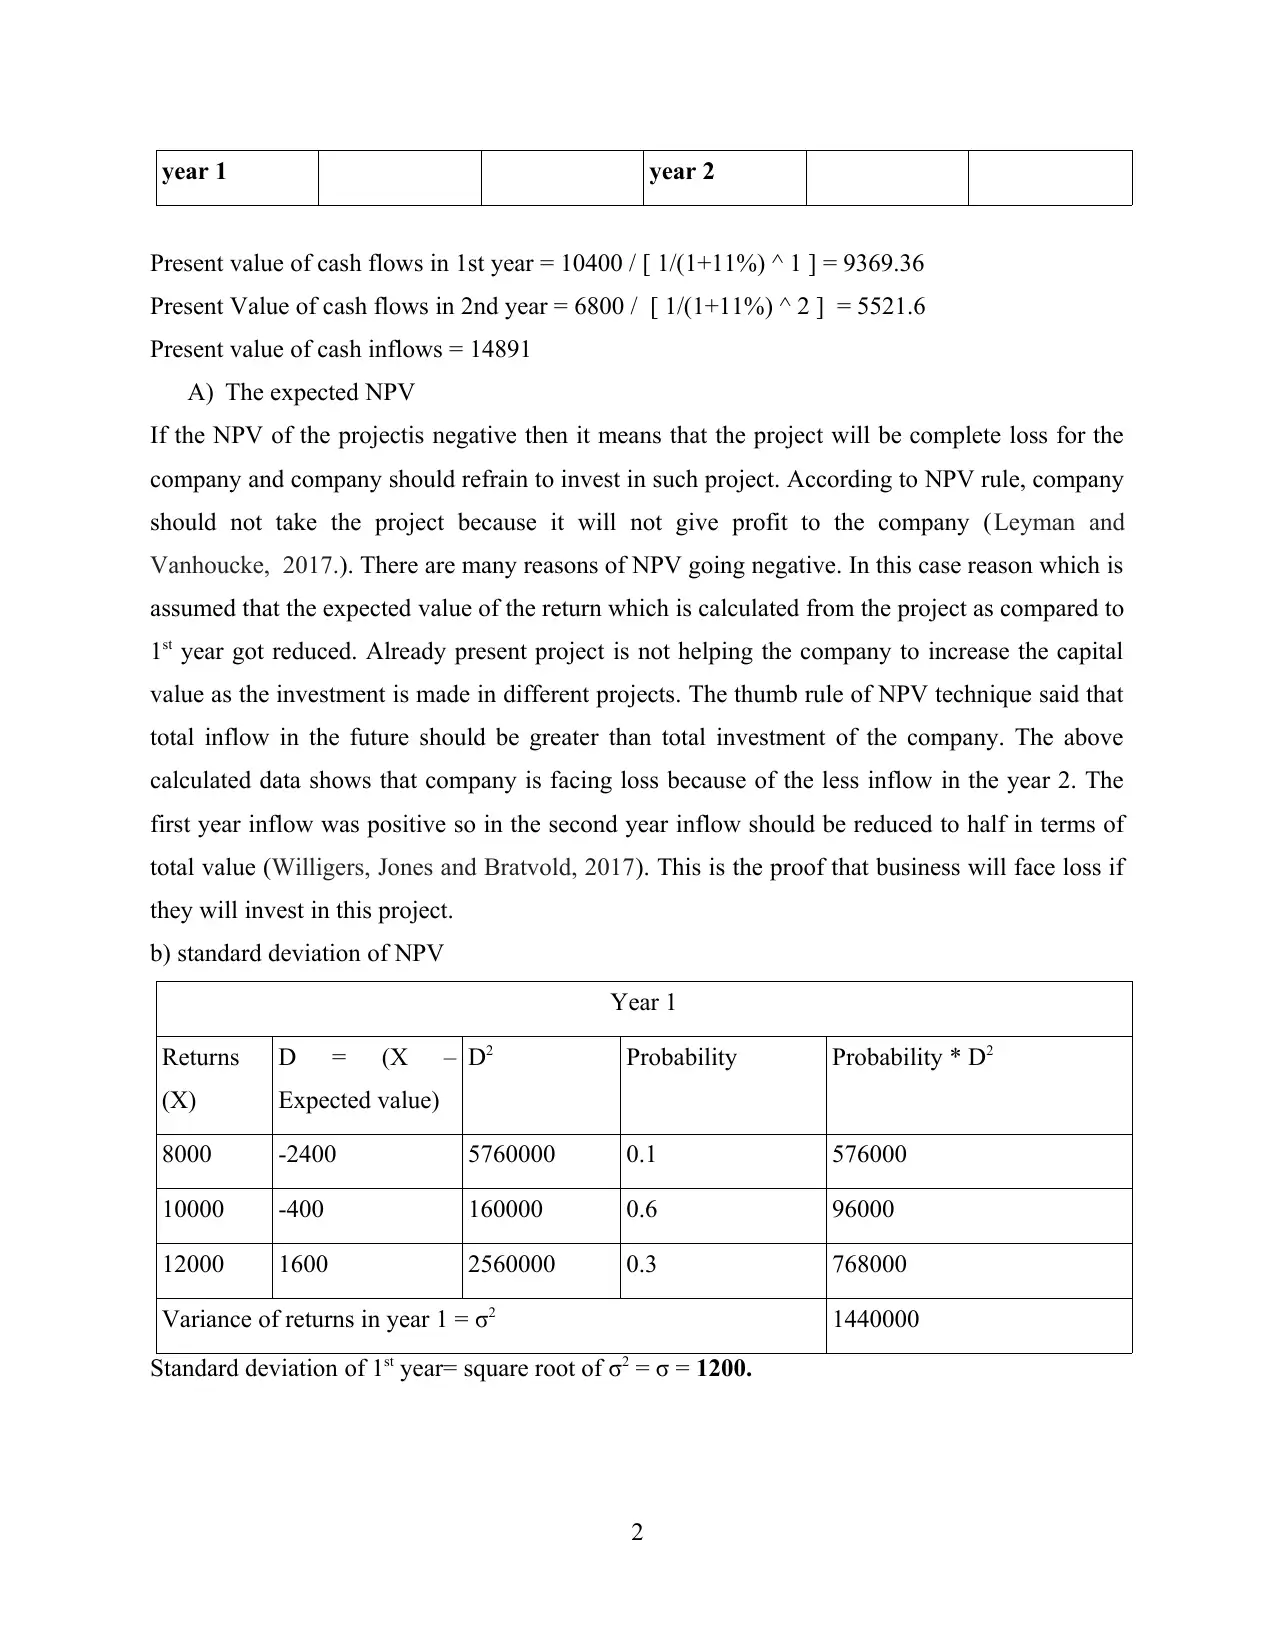
Present value of cash flows in 1st year = 10400 / [ 1/(1+11%) ^ 1 ] = 9369.36
Present Value of cash flows in 2nd year = 6800 / [ 1/(1+11%) ^ 2 ] = 5521.6
Present value of cash inflows = 14891
A) The expected NPV
If the NPV of the projectis negative then it means that the project will be complete loss for the
company and company should refrain to invest in such project. According to NPV rule, company
should not take the project because it will not give profit to the company (Leyman and
Vanhoucke, 2017.). There are many reasons of NPV going negative. In this case reason which is
assumed that the expected value of the return which is calculated from the project as compared to
1st year got reduced. Already present project is not helping the company to increase the capital
value as the investment is made in different projects. The thumb rule of NPV technique said that
total inflow in the future should be greater than total investment of the company. The above
calculated data shows that company is facing loss because of the less inflow in the year 2. The
first year inflow was positive so in the second year inflow should be reduced to half in terms of
total value (Willigers, Jones and Bratvold, 2017). This is the proof that business will face loss if
they will invest in this project.
b) standard deviation of NPV
Year 1
Returns
(X)
D = (X –
Expected value)
D2 Probability Probability * D2
8000 -2400 5760000 0.1 576000
10000 -400 160000 0.6 96000
12000 1600 2560000 0.3 768000
Variance of returns in year 1 = σ2 1440000
Standard deviation of 1st year= square root of σ2 = σ = 1200.
2
Paraphrase This Document
Need a fresh take? Get an instant paraphrase of this document with our AI Paraphraser
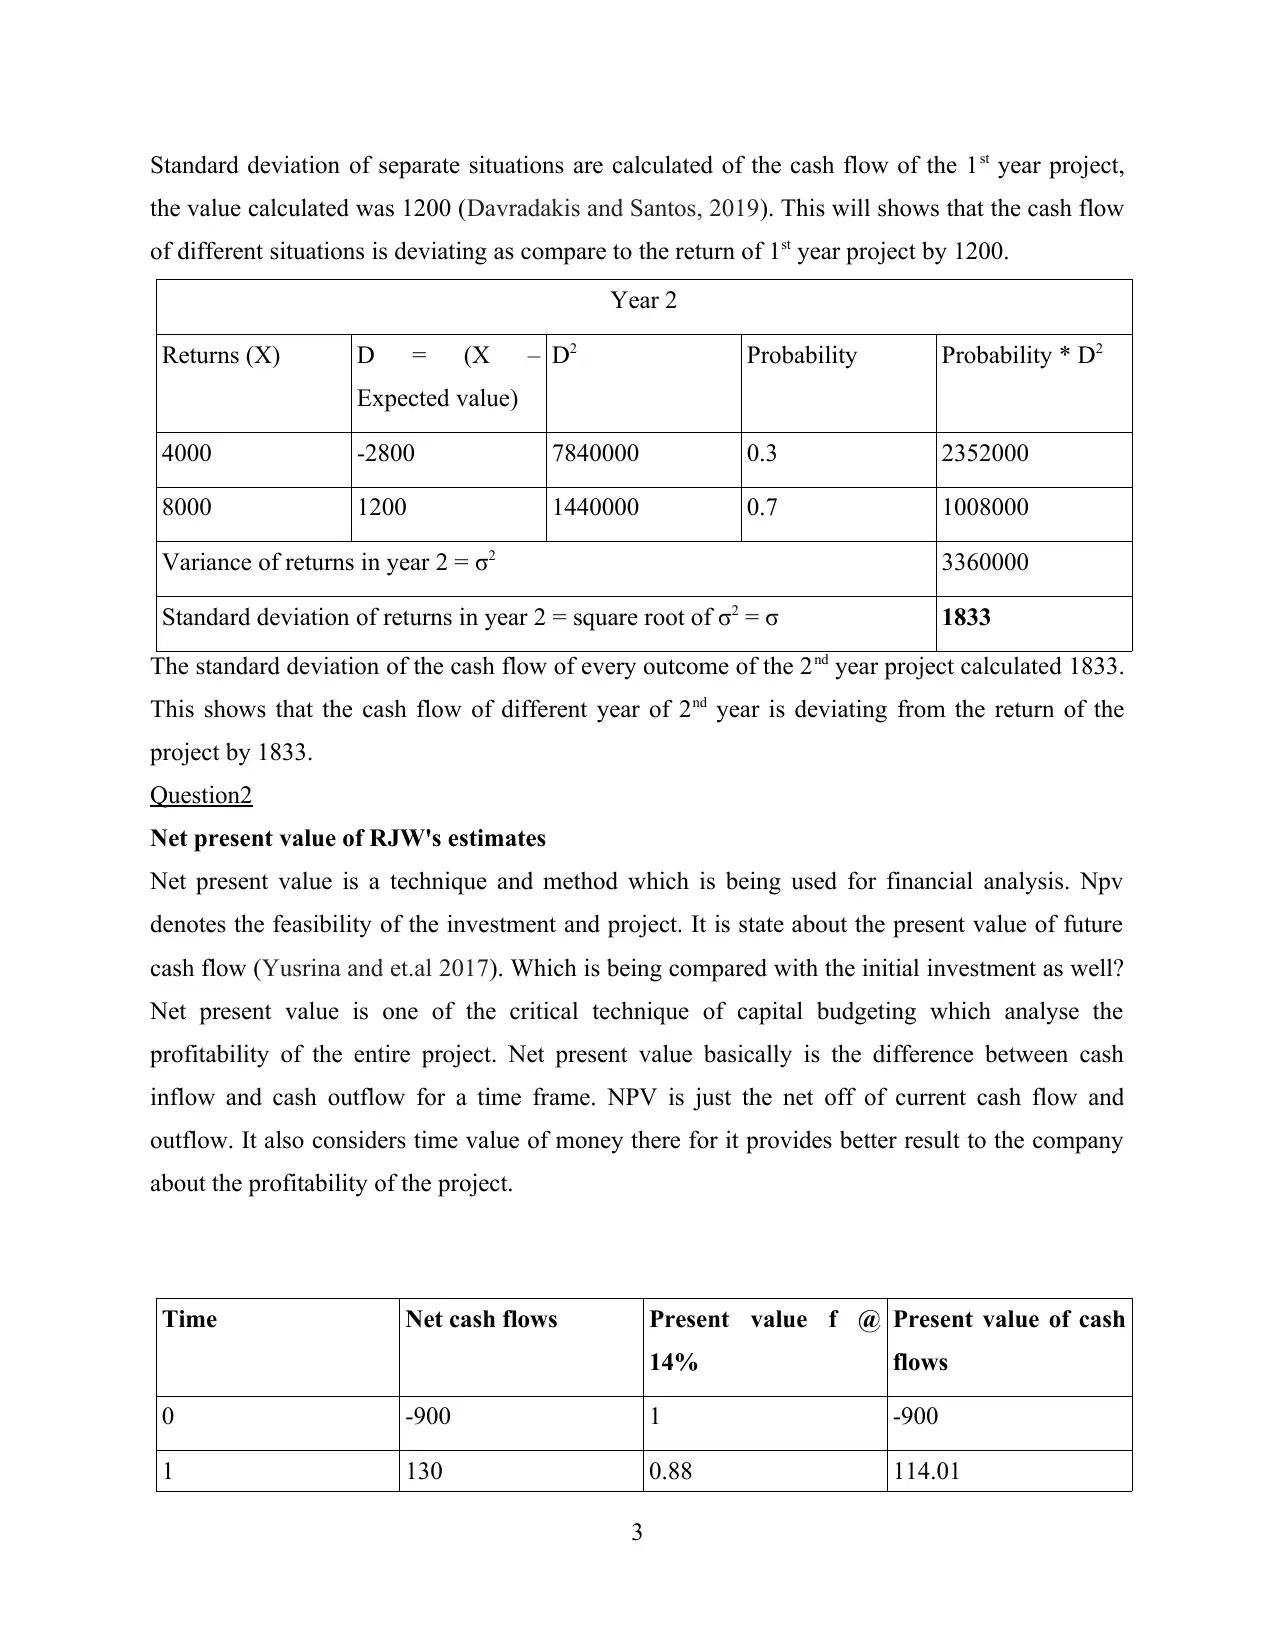
Standard deviation of separate situations are calculated of the cash flow of the 1st year project,
the value calculated was 1200 (Davradakis and Santos, 2019). This will shows that the cash flow
of different situations is deviating as compare to the return of 1st year project by 1200.
Year 2
Returns (X) D = (X –
Expected value)
D2 Probability Probability * D2
4000 -2800 7840000 0.3 2352000
8000 1200 1440000 0.7 1008000
Variance of returns in year 2 = σ2 3360000
Standard deviation of returns in year 2 = square root of σ2 = σ 1833
The standard deviation of the cash flow of every outcome of the 2nd year project calculated 1833.
This shows that the cash flow of different year of 2nd year is deviating from the return of the
project by 1833.
Question2
Net present value of RJW's estimates
Net present value is a technique and method which is being used for financial analysis. Npv
denotes the feasibility of the investment and project. It is state about the present value of future
cash flow (Yusrina and et.al 2017). Which is being compared with the initial investment as well?
Net present value is one of the critical technique of capital budgeting which analyse the
profitability of the entire project. Net present value basically is the difference between cash
inflow and cash outflow for a time frame. NPV is just the net off of current cash flow and
outflow. It also considers time value of money there for it provides better result to the company
about the profitability of the project.
Time Net cash flows Present value f @
14%
Present value of cash
flows
0 -900 1 -900
1 130 0.88 114.01
3
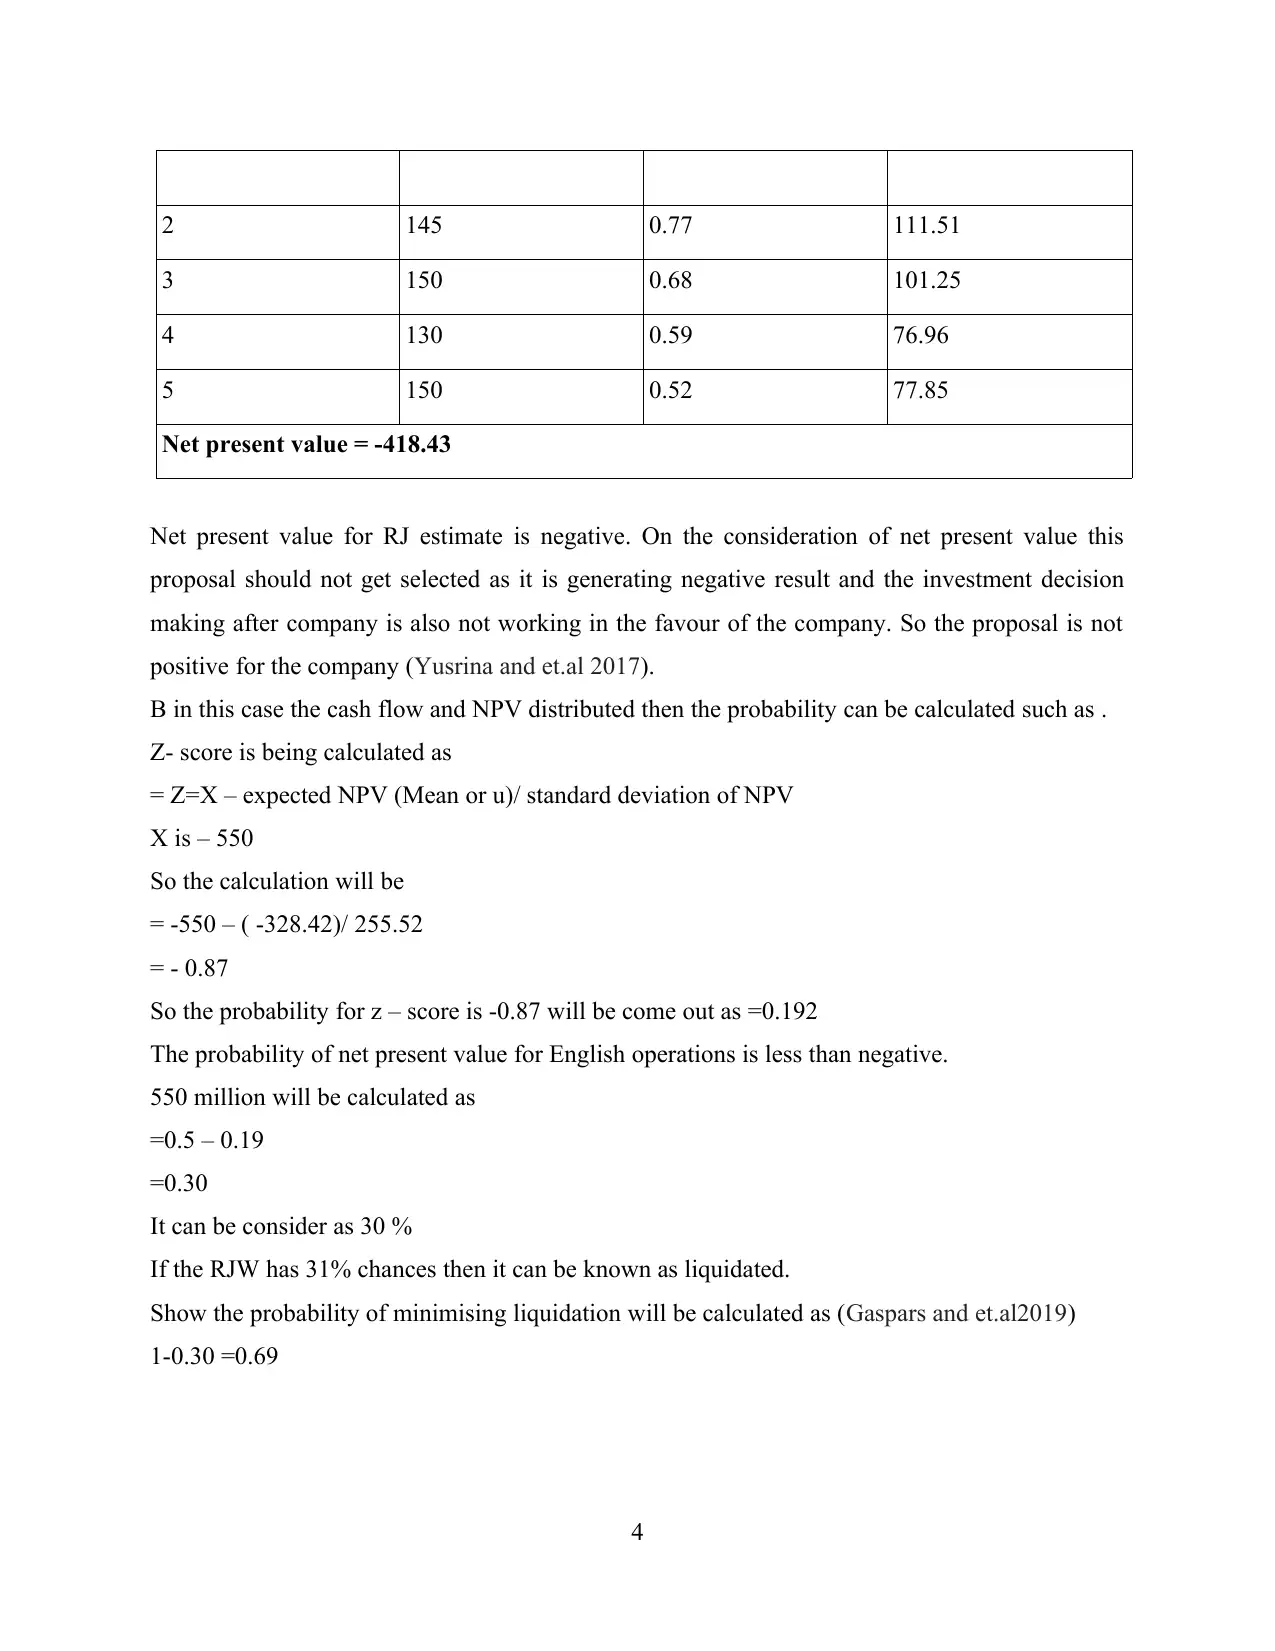
2 145 0.77 111.51
3 150 0.68 101.25
4 130 0.59 76.96
5 150 0.52 77.85
Net present value = -418.43
Net present value for RJ estimate is negative. On the consideration of net present value this
proposal should not get selected as it is generating negative result and the investment decision
making after company is also not working in the favour of the company. So the proposal is not
positive for the company (Yusrina and et.al 2017).
B in this case the cash flow and NPV distributed then the probability can be calculated such as .
Z- score is being calculated as
= Z=X – expected NPV (Mean or u)/ standard deviation of NPV
X is – 550
So the calculation will be
= -550 – ( -328.42)/ 255.52
= - 0.87
So the probability for z – score is -0.87 will be come out as =0.192
The probability of net present value for English operations is less than negative.
550 million will be calculated as
=0.5 – 0.19
=0.30
It can be consider as 30 %
If the RJW has 31% chances then it can be known as liquidated.
Show the probability of minimising liquidation will be calculated as (Gaspars and et.al2019)
1-0.30 =0.69
4
⊘ This is a preview!⊘
Do you want full access?
Subscribe today to unlock all pages.
Trusted by 1+ million students worldwide
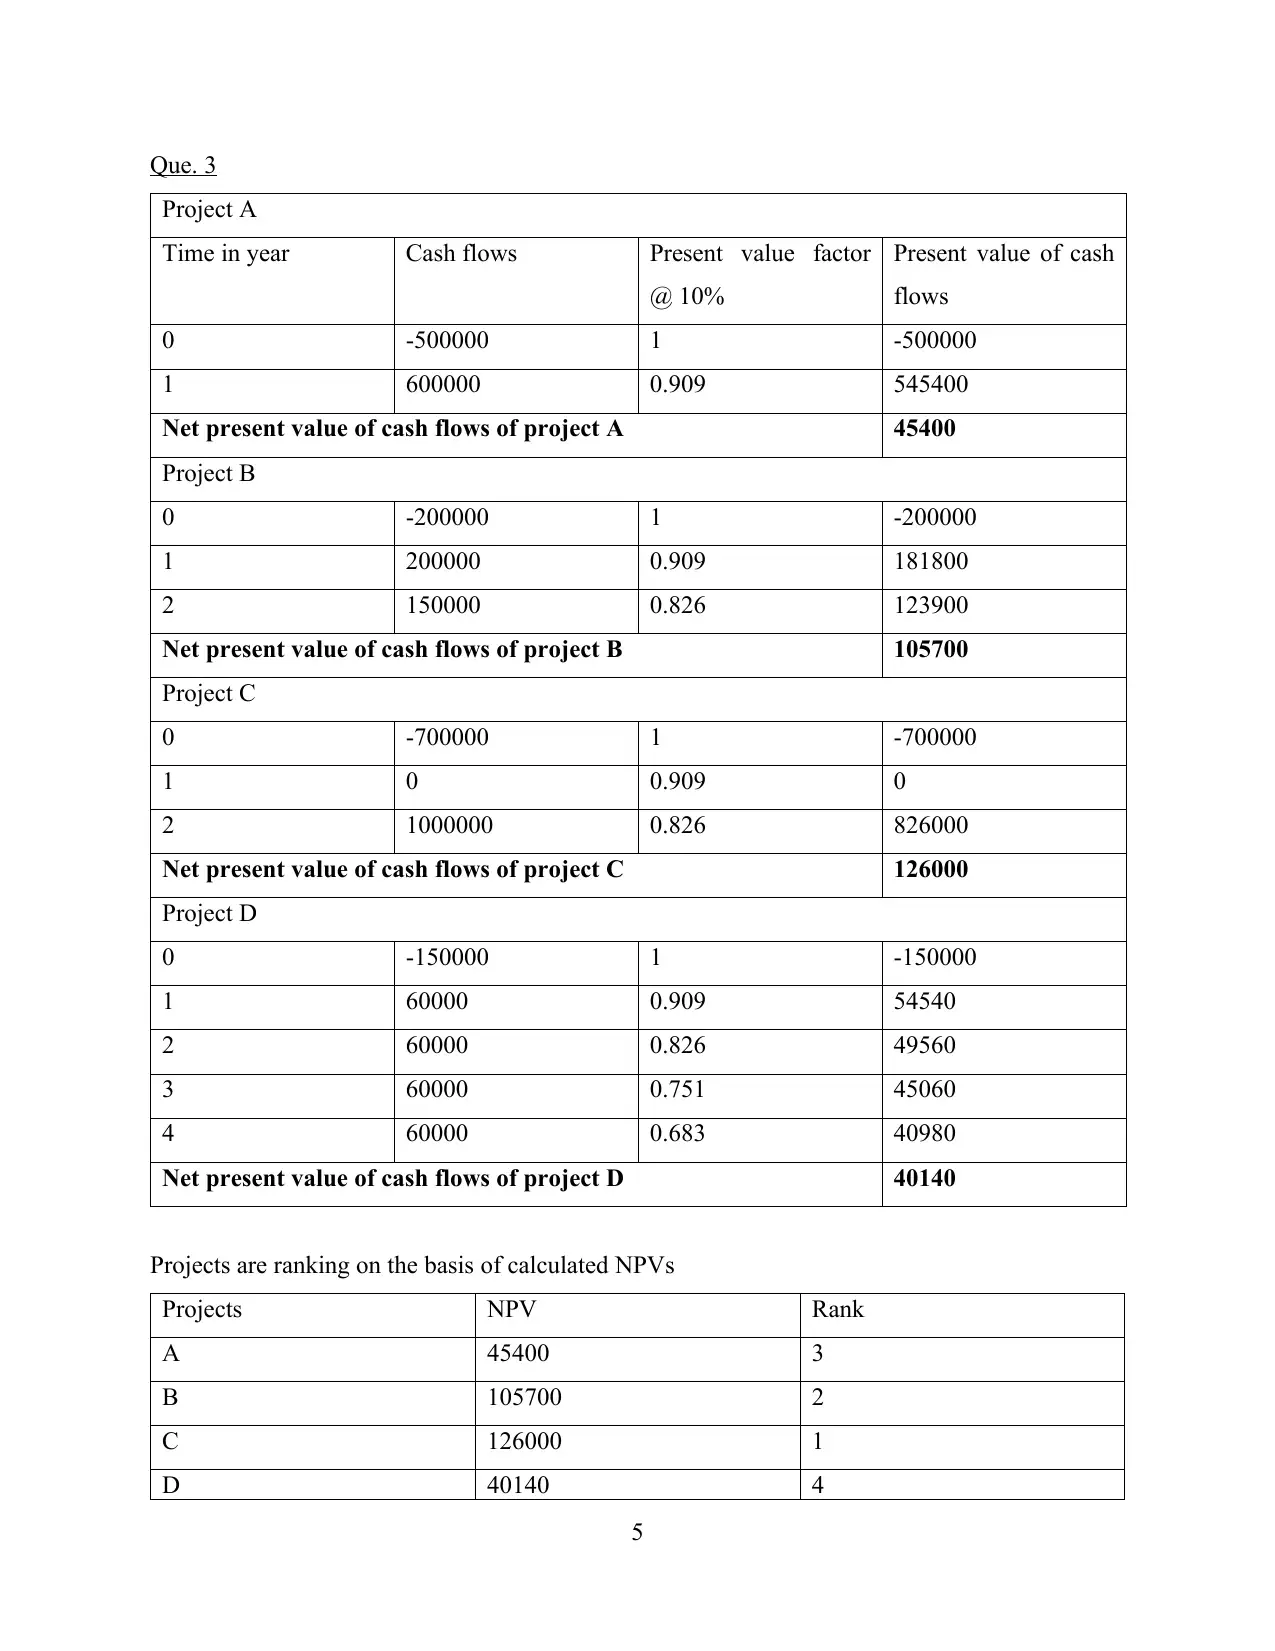
Que. 3
Project A
Time in year Cash flows Present value factor
@ 10%
Present value of cash
flows
0 -500000 1 -500000
1 600000 0.909 545400
Net present value of cash flows of project A 45400
Project B
0 -200000 1 -200000
1 200000 0.909 181800
2 150000 0.826 123900
Net present value of cash flows of project B 105700
Project C
0 -700000 1 -700000
1 0 0.909 0
2 1000000 0.826 826000
Net present value of cash flows of project C 126000
Project D
0 -150000 1 -150000
1 60000 0.909 54540
2 60000 0.826 49560
3 60000 0.751 45060
4 60000 0.683 40980
Net present value of cash flows of project D 40140
Projects are ranking on the basis of calculated NPVs
Projects NPV Rank
A 45400 3
B 105700 2
C 126000 1
D 40140 4
5
Paraphrase This Document
Need a fresh take? Get an instant paraphrase of this document with our AI Paraphraser
b. net present value superior to internal rate of return for appraisal of the project.
The reason that why NPV is said to be superior as compare to IRR is because it helps in ranking
the projects with cash flows with different time period so that state can be identified so that most
profitable investment proposal can be selected. Other reason that why NPV is said to be better
than IRR is it helps in discounting the cash flows of different years on separate discounted rates
and this all can be done without facing any issues (Jinaduand et.al., 2017). The another
advantage of NPV is that many discounted rate can be calculated via net present value technique
and this system is not present in IRR tool. In this complex business climate it is necessary to get
more discounted rate which helps in making business more flexible and also help company to
select correct investment proposal.
The decision making technique is also vital when comes to make the investment decisions. NPV
tool handles all the factor and also finds out the level of inflow which is based on the project life.
The discounting rate of return and to reinvest both are same for IRR but as per the NPV tool
both are different (Moşteanu and Faccia, 2020). Every factor in the financial management can
influence the decisions making in context of investment in the project.
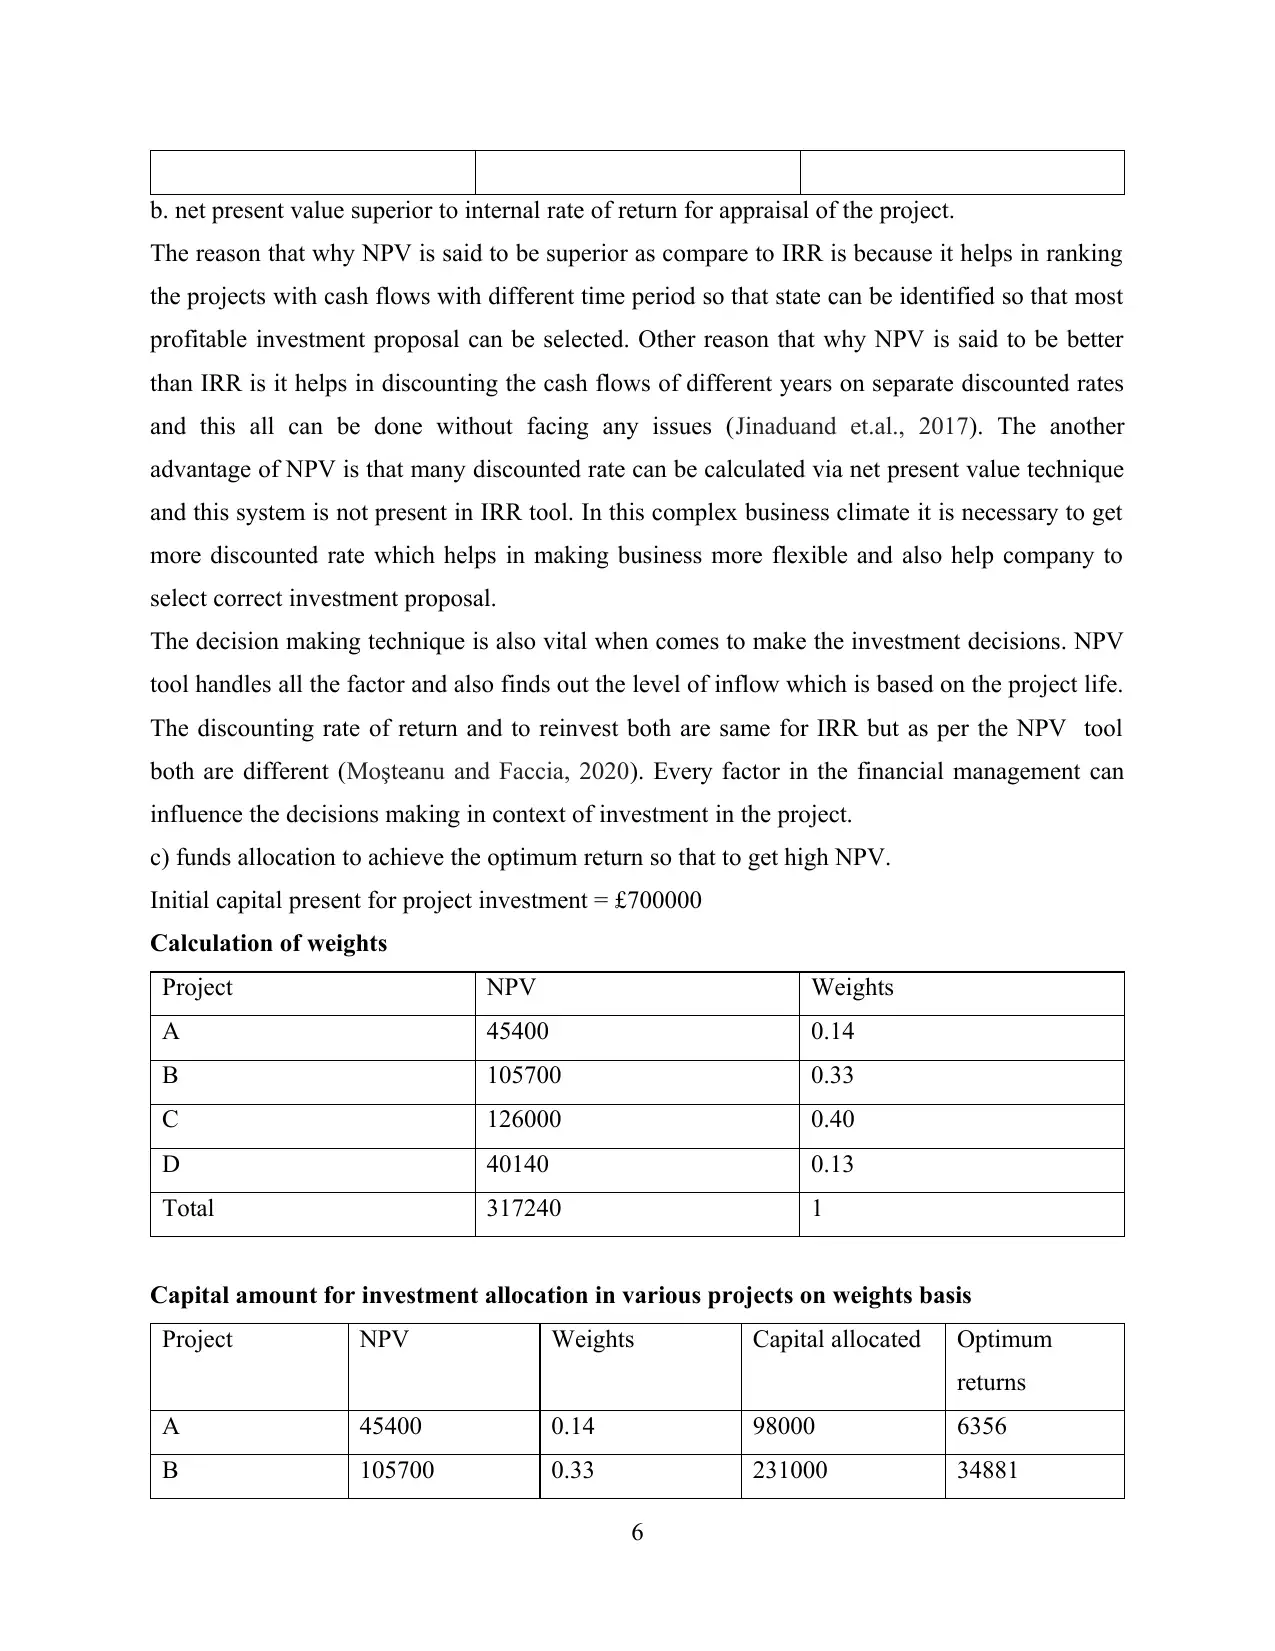
c) funds allocation to achieve the optimum return so that to get high NPV.
Initial capital present for project investment = £700000
Calculation of weights
Project NPV Weights
A 45400 0.14
B 105700 0.33
C 126000 0.40
D 40140 0.13
Total 317240 1
Capital amount for investment allocation in various projects on weights basis
Project NPV Weights Capital allocated Optimum
returns
A 45400 0.14 98000 6356
B 105700 0.33 231000 34881
6
The reason that why NPV is said to be superior as compare to IRR is because it helps in ranking
the projects with cash flows with different time period so that state can be identified so that most
profitable investment proposal can be selected. Other reason that why NPV is said to be better
than IRR is it helps in discounting the cash flows of different years on separate discounted rates
and this all can be done without facing any issues (Jinaduand et.al., 2017). The another
advantage of NPV is that many discounted rate can be calculated via net present value technique
and this system is not present in IRR tool. In this complex business climate it is necessary to get
more discounted rate which helps in making business more flexible and also help company to
select correct investment proposal.
The decision making technique is also vital when comes to make the investment decisions. NPV
tool handles all the factor and also finds out the level of inflow which is based on the project life.
The discounting rate of return and to reinvest both are same for IRR but as per the NPV tool
both are different (Moşteanu and Faccia, 2020). Every factor in the financial management can
influence the decisions making in context of investment in the project.
c) funds allocation to achieve the optimum return so that to get high NPV.
Initial capital present for project investment = £700000
Calculation of weights
Project NPV Weights
A 45400 0.14
B 105700 0.33
C 126000 0.40
D 40140 0.13
Total 317240 1
Capital amount for investment allocation in various projects on weights basis
Project NPV Weights Capital allocated Optimum
returns
A 45400 0.14 98000 6356
B 105700 0.33 231000 34881
6
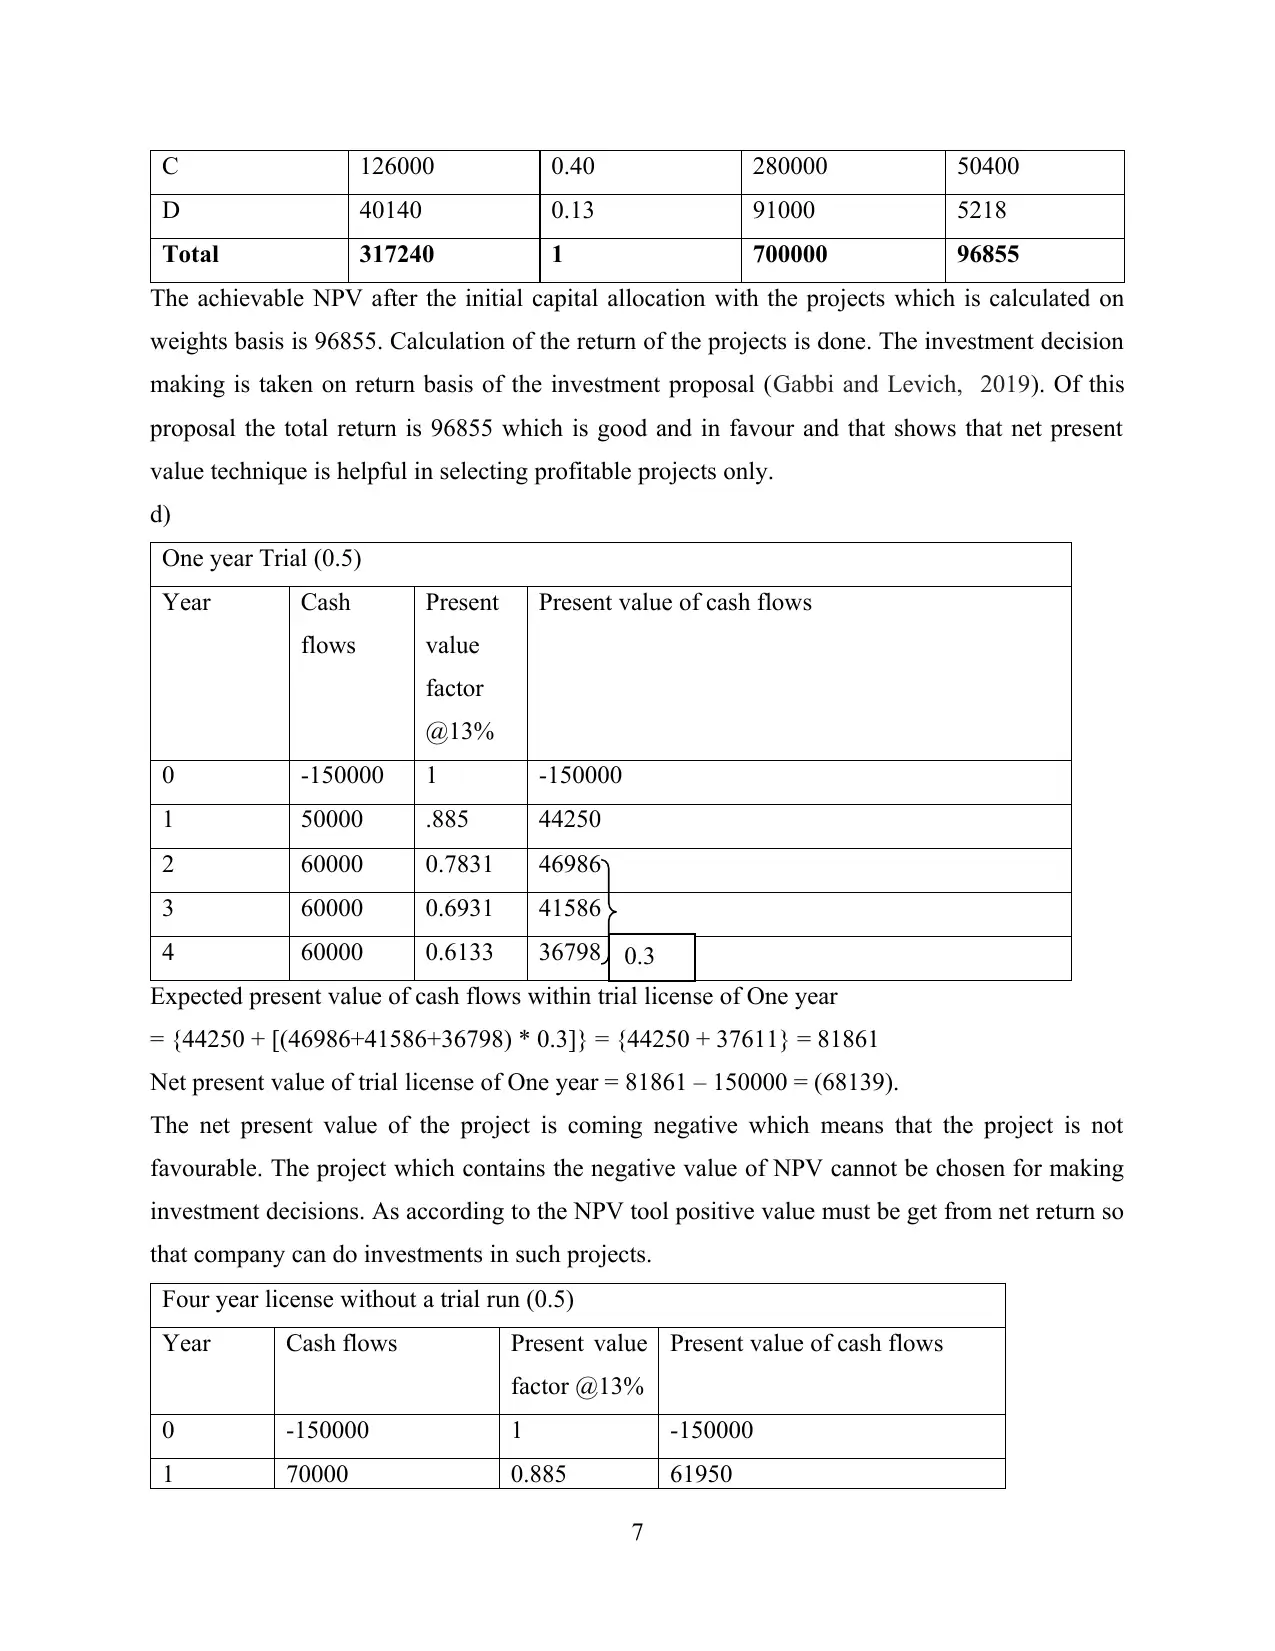
C 126000 0.40 280000 50400
D 40140 0.13 91000 5218
Total 317240 1 700000 96855
The achievable NPV after the initial capital allocation with the projects which is calculated on
weights basis is 96855. Calculation of the return of the projects is done. The investment decision
making is taken on return basis of the investment proposal (Gabbi and Levich, 2019). Of this
proposal the total return is 96855 which is good and in favour and that shows that net present
value technique is helpful in selecting profitable projects only.
d)
One year Trial (0.5)
Year Cash
flows
Present
value
factor
@13%
Present value of cash flows
0 -150000 1 -150000
1 50000 .885 44250
2 60000 0.7831 46986
3 60000 0.6931 41586
4 60000 0.6133 36798
Expected present value of cash flows within trial license of One year
= {44250 + [(46986+41586+36798) * 0.3]} = {44250 + 37611} = 81861
Net present value of trial license of One year = 81861 – 150000 = (68139).
The net present value of the project is coming negative which means that the project is not
favourable. The project which contains the negative value of NPV cannot be chosen for making
investment decisions. As according to the NPV tool positive value must be get from net return so
that company can do investments in such projects.
Four year license without a trial run (0.5)
Year Cash flows Present value
factor @13%
Present value of cash flows
0 -150000 1 -150000
1 70000 0.885 61950
7
0.3
⊘ This is a preview!⊘
Do you want full access?
Subscribe today to unlock all pages.
Trusted by 1+ million students worldwide
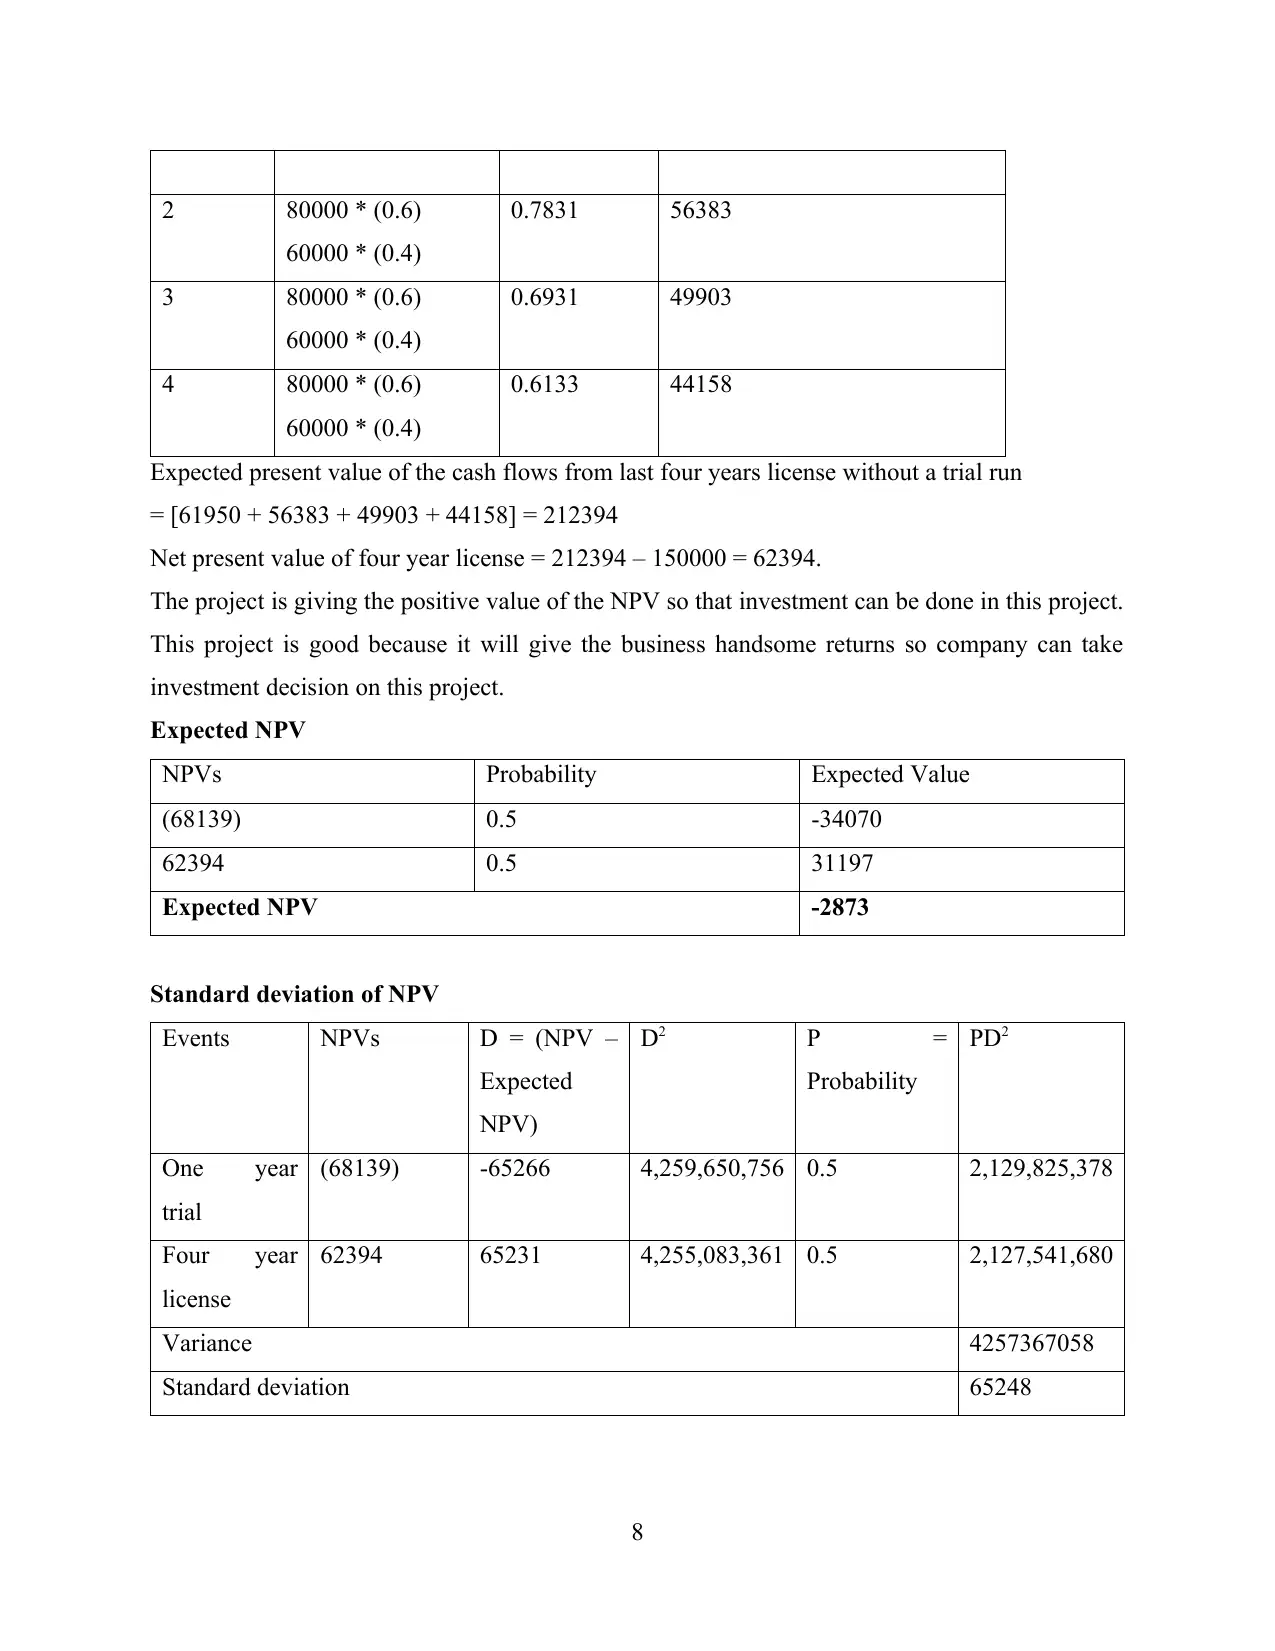
2 80000 * (0.6)
60000 * (0.4)
0.7831 56383
3 80000 * (0.6)
60000 * (0.4)
0.6931 49903
4 80000 * (0.6)
60000 * (0.4)
0.6133 44158
Expected present value of the cash flows from last four years license without a trial run
= [61950 + 56383 + 49903 + 44158] = 212394
Net present value of four year license = 212394 – 150000 = 62394.
The project is giving the positive value of the NPV so that investment can be done in this project.
This project is good because it will give the business handsome returns so company can take
investment decision on this project.
Expected NPV
NPVs Probability Expected Value
(68139) 0.5 -34070
62394 0.5 31197
Expected NPV -2873
Standard deviation of NPV
Events NPVs D = (NPV –
Expected
NPV)
D2 P =
Probability
PD2
One year
trial
(68139) -65266 4,259,650,756 0.5 2,129,825,378
Four year
license
62394 65231 4,255,083,361 0.5 2,127,541,680
Variance 4257367058
Standard deviation 65248
8
60000 * (0.4)
0.7831 56383
3 80000 * (0.6)
60000 * (0.4)
0.6931 49903
4 80000 * (0.6)
60000 * (0.4)
0.6133 44158
Expected present value of the cash flows from last four years license without a trial run
= [61950 + 56383 + 49903 + 44158] = 212394
Net present value of four year license = 212394 – 150000 = 62394.
The project is giving the positive value of the NPV so that investment can be done in this project.
This project is good because it will give the business handsome returns so company can take
investment decision on this project.
Expected NPV
NPVs Probability Expected Value
(68139) 0.5 -34070
62394 0.5 31197
Expected NPV -2873
Standard deviation of NPV
Events NPVs D = (NPV –
Expected
NPV)
D2 P =
Probability
PD2
One year
trial
(68139) -65266 4,259,650,756 0.5 2,129,825,378
Four year
license
62394 65231 4,255,083,361 0.5 2,127,541,680
Variance 4257367058
Standard deviation 65248
8
Paraphrase This Document
Need a fresh take? Get an instant paraphrase of this document with our AI Paraphraser

Calculation of z-score, where all the values below 0 will results in negative NPV. So, here X is
equals to 0.
Z – Score = 0 – expected NPV / standard deviation of NPV = 0 – (-2873) / 65248 = 2873 / 65248
= 0.044.
Probability of negative NPV from 0 till Expected NPV = 0.017548 or 1.7548 %.
So, Probability of negative NPV = 0.5 + 0.017548 = 0.5175 or 51.75%.
Each and every project involve factors of negative NPV which shows that investment decisions
cannot be made and if company has made investment decisionsthan it will be critical to handle
and there are chances to face losses by the business. Negative value will show that business will
not able to earn anything while investing in the project. So business should evaluate every
project carefully before making investments (Lane and Milesi-Ferretti, 2017). That is why net
present value is important because it provide the exact picture of the project and on the basis of it
business will decide to invest or not.
9
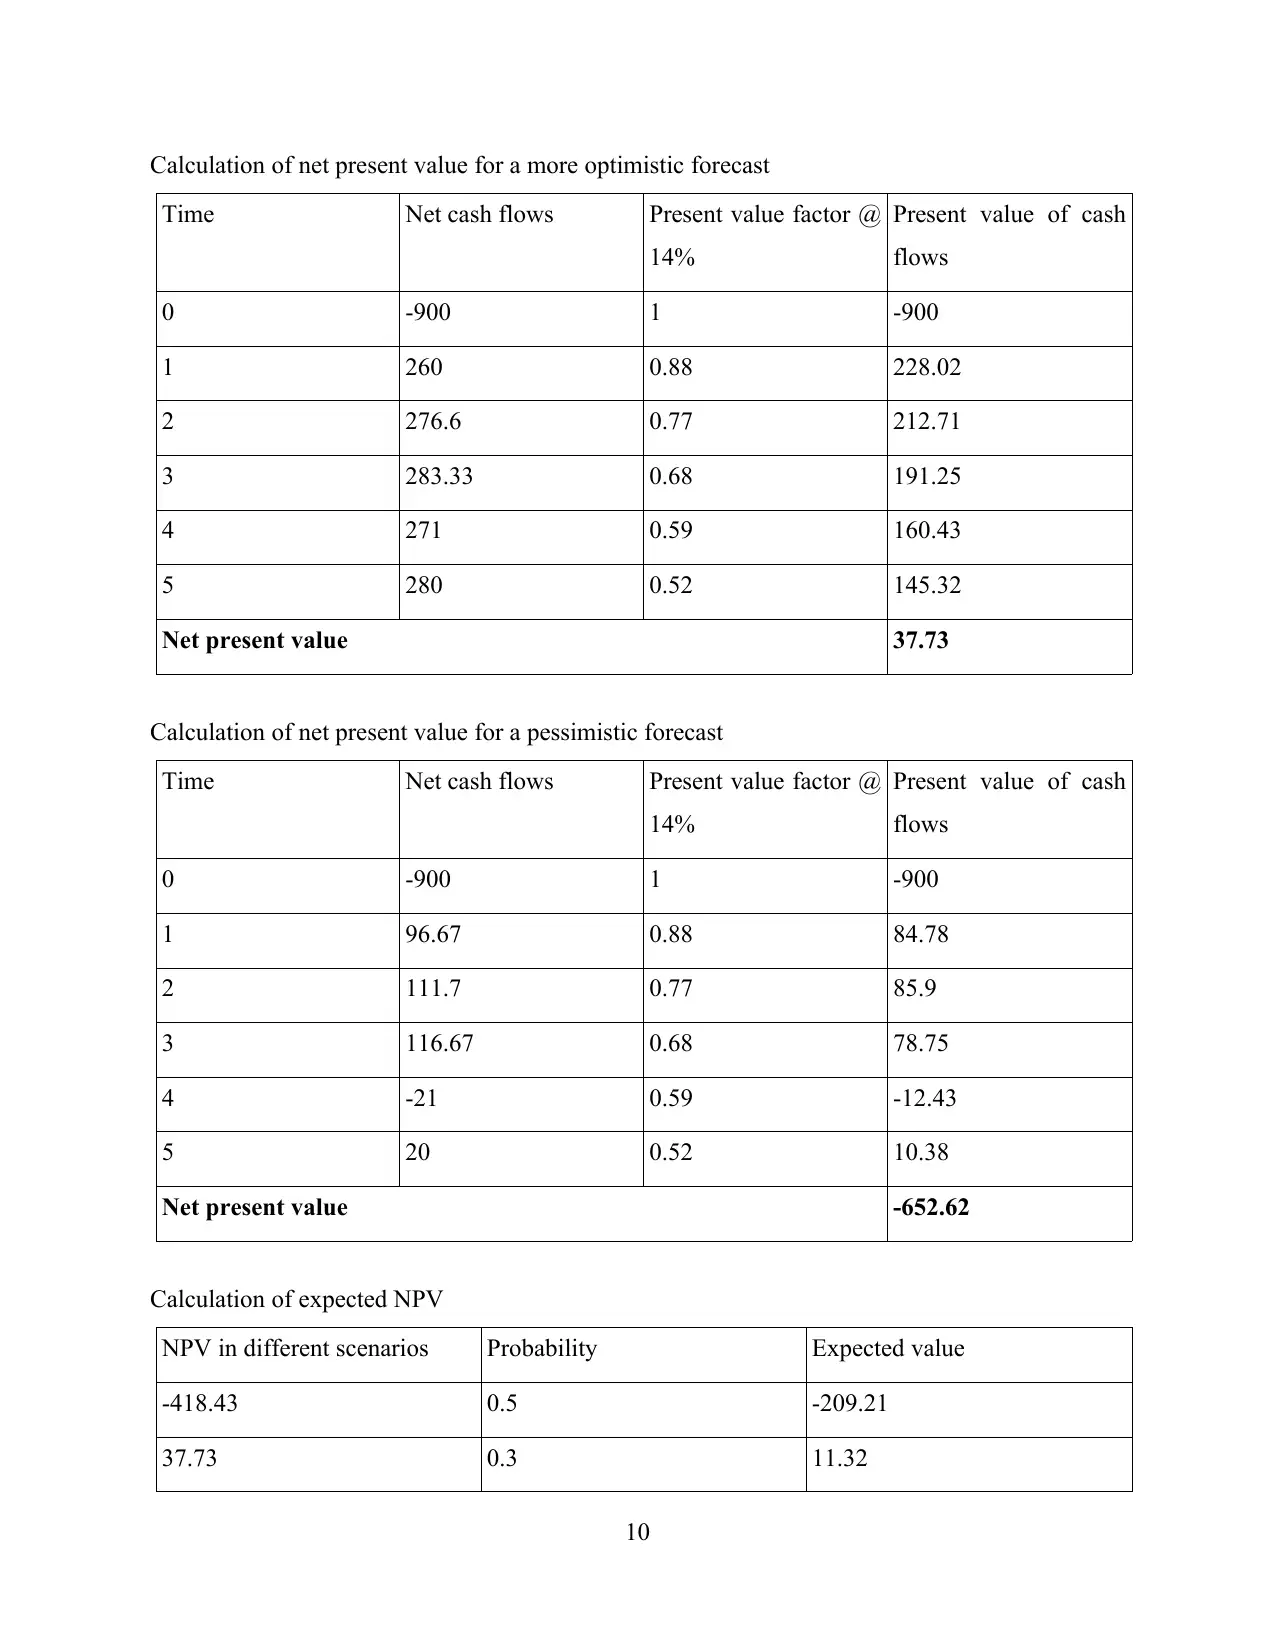
Calculation of net present value for a more optimistic forecast
Time Net cash flows Present value factor @
14%
Present value of cash
flows
0 -900 1 -900
1 260 0.88 228.02
2 276.6 0.77 212.71
3 283.33 0.68 191.25
4 271 0.59 160.43
5 280 0.52 145.32
Net present value 37.73
Calculation of net present value for a pessimistic forecast
Time Net cash flows Present value factor @
14%
Present value of cash
flows
0 -900 1 -900
1 96.67 0.88 84.78
2 111.7 0.77 85.9
3 116.67 0.68 78.75
4 -21 0.59 -12.43
5 20 0.52 10.38
Net present value -652.62
Calculation of expected NPV
NPV in different scenarios Probability Expected value
-418.43 0.5 -209.21
37.73 0.3 11.32
10
Time Net cash flows Present value factor @
14%
Present value of cash
flows
0 -900 1 -900
1 260 0.88 228.02
2 276.6 0.77 212.71
3 283.33 0.68 191.25
4 271 0.59 160.43
5 280 0.52 145.32
Net present value 37.73
Calculation of net present value for a pessimistic forecast
Time Net cash flows Present value factor @
14%
Present value of cash
flows
0 -900 1 -900
1 96.67 0.88 84.78
2 111.7 0.77 85.9
3 116.67 0.68 78.75
4 -21 0.59 -12.43
5 20 0.52 10.38
Net present value -652.62
Calculation of expected NPV
NPV in different scenarios Probability Expected value
-418.43 0.5 -209.21
37.73 0.3 11.32
10
⊘ This is a preview!⊘
Do you want full access?
Subscribe today to unlock all pages.
Trusted by 1+ million students worldwide
1 out of 16
Related Documents


![International Finance Management Assignment - Finance [Course Code]](/_next/image/?url=https%3A%2F%2Fdesklib.com%2Fmedia%2Fimages%2Ffd%2F69271dad5c5f4f2c8ab93e7e6daf77ee.jpg&w=256&q=75)

Your All-in-One AI-Powered Toolkit for Academic Success.
+13062052269
info@desklib.com
Available 24*7 on WhatsApp / Email
![[object Object]](/_next/static/media/star-bottom.7253800d.svg)
Unlock your academic potential
Copyright © 2020–2026 A2Z Services. All Rights Reserved. Developed and managed by ZUCOL.