Comprehensive Analysis of International Finance Portfolio Performance

Verified

Added on  2020/05/28

|18
|2337
|28
Project
AI Summary
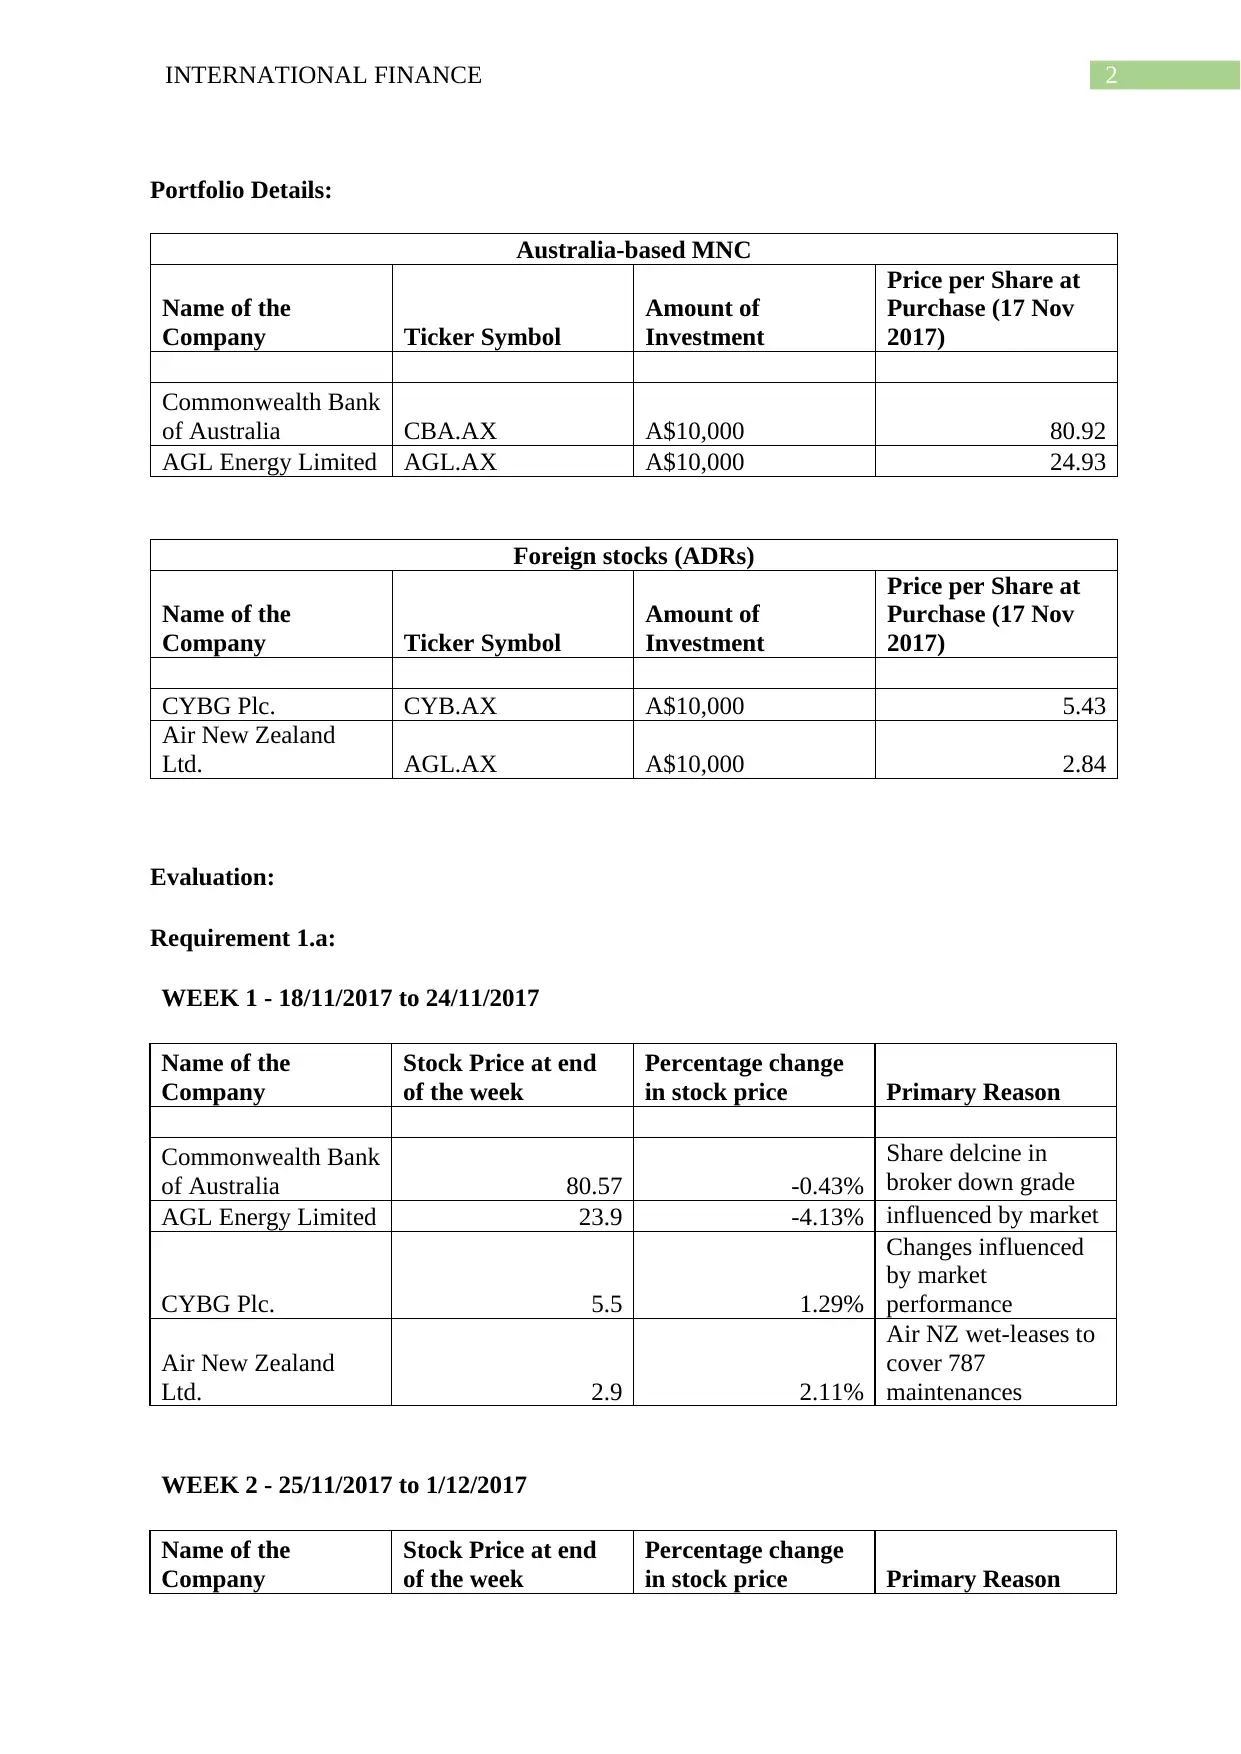
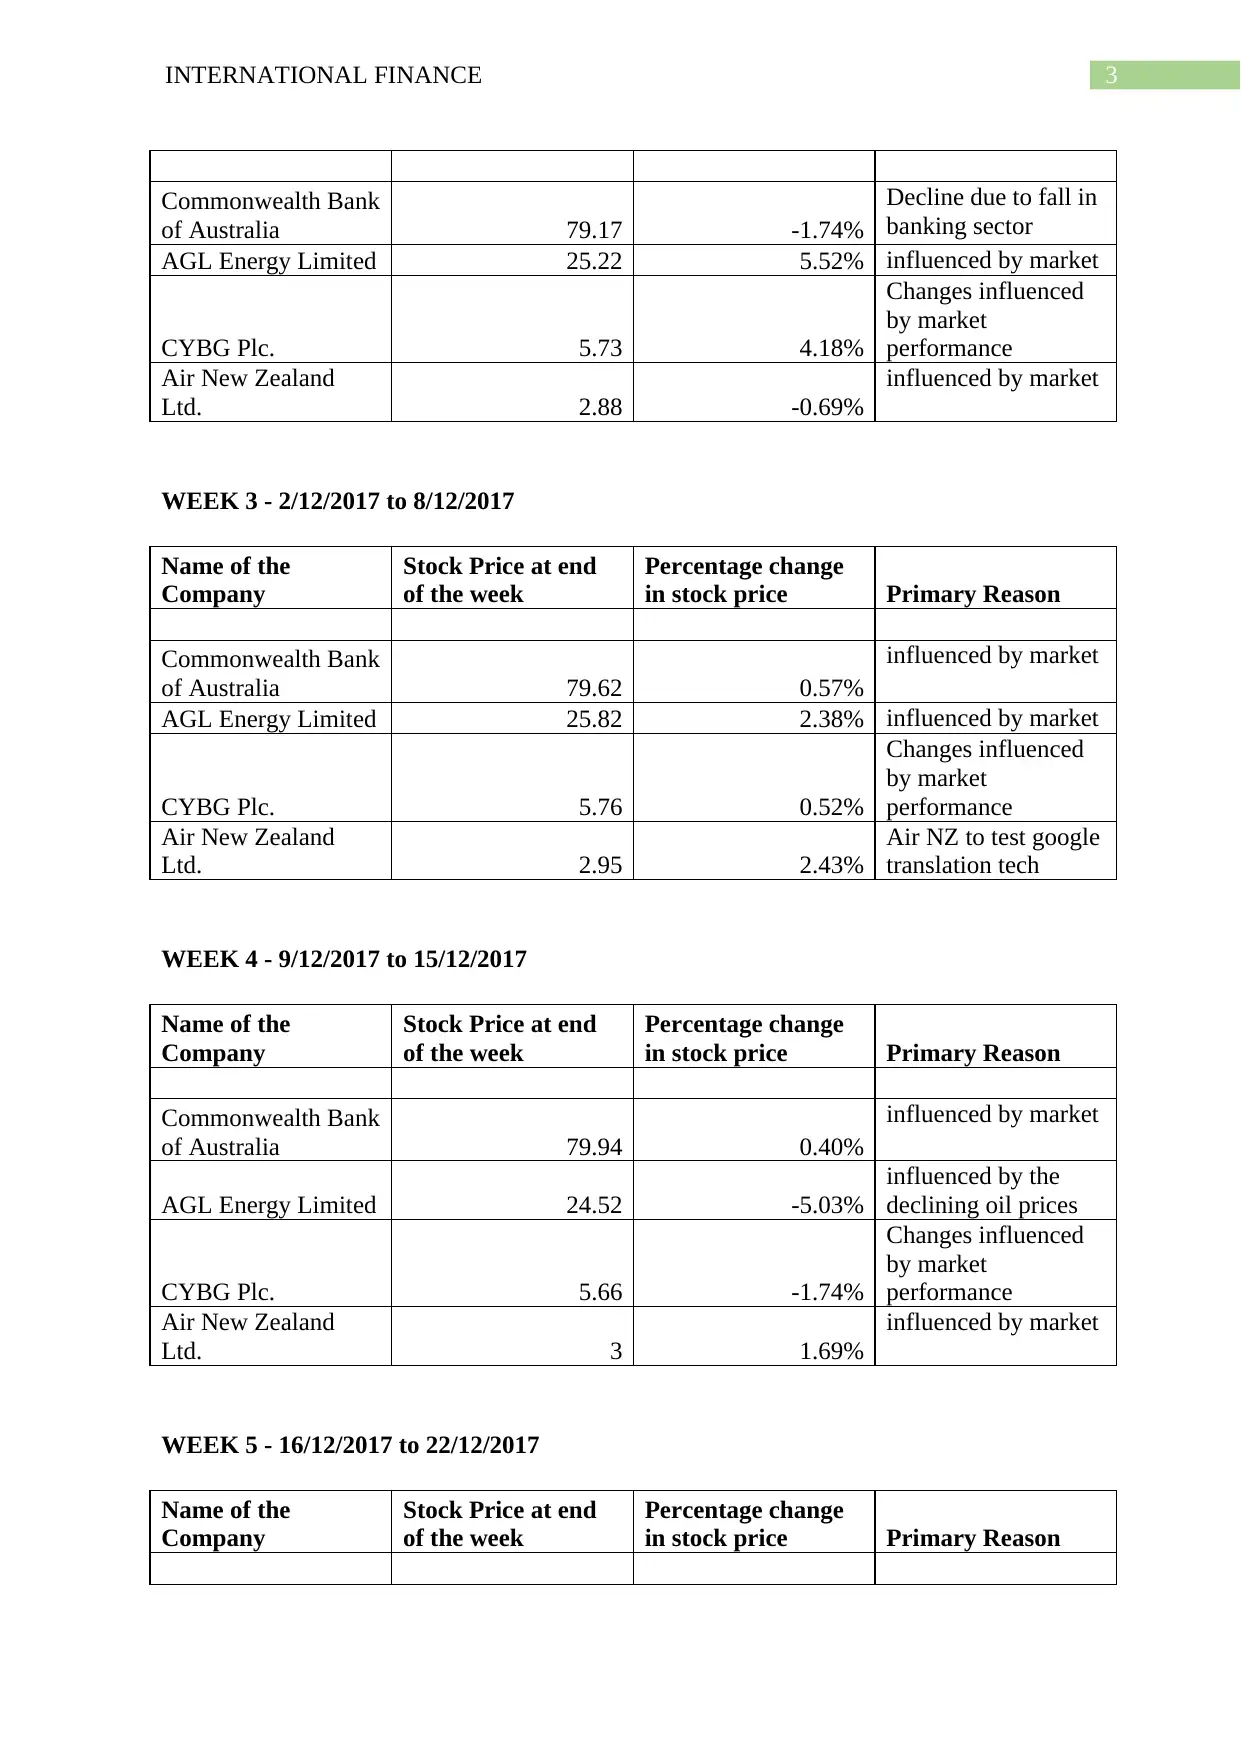
This project provides a comprehensive analysis of an international finance portfolio, focusing on the performance of investments in Australian and foreign stocks. The student evaluated the performance of four companies: Commonwealth Bank of Australia, AGL Energy Limited, CYBG Plc., and Air New Zealand Ltd. over a ten-week period, tracking stock prices and identifying primary reasons for price fluctuations. The analysis includes comparisons of stock performance with relevant market indices (Australian, New Zealand, and UK) and examines the impact of currency fluctuations (AUD, USD, GBP, and New Zealand Dollar) on the investments. The project calculates portfolio returns, identifies correlations between stocks, and assesses the influence of market and currency factors on investment outcomes. The student also provides a detailed breakdown of the factors affecting stock prices and overall portfolio performance, with references to relevant financial literature and market data.
Document Page
Running head: INTERNATIONAL FINANCE
International Finance
Name of the Student:
Name of the University:
Author’s Note:
tabler-icon-diamond-filled.svg

Paraphrase This Document

Need a fresh take? Get an instant paraphrase of this document with our AI Paraphraser
Document Page
1INTERNATIONAL FINANCE
Table of Contents
Portfolio Details:........................................................................................................................2
Evaluation:.................................................................................................................................2
Requirement 1.a:....................................................................................................................2
Requirement 1.b:....................................................................................................................6
Requirement 2:.......................................................................................................................6
Requirement 3.a:....................................................................................................................8
Requirement 3.b:....................................................................................................................9
Requirement 3.c:..................................................................................................................10
Requirement 4.a:..................................................................................................................11
Requirement 4.b:..................................................................................................................12
Requirement 5.a:..................................................................................................................13
Requirement 5.b:..................................................................................................................14
Reference and Bibliography:....................................................................................................15
Document Page
2INTERNATIONAL FINANCE
Portfolio Details:
Australia-based MNC
Name of the
Company Ticker Symbol
Amount of
Investment
Price per Share at
Purchase (17 Nov
2017)
Commonwealth Bank
of Australia CBA.AX A$10,000 80.92
AGL Energy Limited AGL.AX A$10,000 24.93
Foreign stocks (ADRs)
Name of the
Company Ticker Symbol
Amount of
Investment
Price per Share at
Purchase (17 Nov
2017)
CYBG Plc. CYB.AX A$10,000 5.43
Air New Zealand
Ltd. AGL.AX A$10,000 2.84
Evaluation:
Requirement 1.a:
WEEK 1 - 18/11/2017 to 24/11/2017
Name of the
Company
Stock Price at end
of the week
Percentage change
in stock price Primary Reason
Commonwealth Bank
of Australia 80.57 -0.43%
Share delcine in
broker down grade
AGL Energy Limited 23.9 -4.13% influenced by market
CYBG Plc. 5.5 1.29%
Changes influenced
by market
performance
Air New Zealand
Ltd. 2.9 2.11%
Air NZ wet-leases to
cover 787
maintenances
WEEK 2 - 25/11/2017 to 1/12/2017
Name of the
Company
Stock Price at end
of the week
Percentage change
in stock price Primary Reason
Document Page
3INTERNATIONAL FINANCE
Commonwealth Bank
of Australia 79.17 -1.74%
Decline due to fall in
banking sector
AGL Energy Limited 25.22 5.52% influenced by market
CYBG Plc. 5.73 4.18%
Changes influenced
by market
performance
Air New Zealand
Ltd. 2.88 -0.69%
influenced by market
WEEK 3 - 2/12/2017 to 8/12/2017
Name of the
Company
Stock Price at end
of the week
Percentage change
in stock price Primary Reason
Commonwealth Bank
of Australia 79.62 0.57%
influenced by market
AGL Energy Limited 25.82 2.38% influenced by market
CYBG Plc. 5.76 0.52%
Changes influenced
by market
performance
Air New Zealand
Ltd. 2.95 2.43%
Air NZ to test google
translation tech
WEEK 4 - 9/12/2017 to 15/12/2017
Name of the
Company
Stock Price at end
of the week
Percentage change
in stock price Primary Reason
Commonwealth Bank
of Australia 79.94 0.40%
influenced by market
AGL Energy Limited 24.52 -5.03%
influenced by the
declining oil prices
CYBG Plc. 5.66 -1.74%
Changes influenced
by market
performance
Air New Zealand
Ltd. 3 1.69%
influenced by market
WEEK 5 - 16/12/2017 to 22/12/2017
Name of the
Company
Stock Price at end
of the week
Percentage change
in stock price Primary Reason
tabler-icon-diamond-filled.svg

Paraphrase This Document

Need a fresh take? Get an instant paraphrase of this document with our AI Paraphraser
Document Page
4INTERNATIONAL FINANCE
Commonwealth Bank
of Australia 80.39 0.56%
influenced by market
AGL Energy Limited 24.39 -0.53%
influenced by the
market
CYBG Plc. 5.8 2.47%
Changes influenced
by market
performance
Air New Zealand
Ltd. 2.93 -2.33%
Decline due to
increment in oil
prices
WEEK 6 - 23/12/2017 to 29/12/2017
Name of the
Company
Stock Price at end
of the week
Percentage change
in stock price Primary Reason
Commonwealth Bank
of Australia 80.34 -0.06%
Ausi banks blocking
bitcoin transfers
AGL Energy Limited 24.36 -0.12%
influenced by the
market
CYBG Plc. 5.79 -0.17%
Changes influenced
by market
performance
Air New Zealand
Ltd. 2.89 -1.37%
influenced by the
market
WEEK 7 - 30/12/2017 to 5/1/2018
Name of the
Company
Stock Price at end
of the week
Percentage change
in stock price Primary Reason
Commonwealth Bank
of Australia 81.16 1.02%
Increment due to
successful low cost
funding via tier
bonds
AGL Energy Limited 24.32 -0.16%
influenced by the
market
CYBG Plc. 5.64 -2.59%
Changes influenced
by market
performance
Air New Zealand
Ltd. 2.88 -0.35%
influenced by the
market
WEEK 8 - 6/1/2018 to 12/1/2018
Document Page
5INTERNATIONAL FINANCE
Name of the
Company
Stock Price at end
of the week
Percentage change
in stock price Primary Reason
Commonwealth Bank
of Australia 80.88 -0.34%
influenced by the
market
AGL Energy Limited 24.25 -0.29%
influenced by the
market
CYBG Plc. 5.56 -1.42%
Changes influenced
by market
performance
Air New Zealand
Ltd. 2.76 -4.17%
influenced by the
market
WEEK 9 - 13/1/2018 to 19/1/2018
Name of the
Company
Stock Price at end
of the week
Percentage change
in stock price Primary Reason
Commonwealth Bank
of Australia 79.83 -1.30%
Rate rigging by the
bank
AGL Energy Limited 23.67 -2.39%
UBS downgrades of
two stock after their
30% surge in 2
months
CYBG Plc. 5.76 3.60%
Changes influenced
by market
performance
Air New Zealand
Ltd. 2.68 -2.90%
influenced by the
market
WEEK 10 - 20/1/2018 to 26/1/2018
Name of the
Company
Stock Price at end
of the week
Percentage change
in stock price Primary Reason
Commonwealth Bank
of Australia
78.65 -1.48% Rate rigging by the
bank
AGL Energy Limited
23.47 -0.84% influenced by the
market
CYBG Plc.
5.72 -0.69% Changes influenced
by market
performance
Air New Zealand
Ltd.
2.7 0.75% Air NZ to experiment
with translation tech
Document Page
6INTERNATIONAL FINANCE
Requirement 1.b:
PORTFOLIO RETURN:
Name of the
Company
Ticker
Symbol
Opening
Value
Closin
g
Value
Opening
Portfolio
Value
Portfoli
o
Return
Closing
Portfolio
Value
Return
in %
Commonwealth
Bank of Australia CBA.AX $ 80.92 $ 78.65
$
10,000.00
($
280.52) $ 9,719.48 -2.81%
AGL Energy
Limited AGL.AX $ 24.93 $ 23.47
$
10,000.00
($
585.64) $ 9,414.36 -5.86%
CYBG Plc. CYB.AX $ 5.43 $ 5.72
$
10,000.00 $ 534.07
$
10,534.07 5.34%
Air New Zealand
Ltd. AGL.AX $ 2.84 $ 2.70
$
10,000.00
($
492.96) $ 9,507.04 -4.93%
TOTAL
$
40,000.00
($
825.05)
$
39,174.95 -8.25%
The above table mainly indicates the overall return that is provided by the created
portfolio. However, portfolio mainly provided a negative return of -8.25%, which is due to
the problems in selecting the overall stocks. On the other hand, other students mainly got the
overall return of 20.37% and 171.22%, which depicts effectiveness of the portfolio. The
diversified returns provided by the portfolio is mainly due to market conditions, which
influenced the return provided from investment.
Requirement 2:
tabler-icon-diamond-filled.svg

Paraphrase This Document

Need a fresh take? Get an instant paraphrase of this document with our AI Paraphraser
Document Page
7INTERNATIONAL FINANCE
Figure 1: Comparison between CBA and Australian market1
From the overall evaluation of the above figure it is detected that share price
movement of the company is mainly influenced by the market. The pattern of the share price
and Australian index are relatively same. However, the returns provided by the company is
relatively higher than the Australian index. Thus, it could be understood that the Australian
market drives the returns of the company
Figure 2: Comparison between AGL and Australian market2
The overall share price movement of AGL is relatively not synchronized with the
Australian market, which is adequately depicted in the above figure. In addition, the
companies share price is relatively volatile in comparison to the Australian index. Therefore,
it could be understood that share price movement of AGL is not influenced by the Australian
market.
1 CBA.AX Interactive Chart | CWLTH BANK FPO Stock Yahoo Finance (2018)
Au.finance.yahoo.com <https://au.finance.yahoo.com/quote/CBA.AX/chart?p=CBA.AX=>
2 AGL.AX Interactive Chart | AGL ENERGY FPO Stock Yahoo Finance (2018)
Au.finance.yahoo.com <https://au.finance.yahoo.com/quote/AGL.AX/chart?>
Document Page
8INTERNATIONAL FINANCE
Requirement 3.a:
Figure 3: Comparison between AIZ and New Zealand index3
From the evaluation it could be understood that stock price pf AIZ is not influenced
by the New Zealand index. Hence, it is detected that increment in value of New Zealand
index is not complemented with the AIZ share price, instead the company share value are
falling. This directly indicates that the share price of AIZ is not driven by the New Zealand
index.
Figure 4: Comparison between CYB and UK index4
3 AIZ.AX Interactive Chart | AIR N.Z. FPO NZX Stock Yahoo Finance (2018)
Au.finance.yahoo.com <https://au.finance.yahoo.com/quote/AIZ.AX/chart?p=AIZ.AX=>
Document Page
9INTERNATIONAL FINANCE
The evaluation of above figure indicates the overall linkage between CYB and UK
index, where the company operates. There is no linkage between the UK index and CYB, as
share price value of CYB is relatively volatile in comparison to the FTSE 100. Thus, the
share price movement of CYB is not influenced by UK capital market.
Requirement 3.b:
Figure 5: Comparison between CYB and AIZ56
The negative correlation between CYB and AIZ is mainly detected from the overall
figure, where rising value of CYB was not complemented by AIZ share price. In addition,
when value of AIZ rose the value of CYB declined and vice versa. This directly indicates the
negative correlation between both the stocks.
4 CYB.AX Interactive Chart | CYBG PLC CDI 1:1 Stock Yahoo Finance (2018)
Au.finance.yahoo.com <https://au.finance.yahoo.com/quote/CYB.AX/chart?p=CYB.AX=>
5 CYB.AX Interactive Chart | CYBG PLC CDI 1:1 Stock Yahoo Finance (2018)
Au.finance.yahoo.com <https://au.finance.yahoo.com/quote/CYB.AX/chart?p=CYB.AX=>
6 AIZ.AX Interactive Chart | AIR N.Z. FPO NZX Stock Yahoo Finance (2018)
Au.finance.yahoo.com <https://au.finance.yahoo.com/quote/AIZ.AX/chart?p=AIZ.AX=>
tabler-icon-diamond-filled.svg

Paraphrase This Document

Need a fresh take? Get an instant paraphrase of this document with our AI Paraphraser
Document Page
10INTERNATIONAL FINANCE
Requirement 3.c:
Figure 6: Comparison between CYB and Australian market7
Relevant comparison between the share value of CYB and Austrian market is also
conducted to identify, where the increment in derived by the Australian market. However, no
such indication is derived from the above figure, as the shar price of CYB is not influenced
by the Australian market.
Figure 6: Comparison between AIZ and Australian market8
7 AIZ.AX Interactive Chart | AIR N.Z. FPO NZX Stock Yahoo Finance (2018)
Au.finance.yahoo.com <https://au.finance.yahoo.com/quote/AIZ.AX/chart?p=AIZ.AX=>
Document Page
11INTERNATIONAL FINANCE
The share price value of AIZ has mainly declined, while increment in value of
Australian market can be seen. This indicates that share price of AIZ is not driven by the
ASX market.
Requirement 4.a:
Figure 7: Comparison between AUD and USD9
The operation of CBA in foreign are mainly conducted on USD, where the value of
USD against AUD mainly declined over the past trading day. On the other hand, the
company mainly provided fair return during the trading period, which indicates that currency
volatility influences share price of CBA.
8 AIZ.AX Interactive Chart | AIR N.Z. FPO NZX Stock Yahoo Finance (2018)
Au.finance.yahoo.com <https://au.finance.yahoo.com/quote/AIZ.AX/chart?p=AIZ.AX=>
9 Historical Currency Converter | OANDA (2018) Oanda.com <https://www.oanda.com/fx-
for-business/historical-rates>
chevron_up_icon
1 out of 18
circle_padding
hide_on_mobile
zoom_out_icon