International Finance: Stock Portfolio and Investment Strategies
VerifiedAdded on 2020/06/06
|24
|5421
|461
Report
AI Summary
This report provides an in-depth analysis of international finance, focusing on investment strategies and the performance of stock portfolios. It examines the financial structures, market capitalization, and trading activities of several multinational corporations, including NEXT plc, RELX plc, SEGRO plc, and SKY plc, all of which are constituents of the FTSE 100 index. The analysis includes detailed stock portfolios, trade data, and financial ratios, offering insights into the fluctuations in stock prices and the overall financial health of these companies. The report also covers various investment strategies such as investing, no strategy, buy and hold, indexing, and speculation, providing a comprehensive understanding of international financial management and investment decision-making. Additionally, the report includes an analysis of non-FTSE companies, such as ADAMAS FINANCE ASIA LIMITED and AFH FINANCIAL GROUP PLC, to provide a broader perspective on international investment opportunities and risks.

INTERNATIONAL FINANCE
Paraphrase This Document
Need a fresh take? Get an instant paraphrase of this document with our AI Paraphraser
Table of Contents
INTRODUCTION...........................................................................................................................1
INVESTMENT STRATEGIES.......................................................................................................1
STOCK PORTFOLIO.....................................................................................................................2
Stock portfolio of NEXT plc.......................................................................................................2
Stock portfolio of RELX plc.......................................................................................................8
Stock portfolio of SEGRO plc..................................................................................................10
Stock portfolio of SKY plc.......................................................................................................15
PORTFOLIO AND PERFORMANCE ANALYSIS OF NON FTSE COMPANIES..................19
ADAMAS FINANCE ASIA LIMITED...................................................................................19
AFH FINANCIAL GROUP PLC.............................................................................................19
ABERDEEN ASIAN SMALLER COMPANIES INVESTMENT TRUST PLC:...................19
Cumulative Performance in GBX...............................................................................20
Discrete Annual Performance to Last Quarter End in GBX.......................................20
Performance by Calendar Year in GBX.....................................................................20
Investment Price Movement.......................................................................................20
Risk Statistics..............................................................................................................20
Arrow Global Group PLC.........................................................................................................20
CONCLUSION..............................................................................................................................21
REFERENCES..............................................................................................................................22
INTRODUCTION
International finance indicates towards management of financial resources and
management decision in global perspective. Multinational groups and divisions are some
essential aspects which are considered in this context. International finance helps to analyse the
key aspects subject to analyse the financial resource requirement and management of financial
resources for better planning and forecasting. This report is prepared to analyse the international
finance and management. Investment decisions and international expansions plans are defined
with the help of international portfolio management. Understanding of international markets,
investments and risks are advised with some fluctuating factors like currency fluctuations.
Standards and aspects are determined in reference of FTSE multinational corporation.
INVESTMENT STRATEGIES
There are type of investment strategies are available in the market subject to analyse and
grab best investment options and plans. Securities and stock market is a game of analysing and
identifying potential risk factors which remain associated with investments. In financial
perspective investment strategies are considered as a combination of rules, procedures, designs
and selection of investment portfolios. Individuals contains different and various profit
objectives. These are strategies are also considered a ways to analyse and bifurcate the plans and
investment appraisals in various forms. It remain involved in risk and return. Major investment
strategies which are defined as under:
Investing: this is the strategy which is used to analyse long term growth and return form
the invested portion. This strategy is basically useful for the long term potential investors and
financiers. An organisation is opted and analysed with all over aspects such as products and
services, delivery system and effectiveness of production and quality standards subject to
management and operations. Future possibilities and growth opportunities are analysed and
measured in respect of profitability and the quality management. Valuation techniques are used
by investors such as fundamental or value analysis.
No strategy: this strategy does not contains any procedures and plans subject to analyse
the consistency and durability of investment plans. Investors invest funds with the help of pricing
analysis when an organisation is listed daily in the newspaper. This is also called as Blind Folded
Monkey Throwing Darts.
1
⊘ This is a preview!⊘
Do you want full access?
Subscribe today to unlock all pages.
Trusted by 1+ million students worldwide

Buy and hold: this strategy intends to invest prices and funds in buying shares and
securities for long term duration. Investors use this strategies while investing amount in equity
shares and long run securities with a good and attractive returns. This strategy is considered good
and optimum in respect of volatility or decline. Securities and shares are holed for long duration
to get good returns. Market timing is monitored for proper analysis and plan for long term gains
and profitability.
Indexing: this is one of the strategy which helps to reduce the conflicts and aspects
which remain associated with the market shares and index price like S&P 500. index of mutual
funds, exchange traded fund, long term funds and active strategies are adapted by this system.
Index is used to enter and exit the market quickly. A small part of stocks and securities are
purchased for long term duration.
Speculation: this is a strategy subject to purchase and sell the commodities and stocks of
company in expectation of gaining profits by variations in prices. Fundamental analysis is given
by Benjamin Graham with the concept of fluctuation and changes in price of commodities and
stokes.
STOCK PORTFOLIO
Stock portfolio is a particular format which is used to analyse the financial assets such as
stock, bonds, commodities and currencies for a particular international group. These are the
assets which are associated with the counterparts including mutual, exchange traded and closed
funds. It contains the information related to public and non public traceable securities, financial
professionals and investments. It bifurcate the groups and sections of an organisation in terms of
assets and liabilities and fractional changes in capital position and image. This is one of the
essential aspect in order to determine the financial help and analyse the data of organisation for
better growth and sustainability of organisation. There is a portfolio of four multinational
corporations are given below such as:
Stock portfolio of NEXT plc
Next plc is one of the British multinational brand which deals in clothing, footwear, home
products and accessories. It has strong brand image in UK market and across the world. It is
currently operating more than seven hundred stores out of which five hundred stores are working
in the UK and Ireland and approx two hundred stores are in continental Europe. It is also
2
Paraphrase This Document
Need a fresh take? Get an instant paraphrase of this document with our AI Paraphraser
working in Asia and the middle east. It is one of the largest clothing retailer in the UK and listed
on the London stock exchange and constituent of the FTSE 100 index.
Financial structure of organisation also shows positive and strong image in UK stock
market. It has revenues approx 4100 million pound till the end of year 2017 and operating
income of 827.7 million pound which indicates towards positive response subject to operation
and management. Net income was generated by the organisation for the year 2017 was 635.3
million pound.
There is a stock portfolio of Next plc is given subject to analyse investment strategies
with analysis of fluctuations in price of stocks.
3

5 trades are analysed subject to evaluate fluctuations in prices and trends. With the help of
graphical representation the profitability and turnover records easily be determined form the
month of May 2017 to April 2018. there are no major fluctuations are seen in respect of may
2017 and June 2017. significant change is seen between July 2017. monthly trades are recoded
as follows:
4
graphical representation the profitability and turnover records easily be determined form the
month of May 2017 to April 2018. there are no major fluctuations are seen in respect of may
2017 and June 2017. significant change is seen between July 2017. monthly trades are recoded
as follows:
4
⊘ This is a preview!⊘
Do you want full access?
Subscribe today to unlock all pages.
Trusted by 1+ million students worldwide
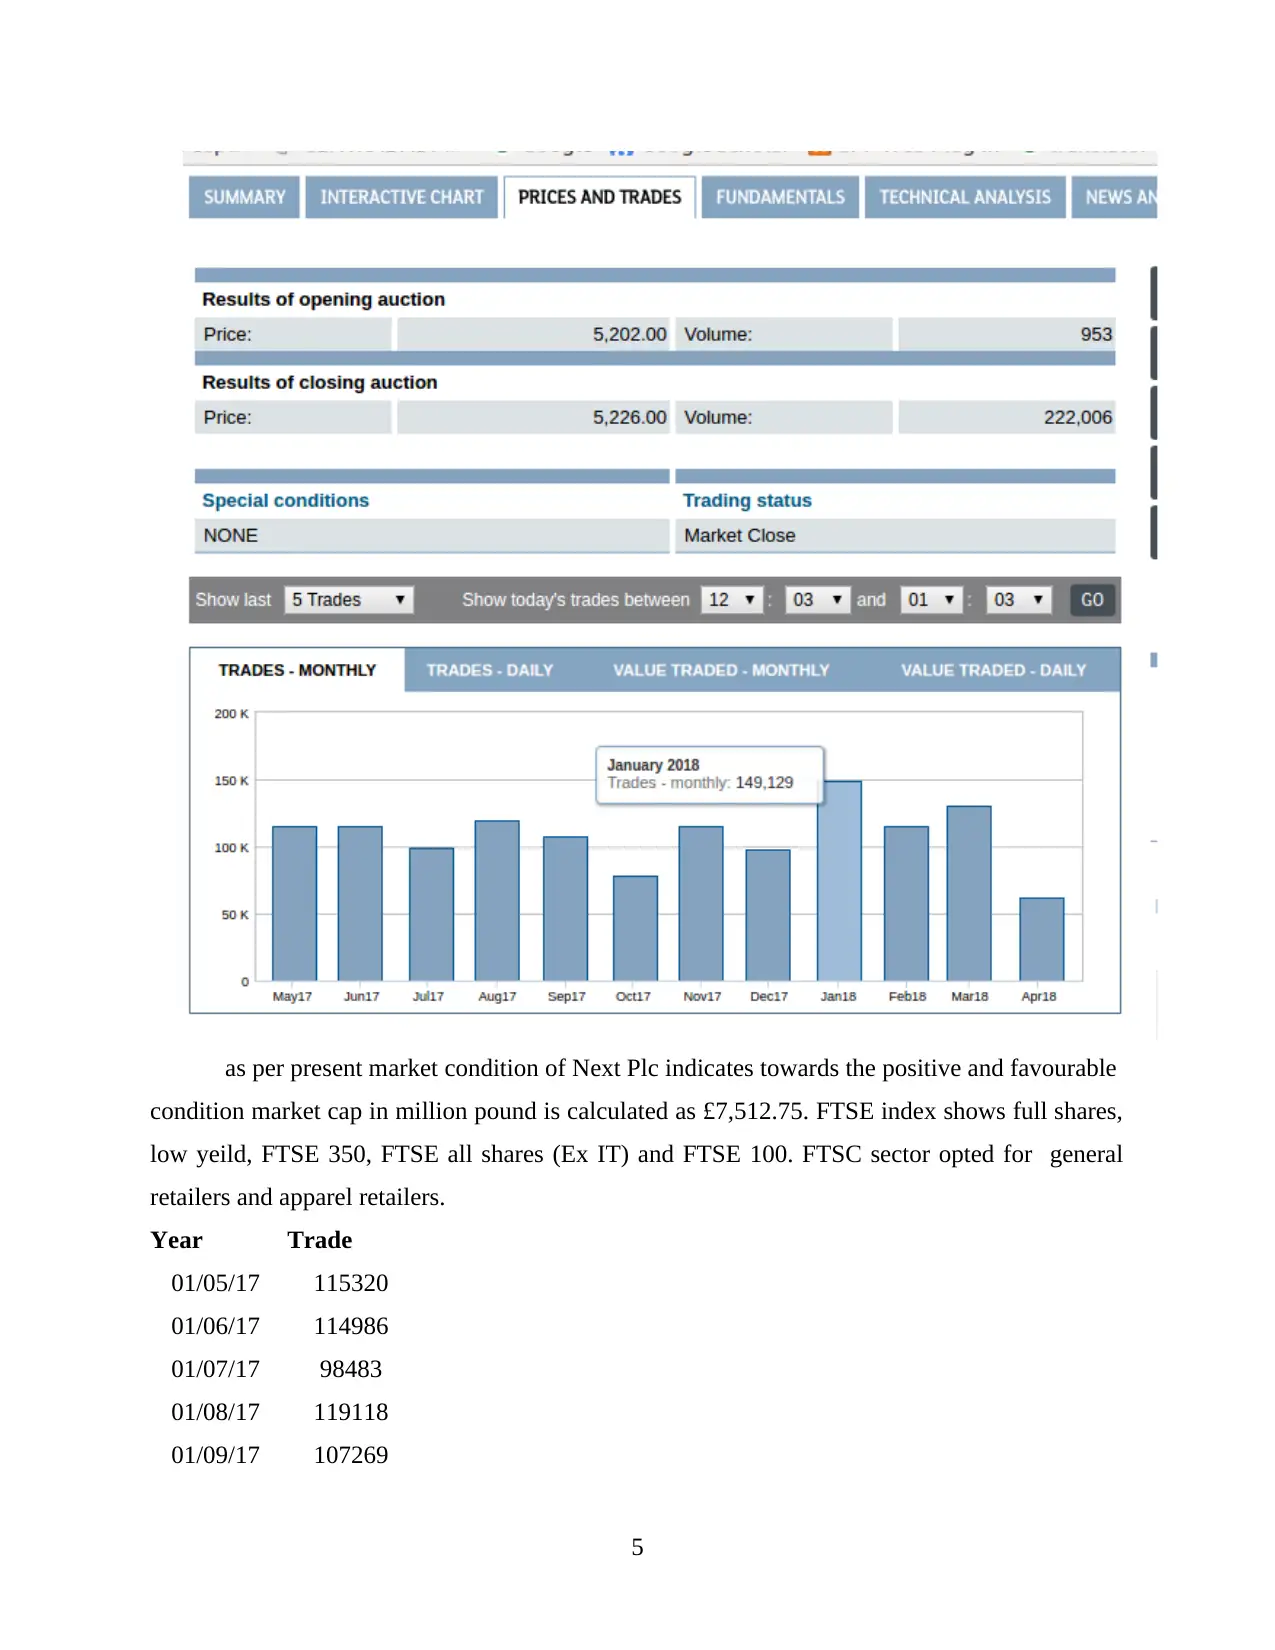
as per present market condition of Next Plc indicates towards the positive and favourable
condition market cap in million pound is calculated as £7,512.75. FTSE index shows full shares,
low yeild, FTSE 350, FTSE all shares (Ex IT) and FTSE 100. FTSC sector opted for general
retailers and apparel retailers.
Year Trade
01/05/17 115320
01/06/17 114986
01/07/17 98483
01/08/17 119118
01/09/17 107269
5
Paraphrase This Document
Need a fresh take? Get an instant paraphrase of this document with our AI Paraphraser
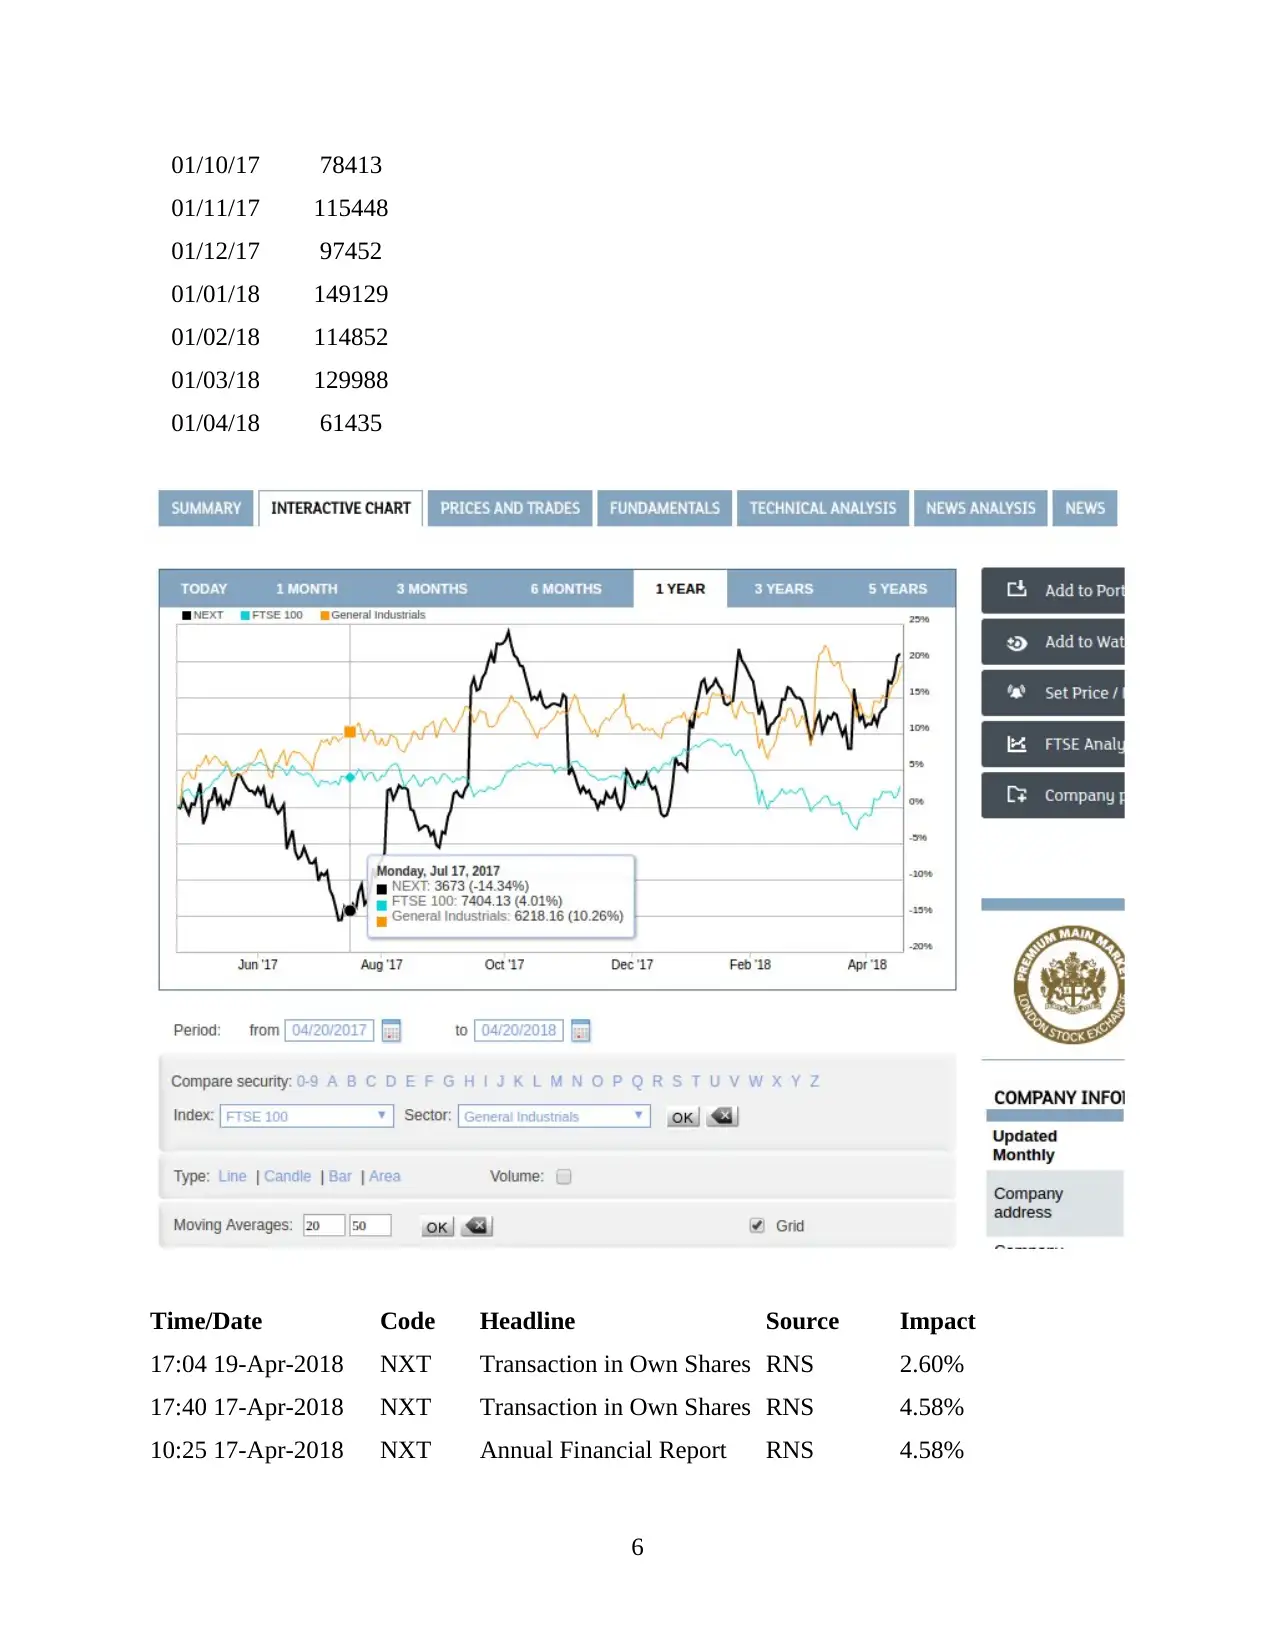
01/10/17 78413
01/11/17 115448
01/12/17 97452
01/01/18 149129
01/02/18 114852
01/03/18 129988
01/04/18 61435
Time/Date Code Headline Source Impact
17:04 19-Apr-2018 NXT Transaction in Own Shares RNS 2.60%
17:40 17-Apr-2018 NXT Transaction in Own Shares RNS 4.58%
10:25 17-Apr-2018 NXT Annual Financial Report RNS 4.58%
6
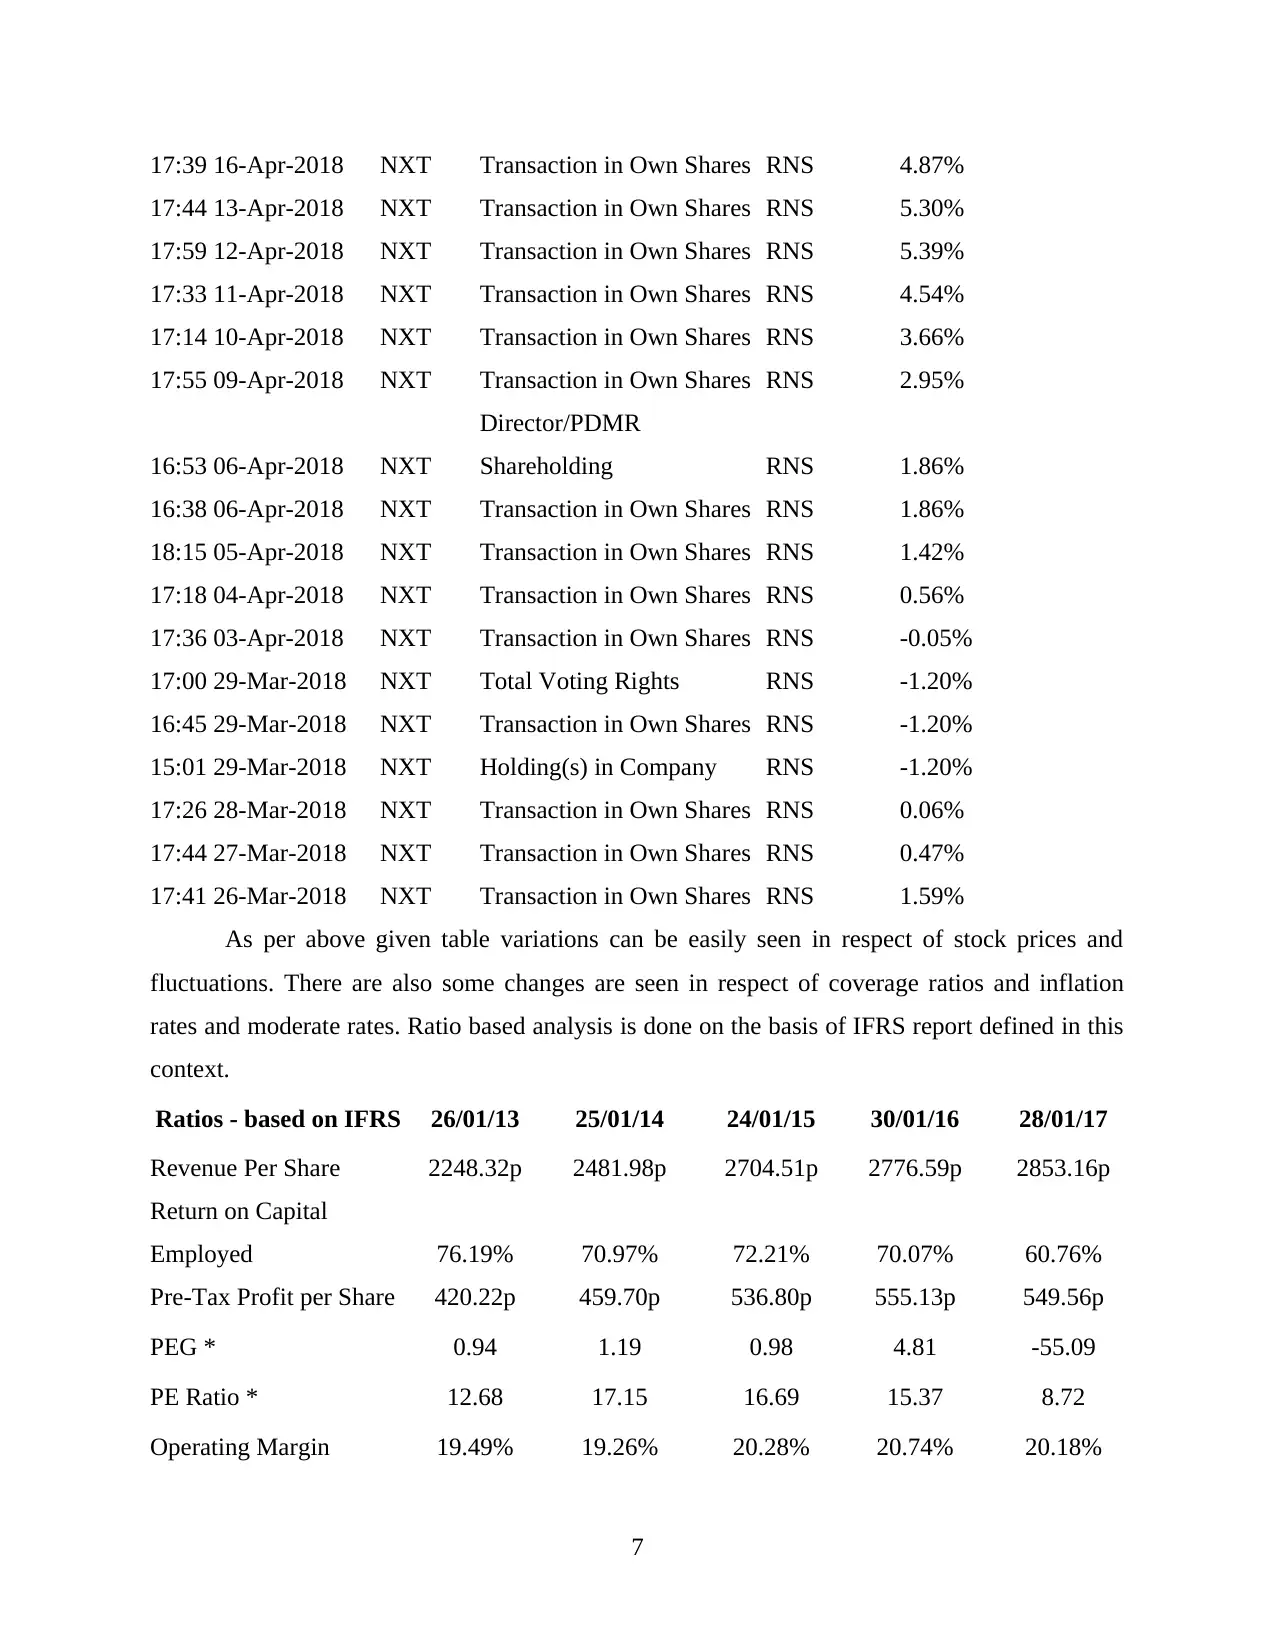
17:39 16-Apr-2018 NXT Transaction in Own Shares RNS 4.87%
17:44 13-Apr-2018 NXT Transaction in Own Shares RNS 5.30%
17:59 12-Apr-2018 NXT Transaction in Own Shares RNS 5.39%
17:33 11-Apr-2018 NXT Transaction in Own Shares RNS 4.54%
17:14 10-Apr-2018 NXT Transaction in Own Shares RNS 3.66%
17:55 09-Apr-2018 NXT Transaction in Own Shares RNS 2.95%
16:53 06-Apr-2018 NXT
Director/PDMR
Shareholding RNS 1.86%
16:38 06-Apr-2018 NXT Transaction in Own Shares RNS 1.86%
18:15 05-Apr-2018 NXT Transaction in Own Shares RNS 1.42%
17:18 04-Apr-2018 NXT Transaction in Own Shares RNS 0.56%
17:36 03-Apr-2018 NXT Transaction in Own Shares RNS -0.05%
17:00 29-Mar-2018 NXT Total Voting Rights RNS -1.20%
16:45 29-Mar-2018 NXT Transaction in Own Shares RNS -1.20%
15:01 29-Mar-2018 NXT Holding(s) in Company RNS -1.20%
17:26 28-Mar-2018 NXT Transaction in Own Shares RNS 0.06%
17:44 27-Mar-2018 NXT Transaction in Own Shares RNS 0.47%
17:41 26-Mar-2018 NXT Transaction in Own Shares RNS 1.59%
As per above given table variations can be easily seen in respect of stock prices and
fluctuations. There are also some changes are seen in respect of coverage ratios and inflation
rates and moderate rates. Ratio based analysis is done on the basis of IFRS report defined in this
context.
Ratios - based on IFRS 26/01/13 25/01/14 24/01/15 30/01/16 28/01/17
Revenue Per Share 2248.32p 2481.98p 2704.51p 2776.59p 2853.16p
Return on Capital
Employed 76.19% 70.97% 72.21% 70.07% 60.76%
Pre-Tax Profit per Share 420.22p 459.70p 536.80p 555.13p 549.56p
PEG * 0.94 1.19 0.98 4.81 -55.09
PE Ratio * 12.68 17.15 16.69 15.37 8.72
Operating Margin 19.49% 19.26% 20.28% 20.74% 20.18%
7
⊘ This is a preview!⊘
Do you want full access?
Subscribe today to unlock all pages.
Trusted by 1+ million students worldwide
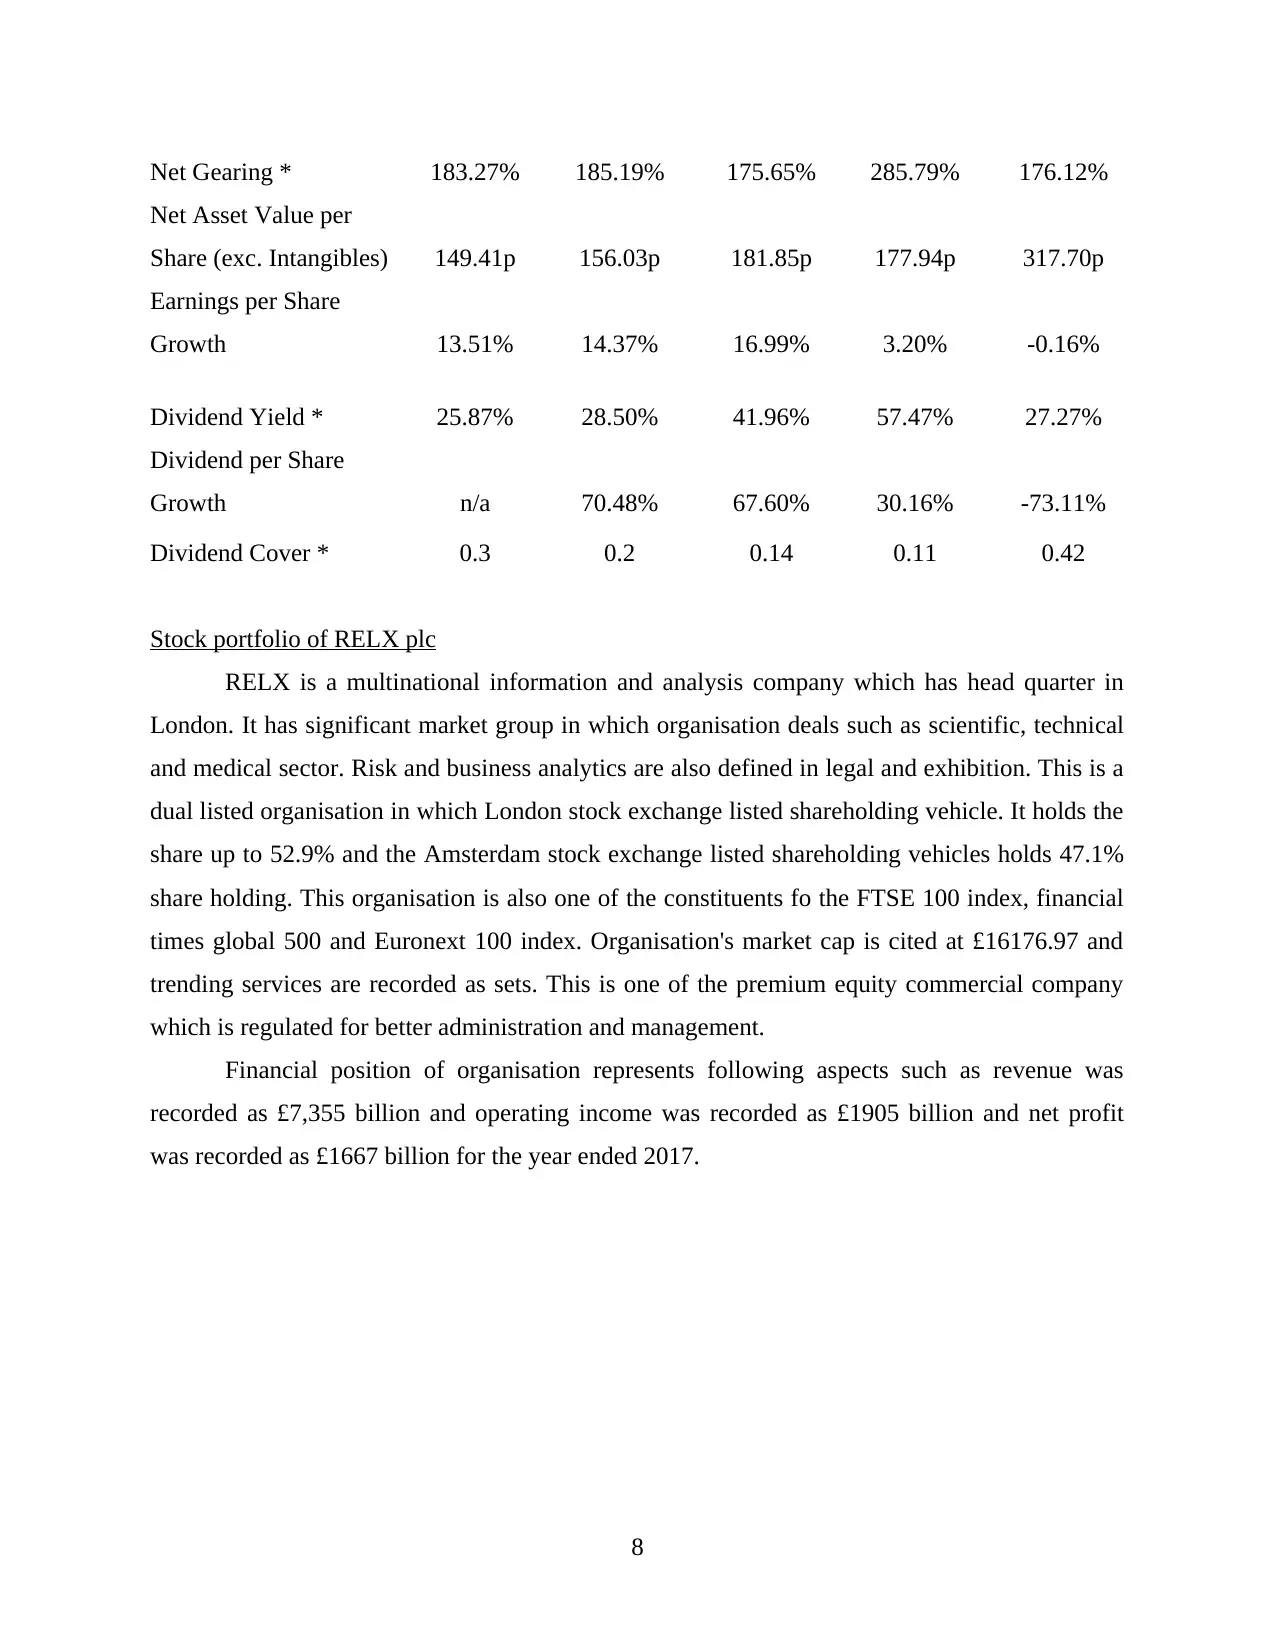
Net Gearing * 183.27% 185.19% 175.65% 285.79% 176.12%
Net Asset Value per
Share (exc. Intangibles) 149.41p 156.03p 181.85p 177.94p 317.70p
Earnings per Share
Growth 13.51% 14.37% 16.99% 3.20% -0.16%
Dividend Yield * 25.87% 28.50% 41.96% 57.47% 27.27%
Dividend per Share
Growth n/a 70.48% 67.60% 30.16% -73.11%
Dividend Cover * 0.3 0.2 0.14 0.11 0.42
Stock portfolio of RELX plc
RELX is a multinational information and analysis company which has head quarter in
London. It has significant market group in which organisation deals such as scientific, technical
and medical sector. Risk and business analytics are also defined in legal and exhibition. This is a
dual listed organisation in which London stock exchange listed shareholding vehicle. It holds the
share up to 52.9% and the Amsterdam stock exchange listed shareholding vehicles holds 47.1%
share holding. This organisation is also one of the constituents fo the FTSE 100 index, financial
times global 500 and Euronext 100 index. Organisation's market cap is cited at £16176.97 and
trending services are recorded as sets. This is one of the premium equity commercial company
which is regulated for better administration and management.
Financial position of organisation represents following aspects such as revenue was
recorded as £7,355 billion and operating income was recorded as £1905 billion and net profit
was recorded as £1667 billion for the year ended 2017.
8
Paraphrase This Document
Need a fresh take? Get an instant paraphrase of this document with our AI Paraphraser
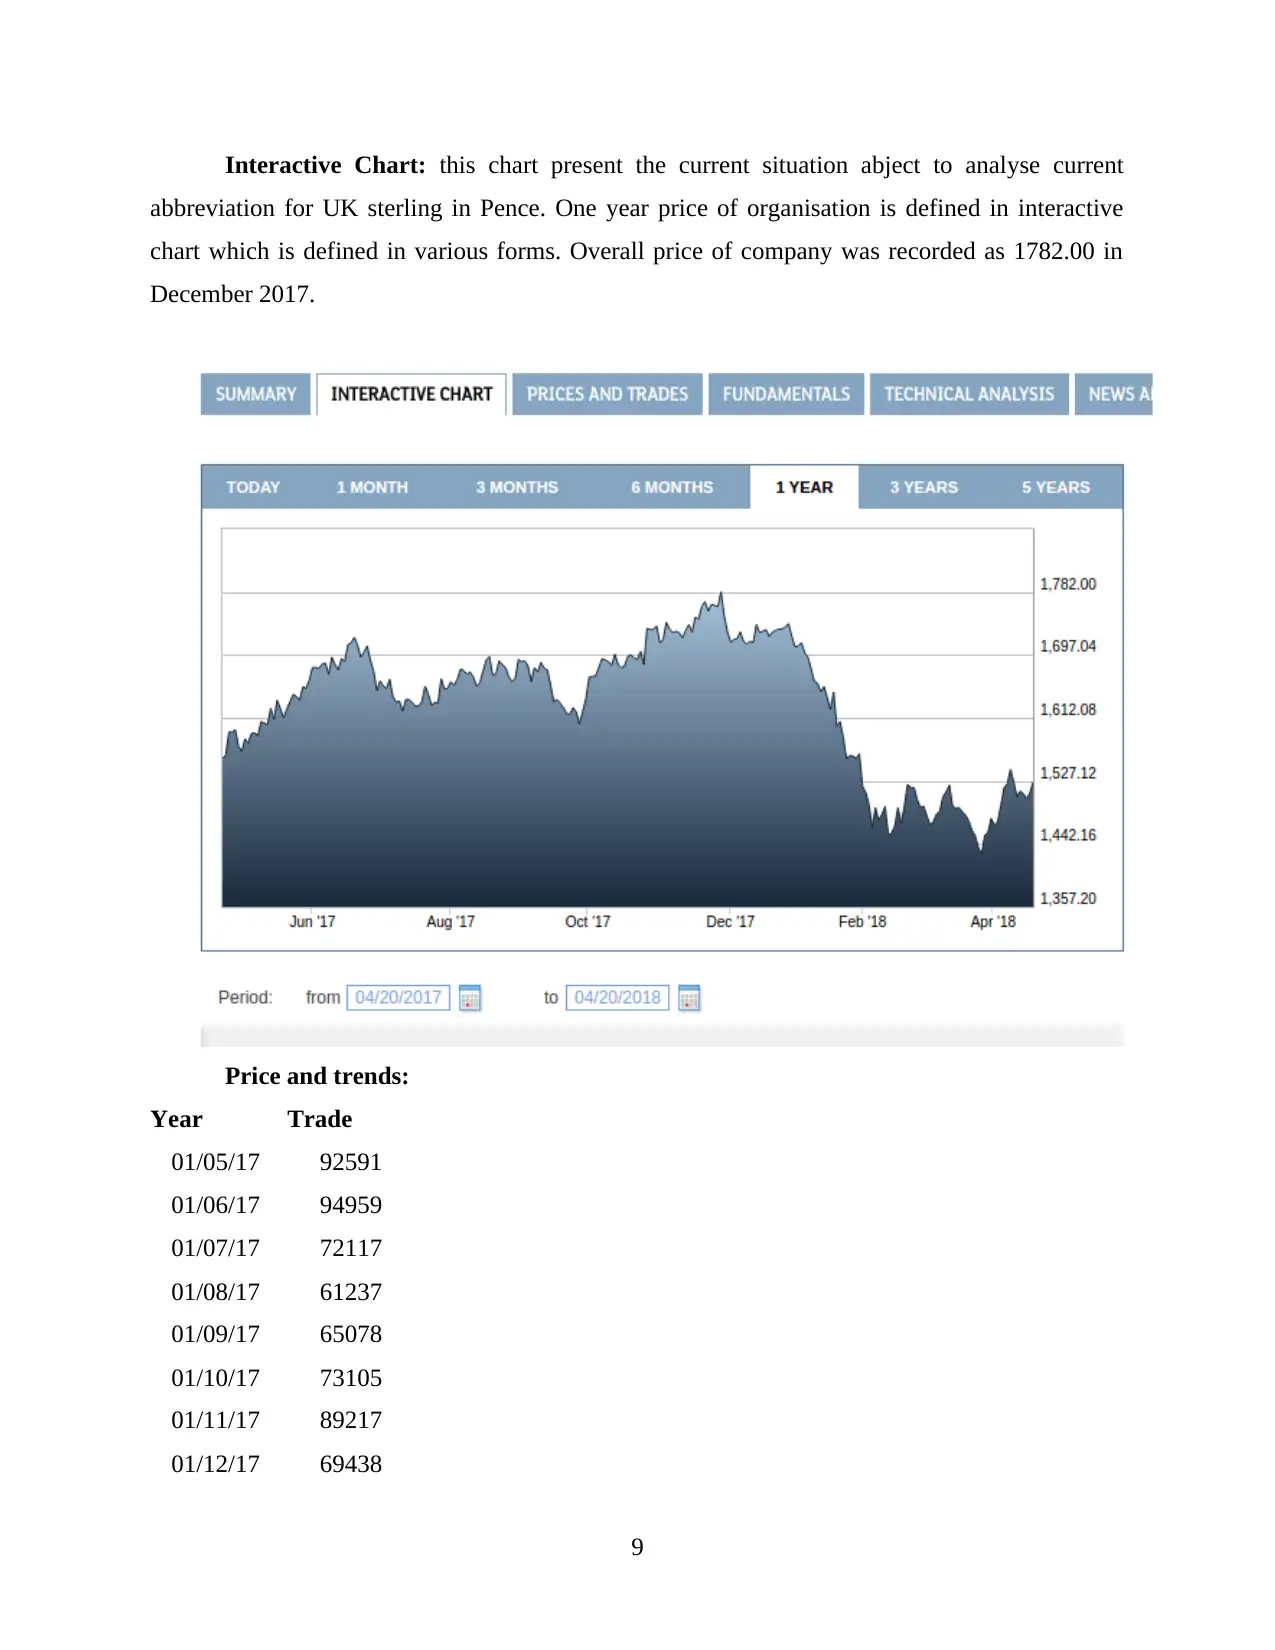
Interactive Chart: this chart present the current situation abject to analyse current
abbreviation for UK sterling in Pence. One year price of organisation is defined in interactive
chart which is defined in various forms. Overall price of company was recorded as 1782.00 in
December 2017.
Price and trends:
Year Trade
01/05/17 92591
01/06/17 94959
01/07/17 72117
01/08/17 61237
01/09/17 65078
01/10/17 73105
01/11/17 89217
01/12/17 69438
9
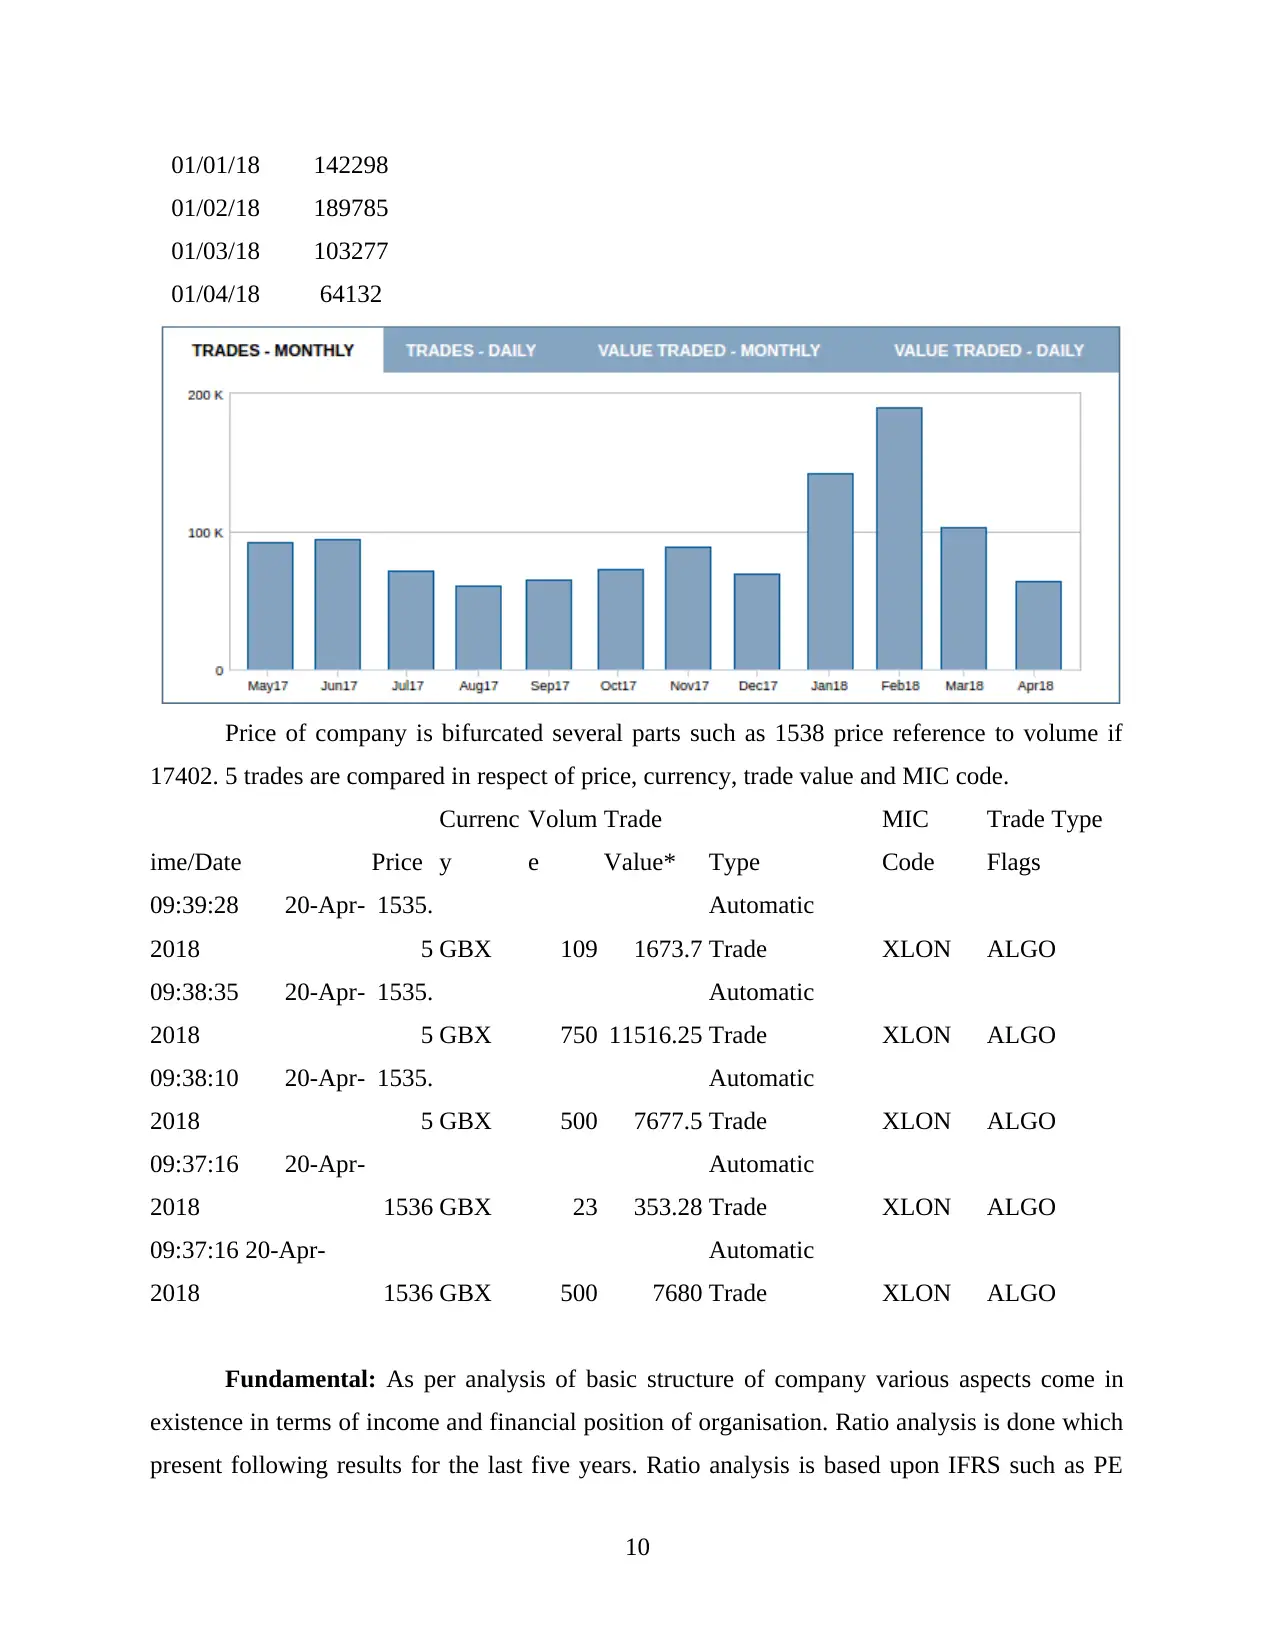
01/01/18 142298
01/02/18 189785
01/03/18 103277
01/04/18 64132
Price of company is bifurcated several parts such as 1538 price reference to volume if
17402. 5 trades are compared in respect of price, currency, trade value and MIC code.
ime/Date Price
Currenc
y
Volum
e
Trade
Value* Type
MIC
Code
Trade Type
Flags
09:39:28 20-Apr-
2018
1535.
5 GBX 109 1673.7
Automatic
Trade XLON ALGO
09:38:35 20-Apr-
2018
1535.
5 GBX 750 11516.25
Automatic
Trade XLON ALGO
09:38:10 20-Apr-
2018
1535.
5 GBX 500 7677.5
Automatic
Trade XLON ALGO
09:37:16 20-Apr-
2018 1536 GBX 23 353.28
Automatic
Trade XLON ALGO
09:37:16 20-Apr-
2018 1536 GBX 500 7680
Automatic
Trade XLON ALGO
Fundamental: As per analysis of basic structure of company various aspects come in
existence in terms of income and financial position of organisation. Ratio analysis is done which
present following results for the last five years. Ratio analysis is based upon IFRS such as PE
10
⊘ This is a preview!⊘
Do you want full access?
Subscribe today to unlock all pages.
Trusted by 1+ million students worldwide
1 out of 24
Related Documents


Your All-in-One AI-Powered Toolkit for Academic Success.
+13062052269
info@desklib.com
Available 24*7 on WhatsApp / Email
![[object Object]](/_next/static/media/star-bottom.7253800d.svg)
Unlock your academic potential
Copyright © 2020–2026 A2Z Services. All Rights Reserved. Developed and managed by ZUCOL.