International Finance Portfolio: Performance Analysis and Insights
VerifiedAdded on 2022/11/15
|12
|1422
|178
Project
AI Summary
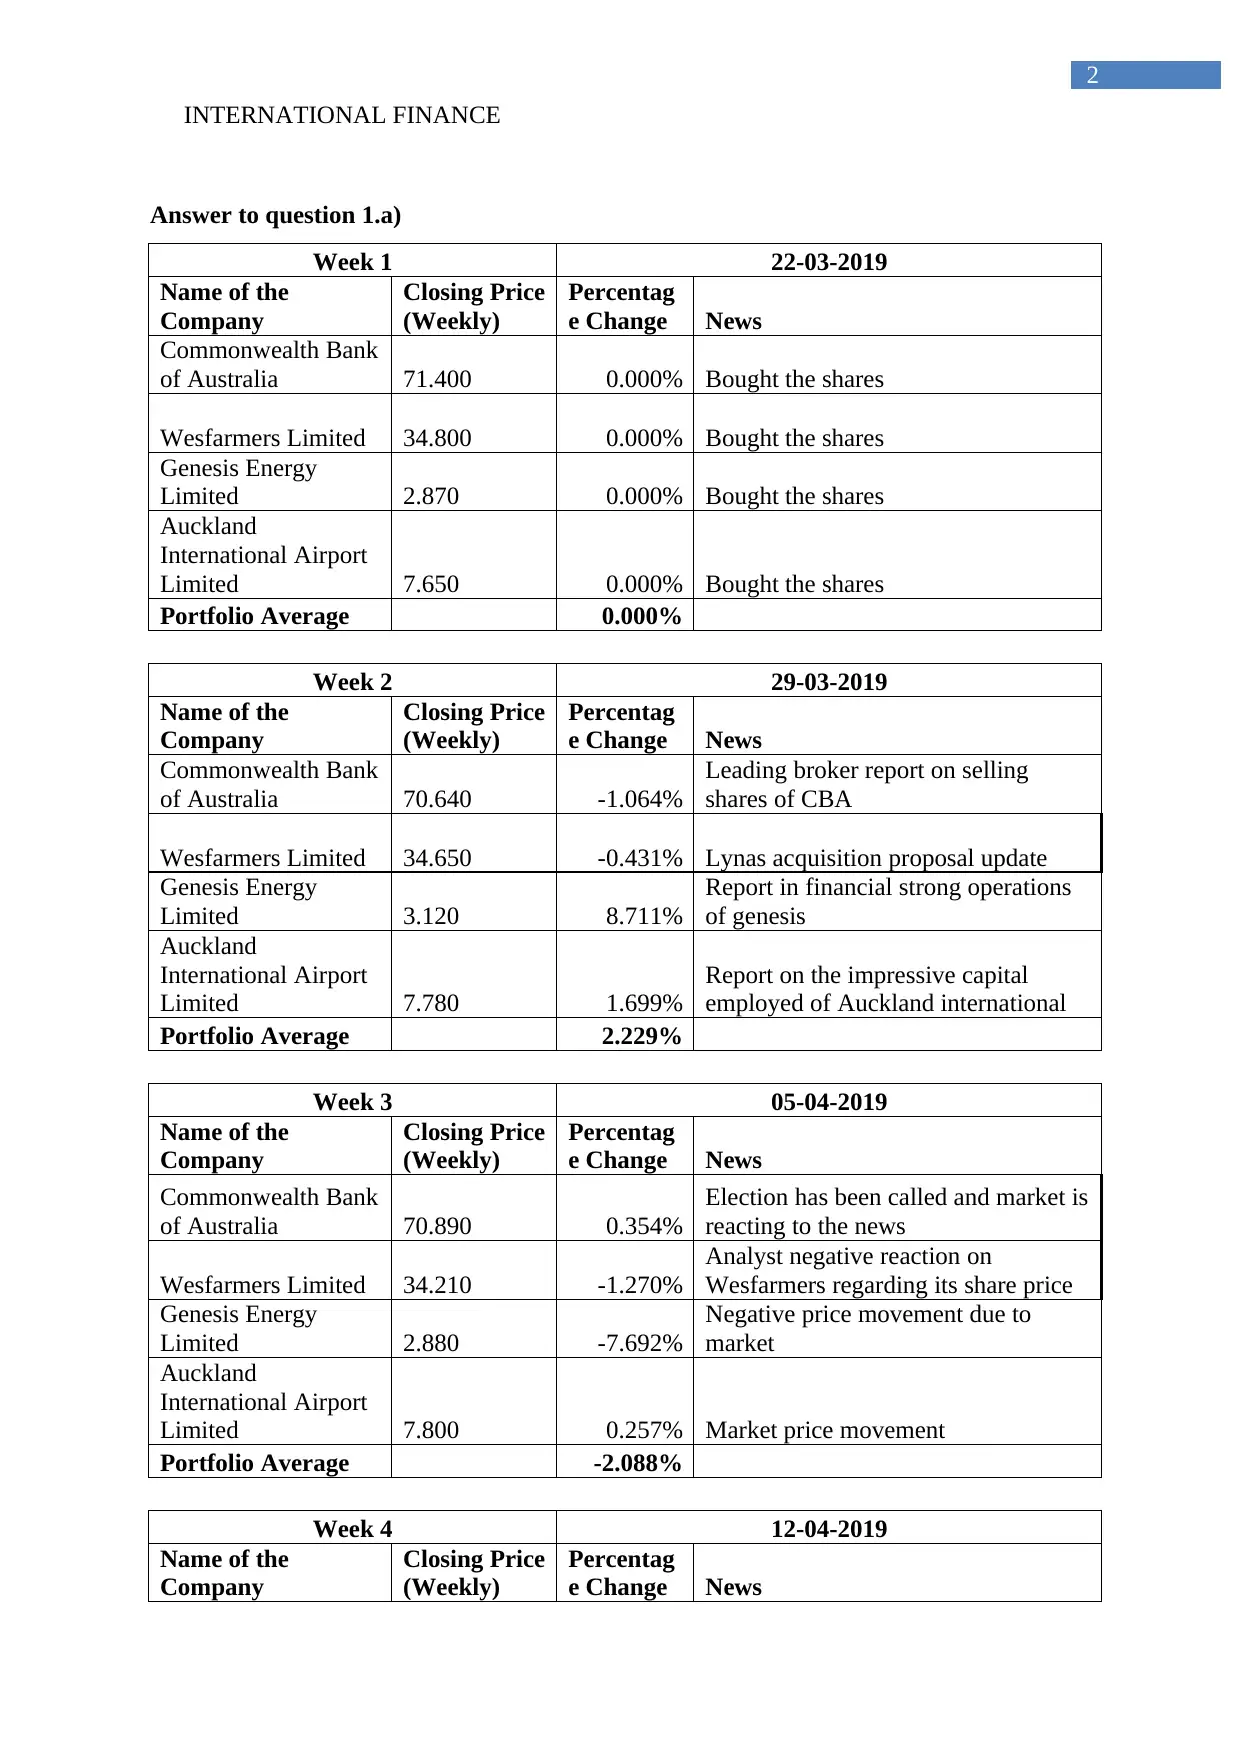
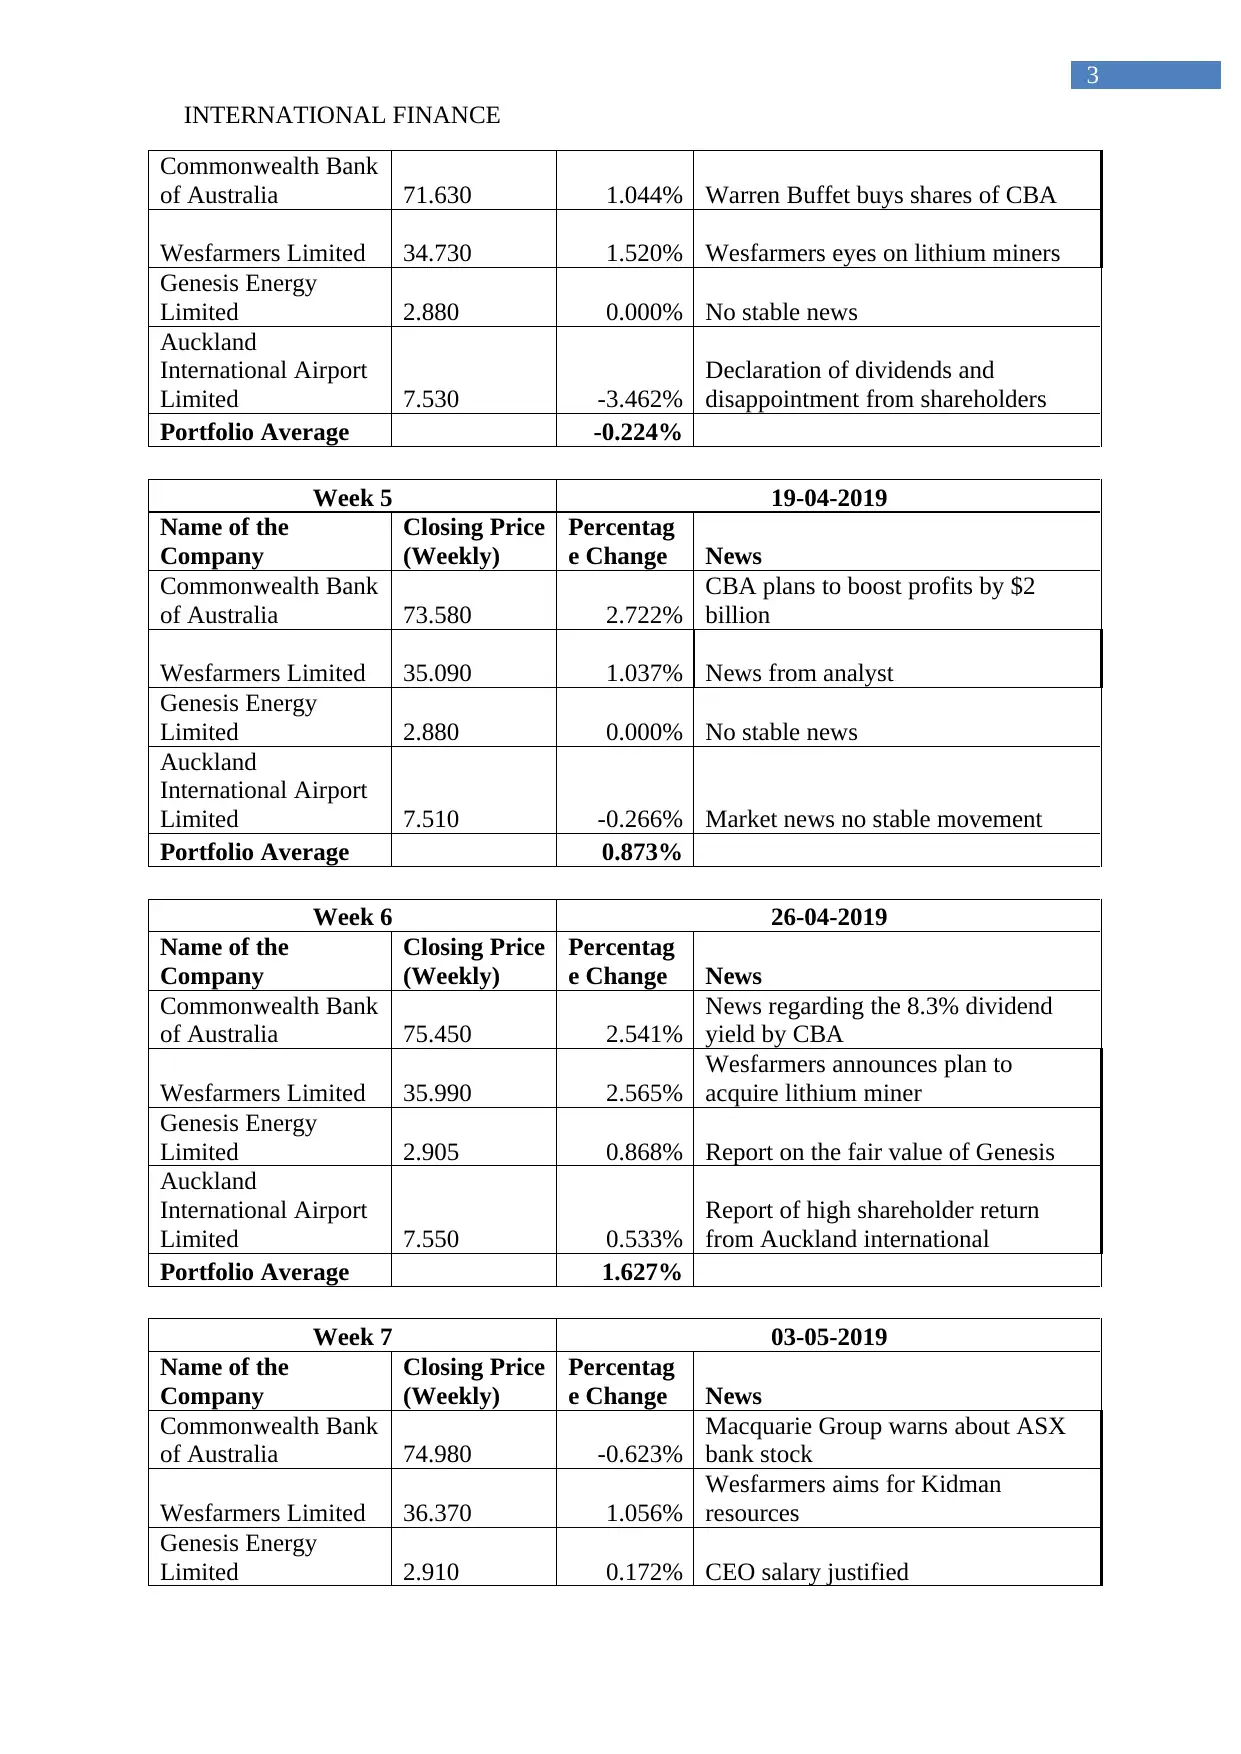
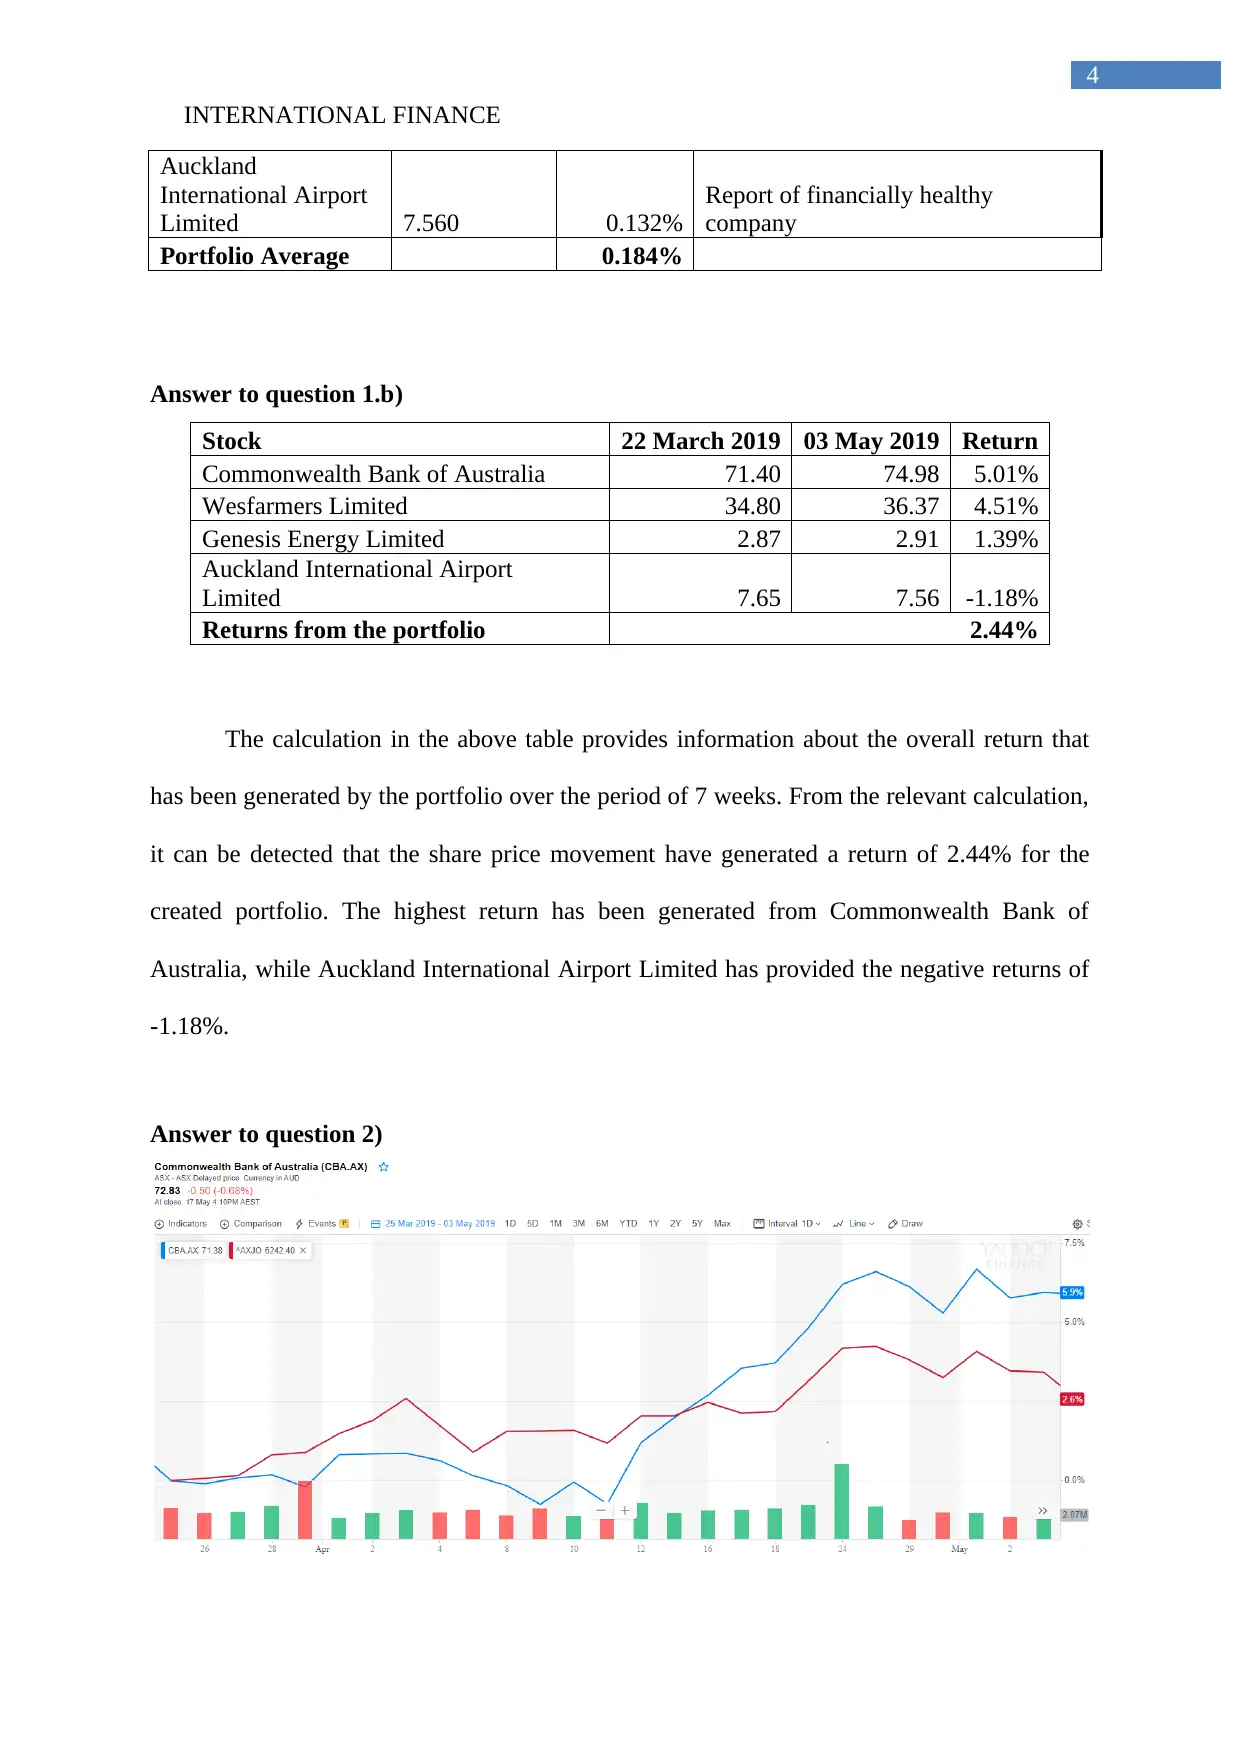
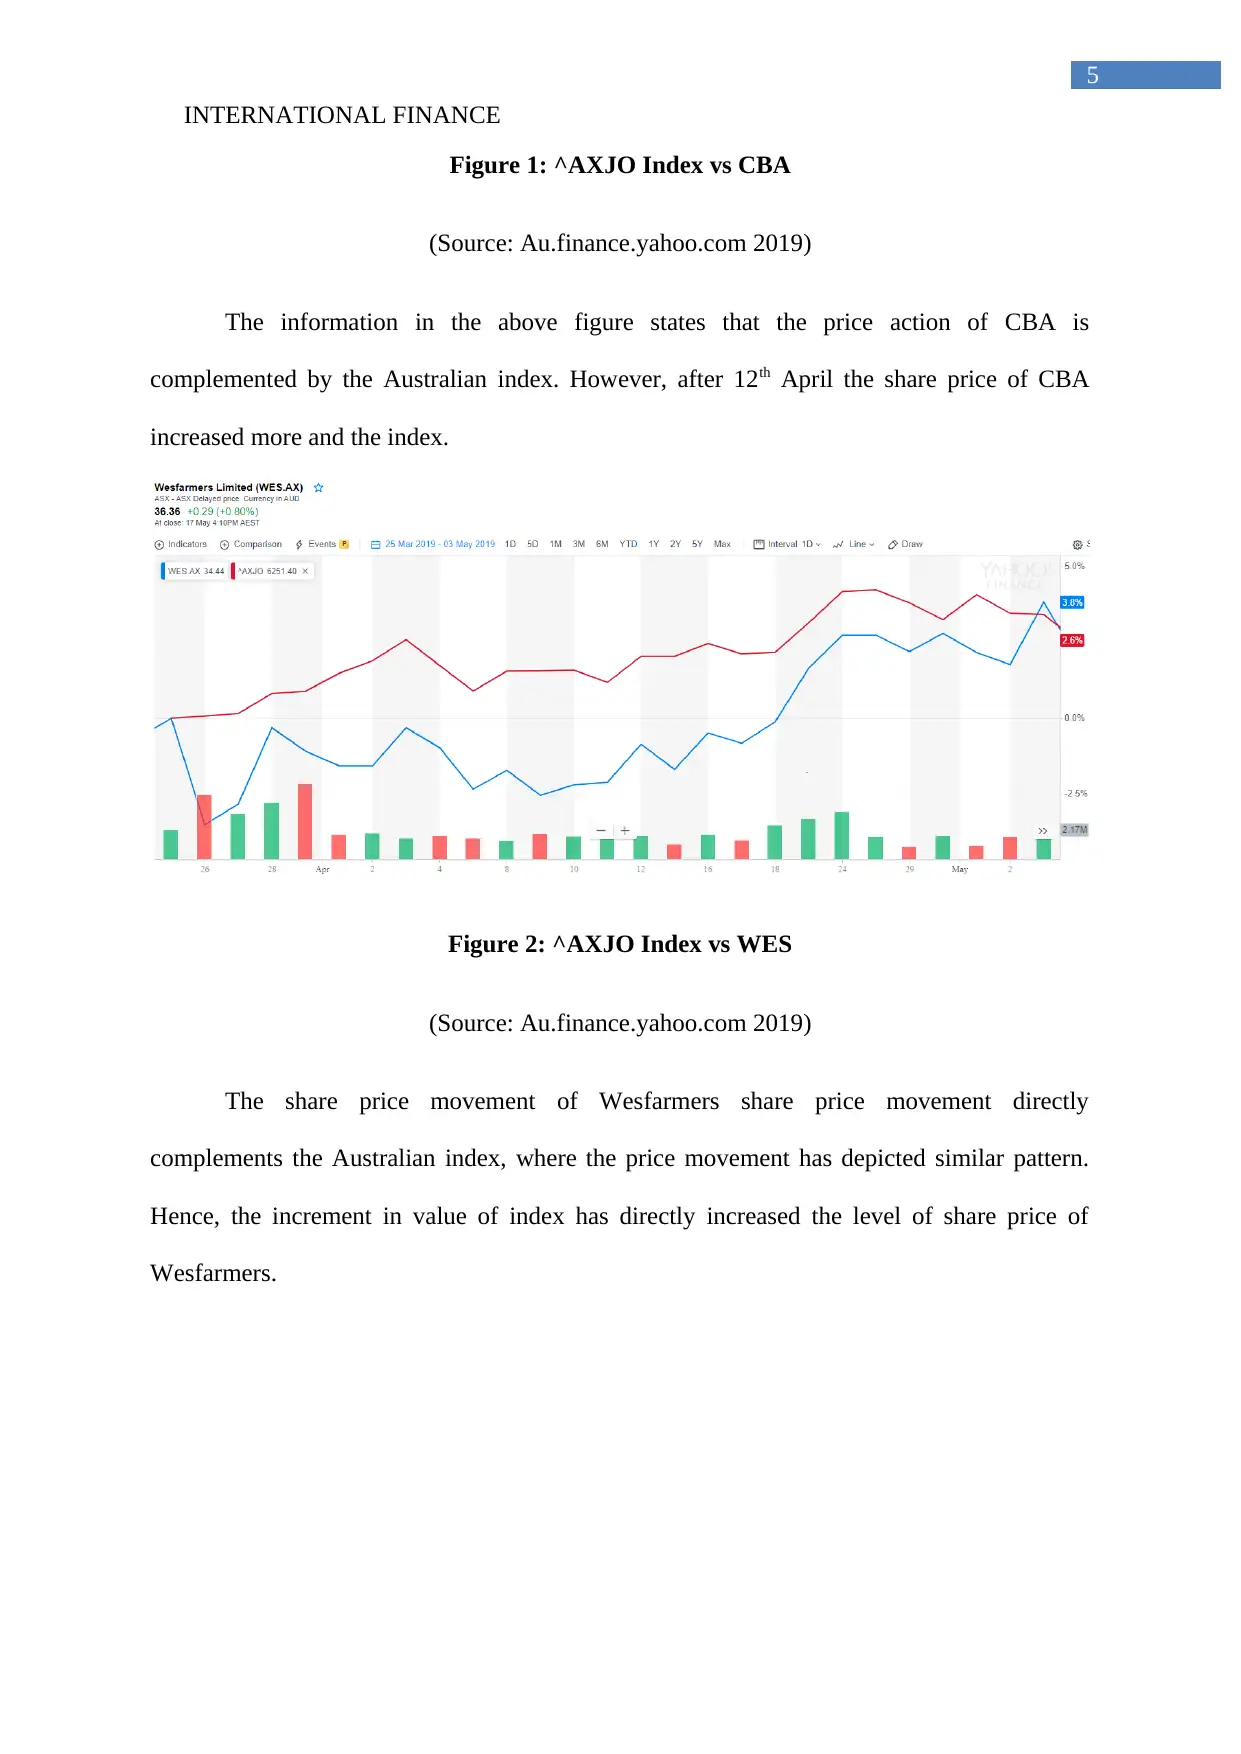
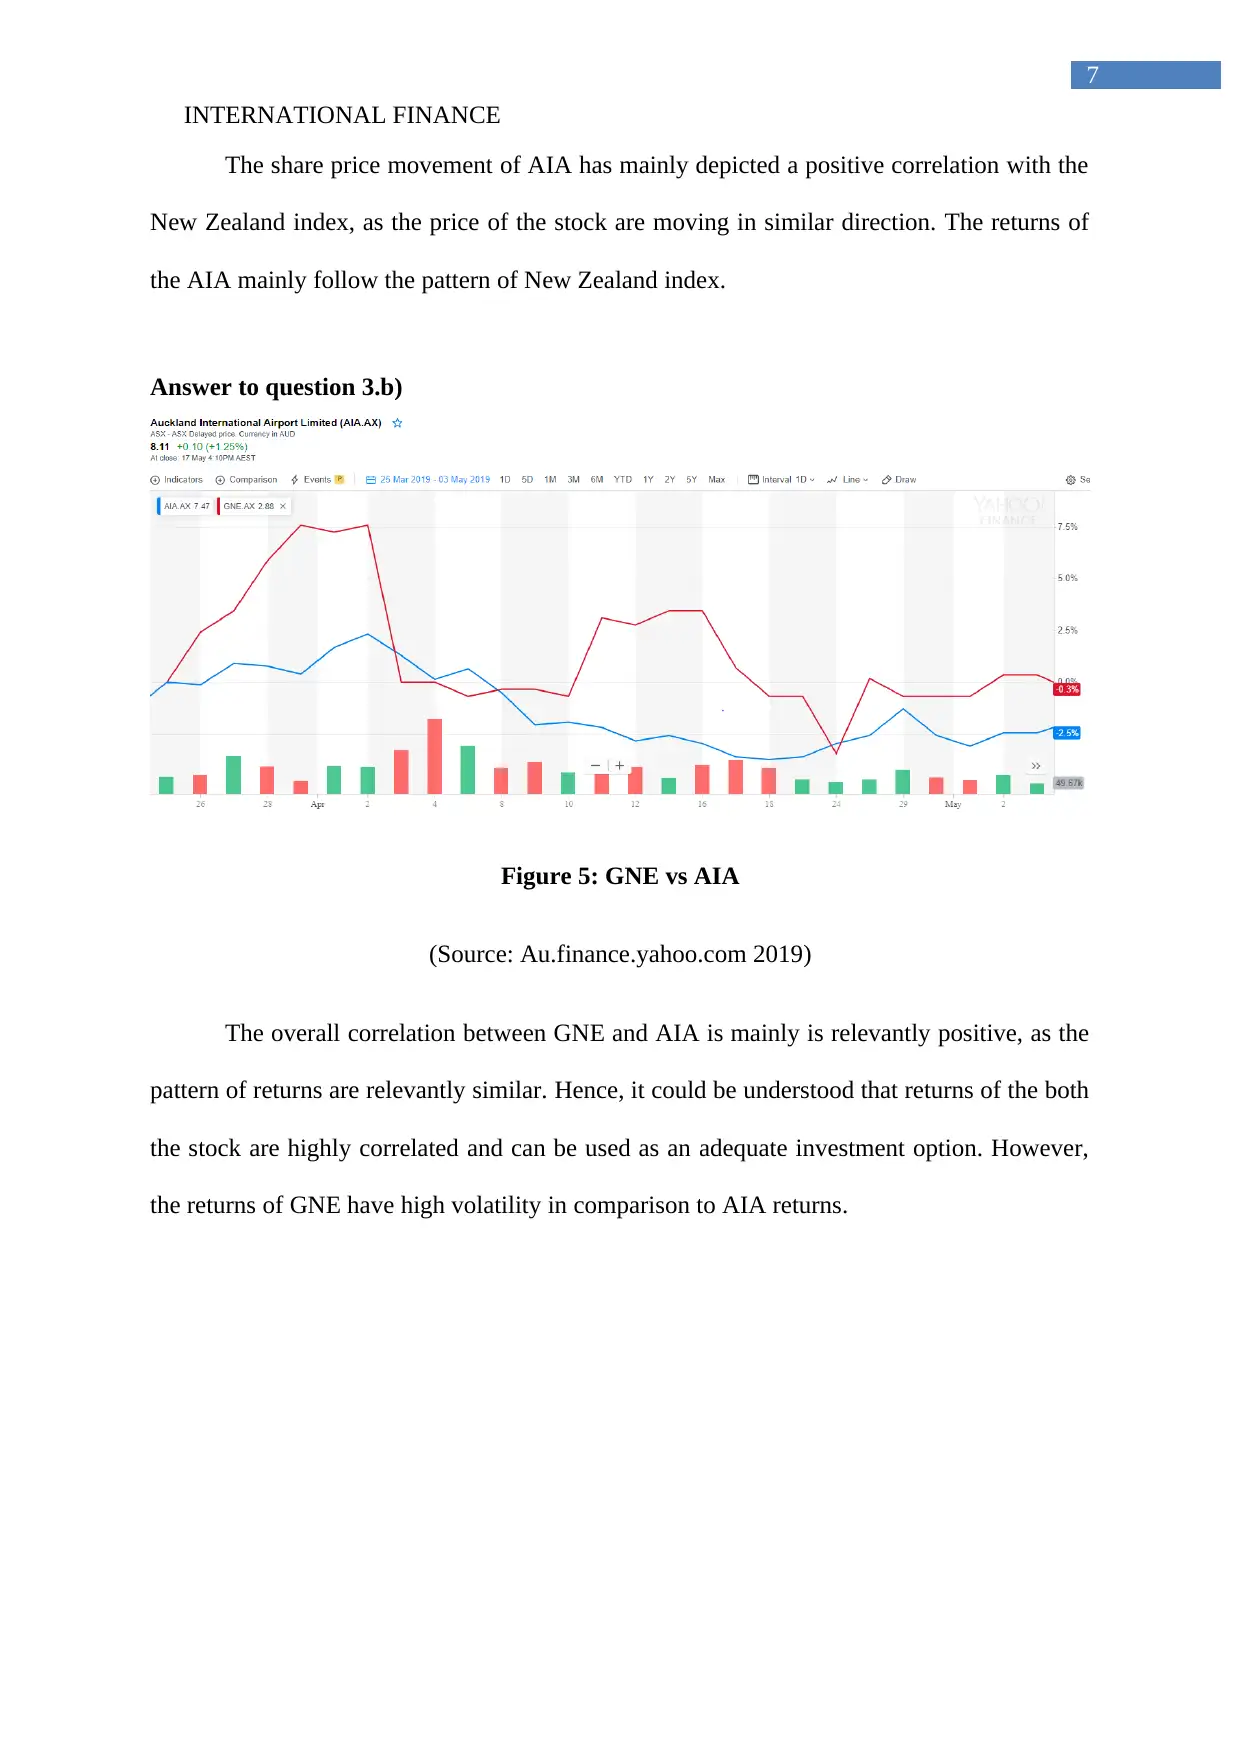
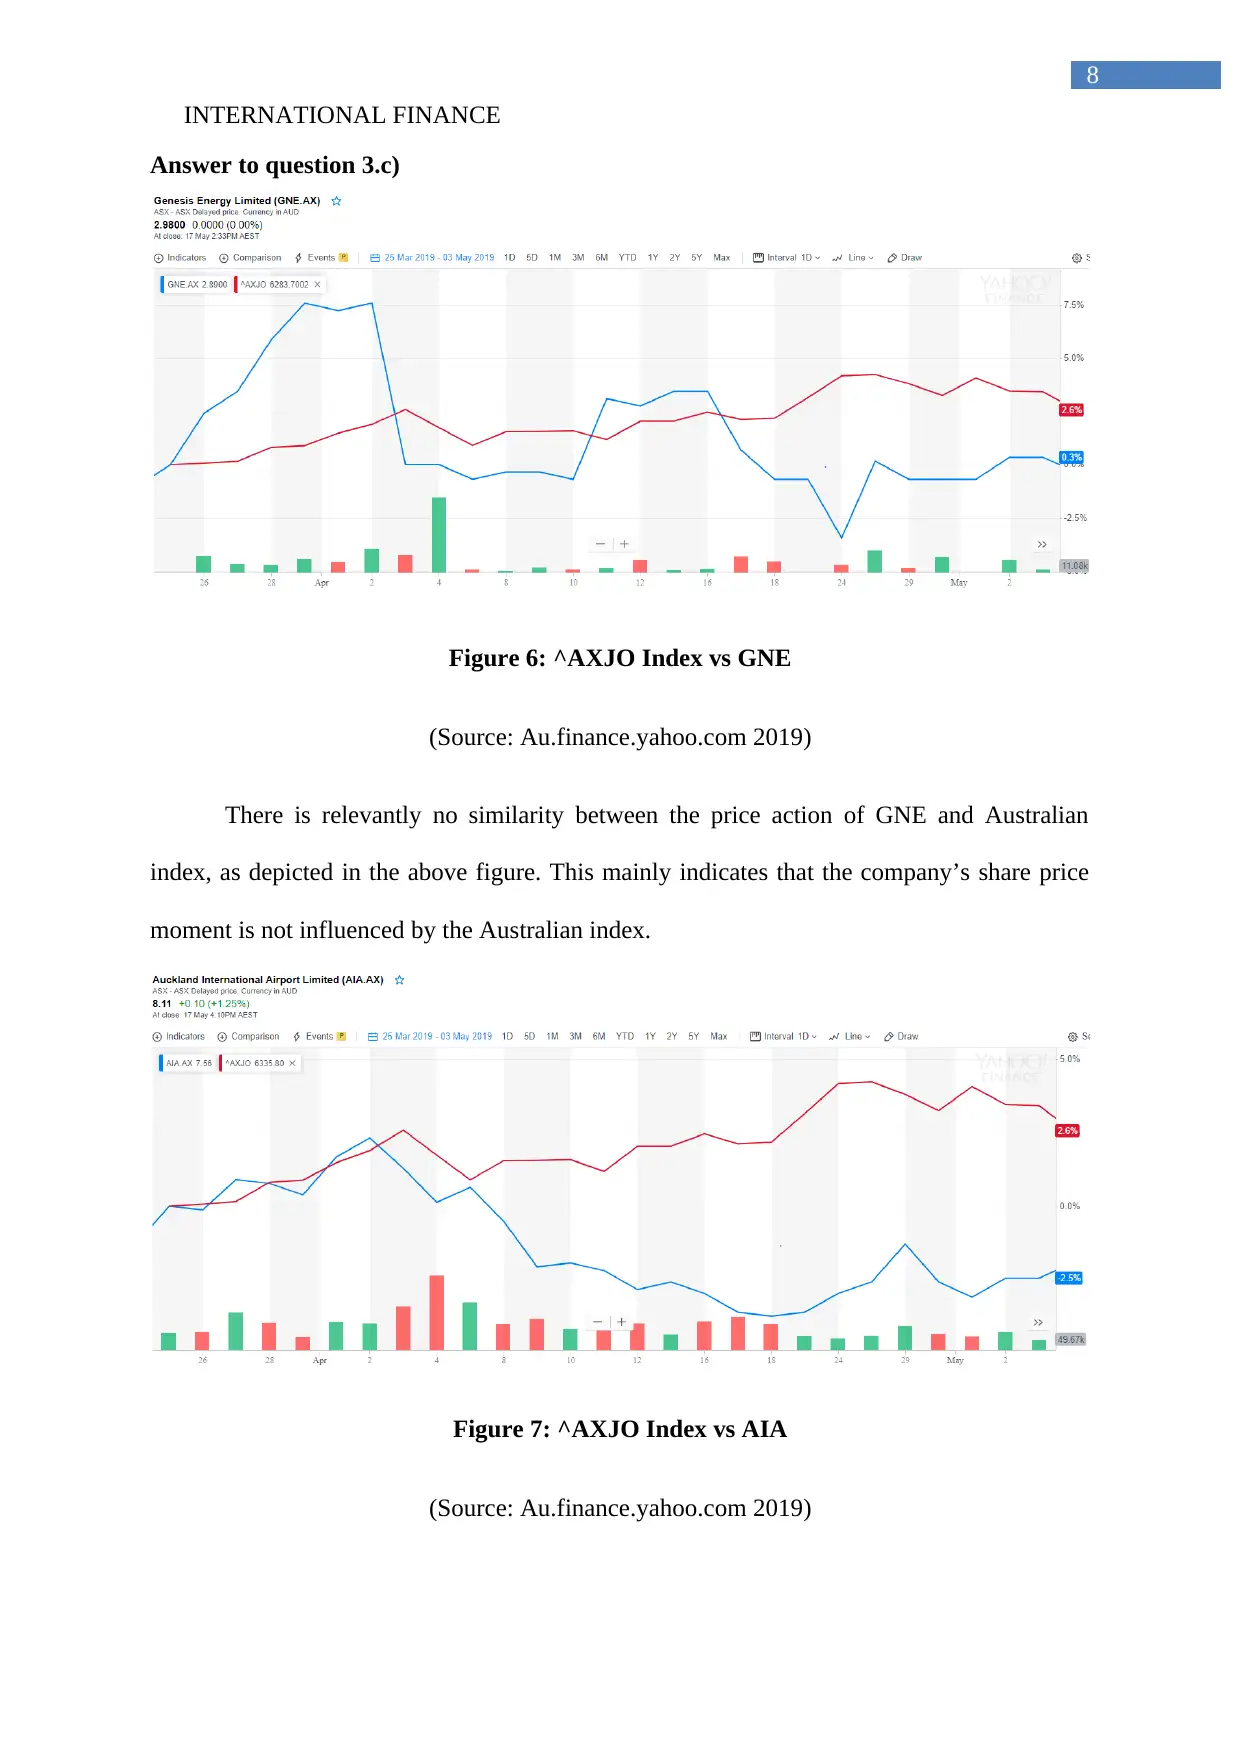
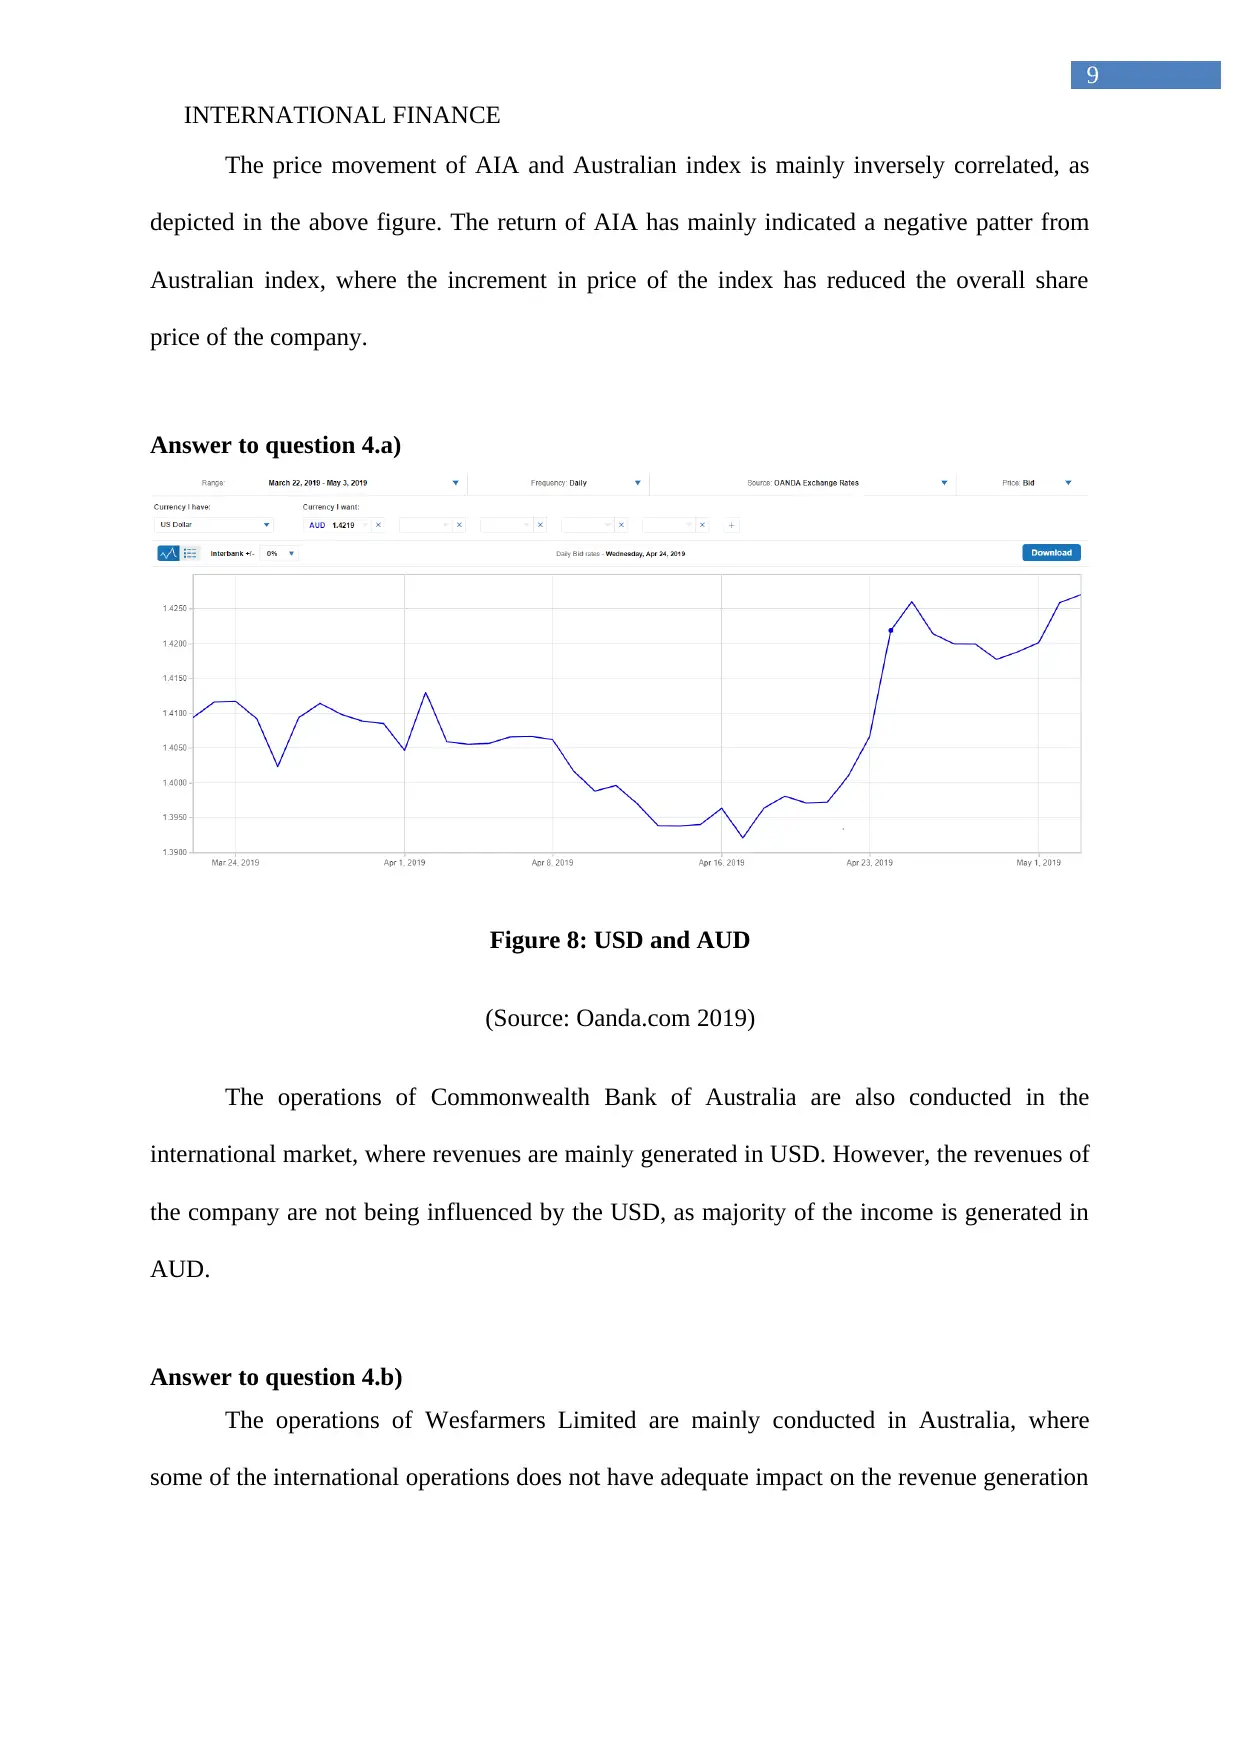
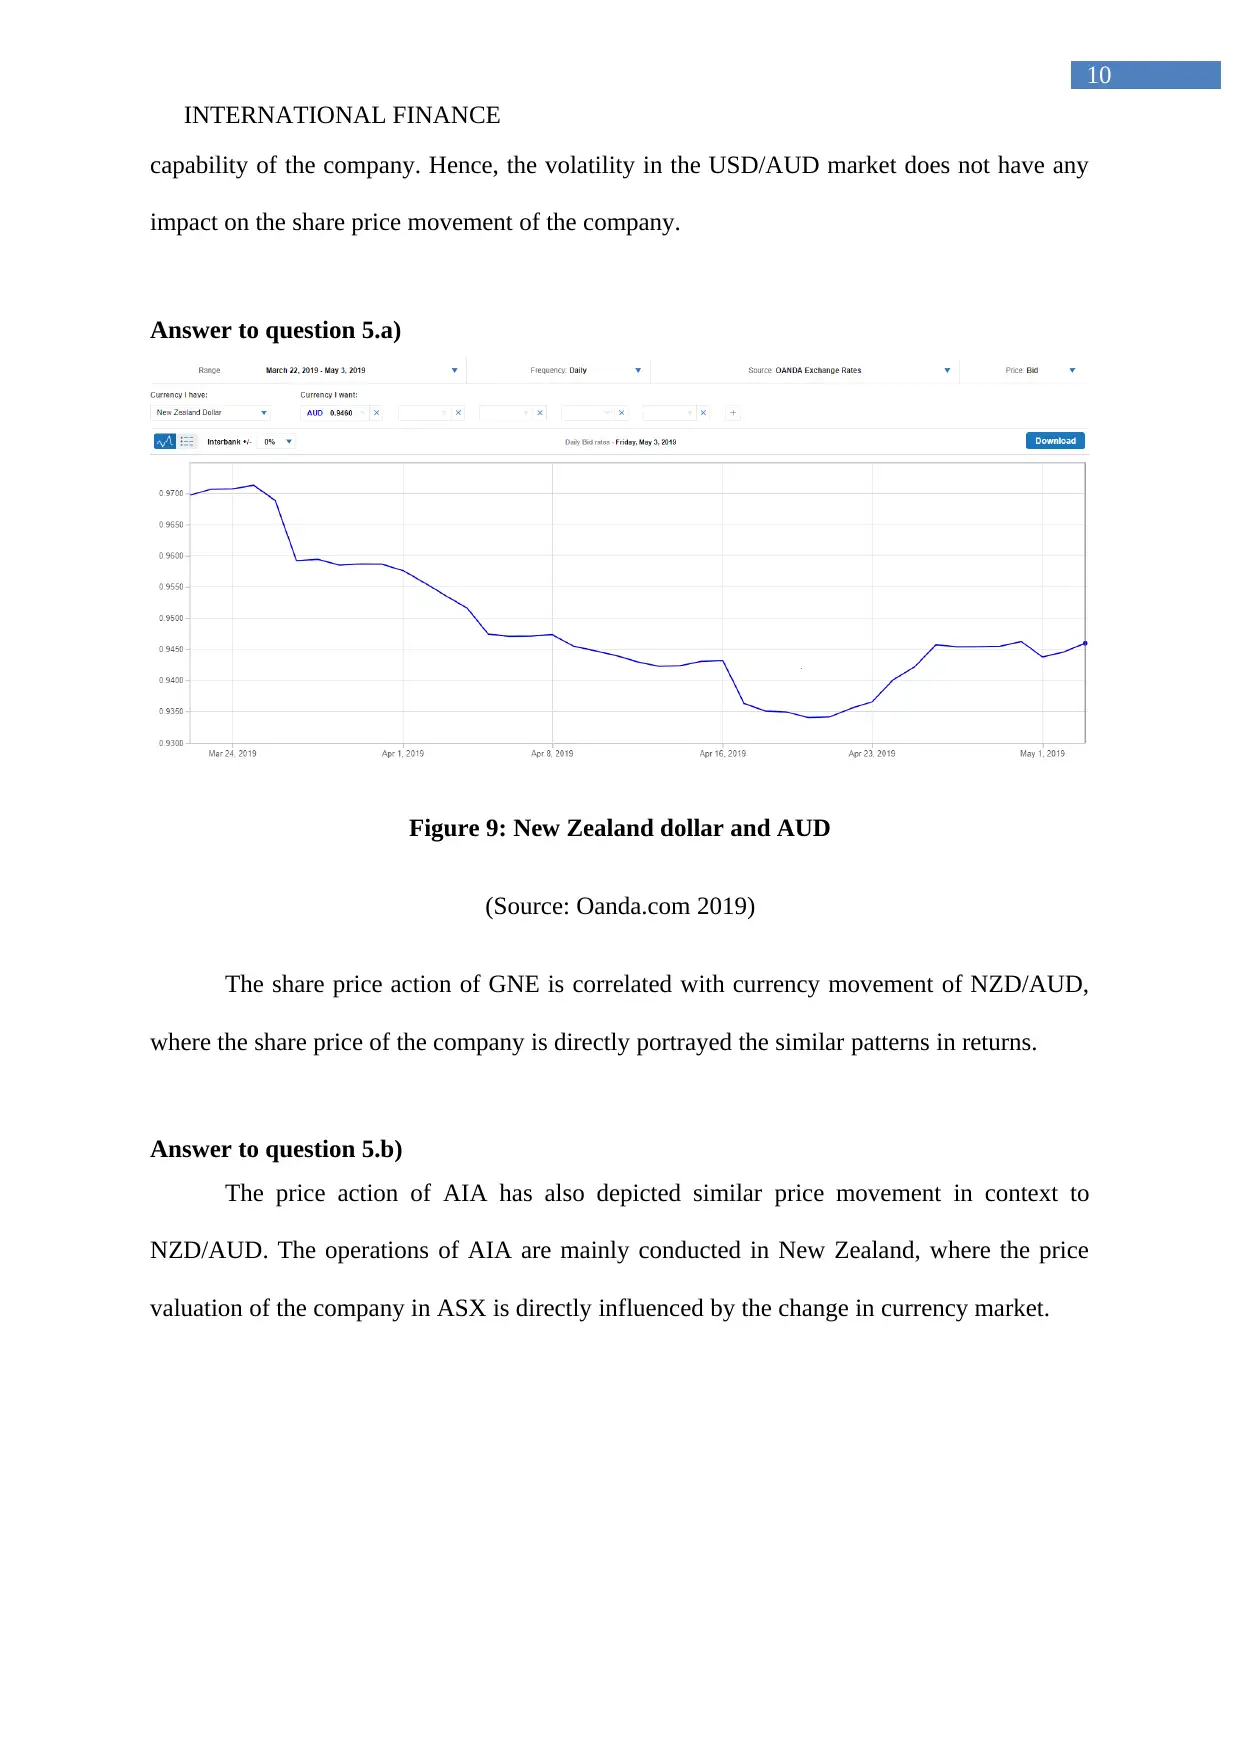
This project analyzes a student's international finance portfolio, comprising Australian multinational corporations and foreign stocks. The analysis covers the performance of the portfolio over a seven-week period, including weekly closing prices, percentage changes, and relevant news affecting the stocks. The report examines the returns generated by the portfolio, identifying the best and worst performing stocks. It also involves a comparative analysis of the portfolio stocks with relevant market indexes, like the Australian and New Zealand indexes, to determine correlation and market influence. Furthermore, the project investigates the impact of currency fluctuations (USD/AUD and NZD/AUD) on the share price movements of the selected companies, offering insights into the factors driving their valuations. The analysis includes graphical representations and references to financial data sources.

Running head: INTERNATIONAL FINANCE
International Finance
Name of the Student:
Name of the University:
Authors Note:
International Finance
Name of the Student:
Name of the University:
Authors Note:
Secure Best Marks with AI Grader
Need help grading? Try our AI Grader for instant feedback on your assignments.

INTERNATIONAL FINANCE
1
Table of Contents
Answer to question 1.a)..............................................................................................................2
Answer to question 1.b).............................................................................................................4
Answer to question 2)................................................................................................................4
Answer to question 3.a)..............................................................................................................6
Answer to question 3.b).............................................................................................................7
Answer to question 3.c)..............................................................................................................8
Answer to question 4.a)..............................................................................................................9
Answer to question 4.b).............................................................................................................9
Answer to question 5.a)............................................................................................................10
Answer to question 5.b)...........................................................................................................10
References:...............................................................................................................................11

INTERNATIONAL FINANCE
2
Answer to question 1.a)
Week 1 22-03-2019
Name of the
Company
Closing Price
(Weekly)
Percentag
e Change News
Commonwealth Bank
of Australia 71.400 0.000% Bought the shares
Wesfarmers Limited 34.800 0.000% Bought the shares
Genesis Energy
Limited 2.870 0.000% Bought the shares
Auckland
International Airport
Limited 7.650 0.000% Bought the shares
Portfolio Average 0.000%
Week 2 29-03-2019
Name of the
Company
Closing Price
(Weekly)
Percentag
e Change News
Commonwealth Bank
of Australia 70.640 -1.064%
Leading broker report on selling
shares of CBA
Wesfarmers Limited 34.650 -0.431% Lynas acquisition proposal update
Genesis Energy
Limited 3.120 8.711%
Report in financial strong operations
of genesis
Auckland
International Airport
Limited 7.780 1.699%
Report on the impressive capital
employed of Auckland international
Portfolio Average 2.229%
Week 3 05-04-2019
Name of the
Company
Closing Price
(Weekly)
Percentag
e Change News
Commonwealth Bank
of Australia 70.890 0.354%
Election has been called and market is
reacting to the news
Wesfarmers Limited 34.210 -1.270%
Analyst negative reaction on
Wesfarmers regarding its share price
Genesis Energy
Limited 2.880 -7.692%
Negative price movement due to
market
Auckland
International Airport
Limited 7.800 0.257% Market price movement
Portfolio Average -2.088%
Week 4 12-04-2019
Name of the
Company
Closing Price
(Weekly)
Percentag
e Change News

INTERNATIONAL FINANCE
3
Commonwealth Bank
of Australia 71.630 1.044% Warren Buffet buys shares of CBA
Wesfarmers Limited 34.730 1.520% Wesfarmers eyes on lithium miners
Genesis Energy
Limited 2.880 0.000% No stable news
Auckland
International Airport
Limited 7.530 -3.462%
Declaration of dividends and
disappointment from shareholders
Portfolio Average -0.224%
Week 5 19-04-2019
Name of the
Company
Closing Price
(Weekly)
Percentag
e Change News
Commonwealth Bank
of Australia 73.580 2.722%
CBA plans to boost profits by $2
billion
Wesfarmers Limited 35.090 1.037% News from analyst
Genesis Energy
Limited 2.880 0.000% No stable news
Auckland
International Airport
Limited 7.510 -0.266% Market news no stable movement
Portfolio Average 0.873%
Week 6 26-04-2019
Name of the
Company
Closing Price
(Weekly)
Percentag
e Change News
Commonwealth Bank
of Australia 75.450 2.541%
News regarding the 8.3% dividend
yield by CBA
Wesfarmers Limited 35.990 2.565%
Wesfarmers announces plan to
acquire lithium miner
Genesis Energy
Limited 2.905 0.868% Report on the fair value of Genesis
Auckland
International Airport
Limited 7.550 0.533%
Report of high shareholder return
from Auckland international
Portfolio Average 1.627%
Week 7 03-05-2019
Name of the
Company
Closing Price
(Weekly)
Percentag
e Change News
Commonwealth Bank
of Australia 74.980 -0.623%
Macquarie Group warns about ASX
bank stock
Wesfarmers Limited 36.370 1.056%
Wesfarmers aims for Kidman
resources
Genesis Energy
Limited 2.910 0.172% CEO salary justified
Secure Best Marks with AI Grader
Need help grading? Try our AI Grader for instant feedback on your assignments.

INTERNATIONAL FINANCE
4
Auckland
International Airport
Limited 7.560 0.132%
Report of financially healthy
company
Portfolio Average 0.184%
Answer to question 1.b)
Stock 22 March 2019 03 May 2019 Return
Commonwealth Bank of Australia 71.40 74.98 5.01%
Wesfarmers Limited 34.80 36.37 4.51%
Genesis Energy Limited 2.87 2.91 1.39%
Auckland International Airport
Limited 7.65 7.56 -1.18%
Returns from the portfolio 2.44%
The calculation in the above table provides information about the overall return that
has been generated by the portfolio over the period of 7 weeks. From the relevant calculation,
it can be detected that the share price movement have generated a return of 2.44% for the
created portfolio. The highest return has been generated from Commonwealth Bank of
Australia, while Auckland International Airport Limited has provided the negative returns of
-1.18%.
Answer to question 2)

INTERNATIONAL FINANCE
5
Figure 1: ^AXJO Index vs CBA
(Source: Au.finance.yahoo.com 2019)
The information in the above figure states that the price action of CBA is
complemented by the Australian index. However, after 12th April the share price of CBA
increased more and the index.
Figure 2: ^AXJO Index vs WES
(Source: Au.finance.yahoo.com 2019)
The share price movement of Wesfarmers share price movement directly
complements the Australian index, where the price movement has depicted similar pattern.
Hence, the increment in value of index has directly increased the level of share price of
Wesfarmers.

INTERNATIONAL FINANCE
6
Answer to question 3.a)
Figure 3: ^NZ50 Index vs GNE
(Source: Au.finance.yahoo.com 2019)
The overall share price of GNE is not linked with the New Zealand Index, as seen in
the above figure, as the overall share price decline was not complimented index movement.
Therefore, share price movement of GNE does not portray a positive correlation with the
New Zealand index.
Figure 4: ^NZ50 Index vs AIA
(Source: Au.finance.yahoo.com 2019)
Paraphrase This Document
Need a fresh take? Get an instant paraphrase of this document with our AI Paraphraser

INTERNATIONAL FINANCE
7
The share price movement of AIA has mainly depicted a positive correlation with the
New Zealand index, as the price of the stock are moving in similar direction. The returns of
the AIA mainly follow the pattern of New Zealand index.
Answer to question 3.b)
Figure 5: GNE vs AIA
(Source: Au.finance.yahoo.com 2019)
The overall correlation between GNE and AIA is mainly is relevantly positive, as the
pattern of returns are relevantly similar. Hence, it could be understood that returns of the both
the stock are highly correlated and can be used as an adequate investment option. However,
the returns of GNE have high volatility in comparison to AIA returns.

INTERNATIONAL FINANCE
8
Answer to question 3.c)
Figure 6: ^AXJO Index vs GNE
(Source: Au.finance.yahoo.com 2019)
There is relevantly no similarity between the price action of GNE and Australian
index, as depicted in the above figure. This mainly indicates that the company’s share price
moment is not influenced by the Australian index.
Figure 7: ^AXJO Index vs AIA
(Source: Au.finance.yahoo.com 2019)

INTERNATIONAL FINANCE
9
The price movement of AIA and Australian index is mainly inversely correlated, as
depicted in the above figure. The return of AIA has mainly indicated a negative patter from
Australian index, where the increment in price of the index has reduced the overall share
price of the company.
Answer to question 4.a)
Figure 8: USD and AUD
(Source: Oanda.com 2019)
The operations of Commonwealth Bank of Australia are also conducted in the
international market, where revenues are mainly generated in USD. However, the revenues of
the company are not being influenced by the USD, as majority of the income is generated in
AUD.
Answer to question 4.b)
The operations of Wesfarmers Limited are mainly conducted in Australia, where
some of the international operations does not have adequate impact on the revenue generation
Secure Best Marks with AI Grader
Need help grading? Try our AI Grader for instant feedback on your assignments.

INTERNATIONAL FINANCE
10
capability of the company. Hence, the volatility in the USD/AUD market does not have any
impact on the share price movement of the company.
Answer to question 5.a)
Figure 9: New Zealand dollar and AUD
(Source: Oanda.com 2019)
The share price action of GNE is correlated with currency movement of NZD/AUD,
where the share price of the company is directly portrayed the similar patterns in returns.
Answer to question 5.b)
The price action of AIA has also depicted similar price movement in context to
NZD/AUD. The operations of AIA are mainly conducted in New Zealand, where the price
valuation of the company in ASX is directly influenced by the change in currency market.

INTERNATIONAL FINANCE
11
References:
Au.finance.yahoo.com. 2019. Yahoo is now a part of Oath. [online] Available at:
https://au.finance.yahoo.com/quote/%5EAORD?p=^AORD [Accessed 19 May 2019].
Oanda.com. 2019. Historical Currency Converter | OANDA. [online] Available at:
https://www1.oanda.com/fx-for-business/historical-rates?
view=graph&base=USD"e=EUR&duration [Accessed 19 May 2019].
1 out of 12
Related Documents

Your All-in-One AI-Powered Toolkit for Academic Success.
+13062052269
info@desklib.com
Available 24*7 on WhatsApp / Email
Unlock your academic potential
© 2024 | Zucol Services PVT LTD | All rights reserved.