International Finance Report: GDP, Current & Financial Accounts
VerifiedAdded on 2021/01/01
|9
|1992
|370
Report
AI Summary
This report provides a comprehensive analysis of Canada's international finance, examining key macroeconomic factors. It begins with an overview of Canada's Gross Domestic Product (GDP), presenting quarterly data from 2017 to 2018, and dissecting its components such as consumption, investment, government spending, and net exports. The report then delves into the current account, detailing its components like trade, net income, and direct transfers, alongside the impact of financial crises. Further, the report explores the financial account, differentiating it from the capital account and analyzing components such as direct investments and financial assets and liabilities. The balance of payments is also evaluated, including its relationship to GDP and justifications for its values. Finally, the report assesses the stock of foreign assets, evaluating their composition and trends. The report concludes with a summary of Canadian macroeconomic factors related to GDP generation, using statistical analysis of GDP, current account, financial account, balance of payments, and stock of assets.

INTERNATIONAL FINANCE
Paraphrase This Document
Need a fresh take? Get an instant paraphrase of this document with our AI Paraphraser
Table of Contents
INTRODUCTION...........................................................................................................................1
1. GDP..............................................................................................................................................1
a) Table........................................................................................................................................1
b) Component as a share of total.................................................................................................1
c) Pattern in shares as well as value that emerge across the categories and over time...............2
2. CURRENT ACCOUNT ..............................................................................................................2
a) Table of current account.........................................................................................................2
b) Value for 2017 Q2..................................................................................................................3
c) Major components in the current account...............................................................................3
d) The pattern of changes in the current account and impact of crisis........................................3
3. FINANCIAL ACCOUNT............................................................................................................4
a) Financial account and difference between financial account and capital account..................4
b)Value of components of financial account..............................................................................4
c) Components of financial accounts..........................................................................................4
d) Changes and impact of financial crisis...................................................................................4
4. BALANCE OF PAYMENT........................................................................................................5
a) Balance of payment.................................................................................................................5
b) Share on GDP.........................................................................................................................5
c) Magnitudes and the shares and d) Justification......................................................................5
5. STOCK OF ASSET.....................................................................................................................6
a) Evaluation of stock foreign assets...........................................................................................6
b) Relative composition..............................................................................................................6
CONCLUSION................................................................................................................................6
REFERENCES................................................................................................................................7
INTRODUCTION
International finance is one of the essential aspect subject to analyse the factors related to
generating gross domestic product (Clark, 2014). Economic position of a country represent the
capital structure, employment and consumption and expenditure rate.
1. GDP
a) Table
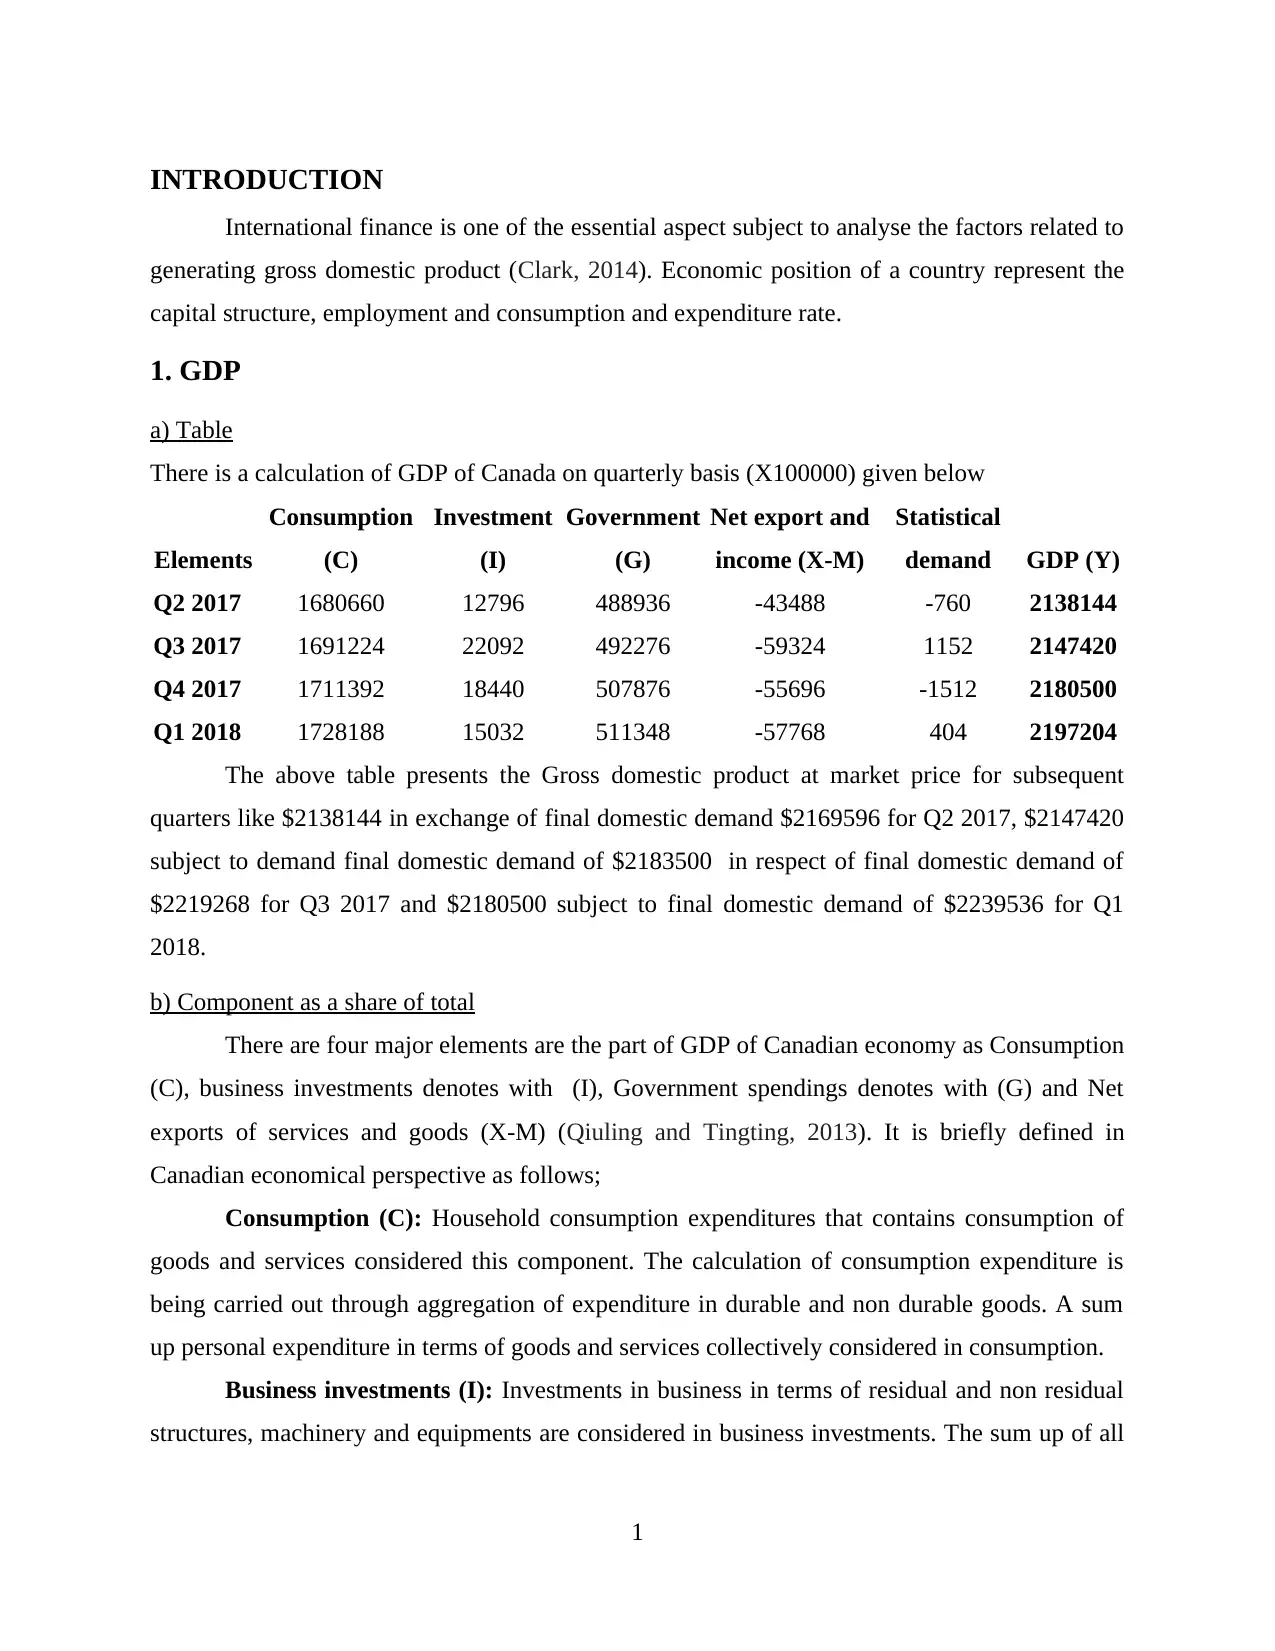
There is a calculation of GDP of Canada on quarterly basis (X100000) given below
Elements
Consumption
(C)
Investment
(I)
Government
(G)
Net export and
income (X-M)
Statistical
demand GDP (Y)
Q2 2017 1680660 12796 488936 -43488 -760 2138144
Q3 2017 1691224 22092 492276 -59324 1152 2147420
Q4 2017 1711392 18440 507876 -55696 -1512 2180500
Q1 2018 1728188 15032 511348 -57768 404 2197204
The above table presents the Gross domestic product at market price for subsequent
quarters like $2138144 in exchange of final domestic demand $2169596 for Q2 2017, $2147420
subject to demand final domestic demand of $2183500 in respect of final domestic demand of
$2219268 for Q3 2017 and $2180500 subject to final domestic demand of $2239536 for Q1
2018.
b) Component as a share of total
There are four major elements are the part of GDP of Canadian economy as Consumption
(C), business investments denotes with (I), Government spendings denotes with (G) and Net
exports of services and goods (X-M) (Qiuling and Tingting, 2013). It is briefly defined in
Canadian economical perspective as follows;
Consumption (C): Household consumption expenditures that contains consumption of
goods and services considered this component. The calculation of consumption expenditure is
being carried out through aggregation of expenditure in durable and non durable goods. A sum
up personal expenditure in terms of goods and services collectively considered in consumption.
Business investments (I): Investments in business in terms of residual and non residual
structures, machinery and equipments are considered in business investments. The sum up of all
1
International finance is one of the essential aspect subject to analyse the factors related to
generating gross domestic product (Clark, 2014). Economic position of a country represent the
capital structure, employment and consumption and expenditure rate.
1. GDP
a) Table
There is a calculation of GDP of Canada on quarterly basis (X100000) given below
Elements
Consumption
(C)
Investment
(I)
Government
(G)
Net export and
income (X-M)
Statistical
demand GDP (Y)
Q2 2017 1680660 12796 488936 -43488 -760 2138144
Q3 2017 1691224 22092 492276 -59324 1152 2147420
Q4 2017 1711392 18440 507876 -55696 -1512 2180500
Q1 2018 1728188 15032 511348 -57768 404 2197204
The above table presents the Gross domestic product at market price for subsequent
quarters like $2138144 in exchange of final domestic demand $2169596 for Q2 2017, $2147420
subject to demand final domestic demand of $2183500 in respect of final domestic demand of
$2219268 for Q3 2017 and $2180500 subject to final domestic demand of $2239536 for Q1
2018.
b) Component as a share of total
There are four major elements are the part of GDP of Canadian economy as Consumption
(C), business investments denotes with (I), Government spendings denotes with (G) and Net
exports of services and goods (X-M) (Qiuling and Tingting, 2013). It is briefly defined in
Canadian economical perspective as follows;
Consumption (C): Household consumption expenditures that contains consumption of
goods and services considered this component. The calculation of consumption expenditure is
being carried out through aggregation of expenditure in durable and non durable goods. A sum
up personal expenditure in terms of goods and services collectively considered in consumption.
Business investments (I): Investments in business in terms of residual and non residual
structures, machinery and equipments are considered in business investments. The sum up of all
1
⊘ This is a preview!⊘
Do you want full access?
Subscribe today to unlock all pages.
Trusted by 1+ million students worldwide
these elements collectively considered as business gross fixed capital formation or business
investments.
Government spendings (G): it is the referred to the allocation of financial spending
which has been carried out by the government to fulfil needs and requirements of nation.
Net exports of services and goods (X-M): excess of export of goods and services over
import is considered in this category.
c) Pattern in shares as well as value that emerge across the categories and over time
Personal consumption expenditure (C)
As per above table, results presents continuous increment of consumption in Canada.
Significant growth was subject to personal consumption expenditure in Canadian economics as
062% in Q3 2017, 1.19% for Q4 2017 and 0.98% for Q1 2018.
Business investments (I): There is an increment of 72.64% recorded in terms of business
investments for Q3 2017, deficiency recorded as -16.53% for Q3 2017, deficiency get increased
by -18.48 % for Q1 2018.
Government spendings (G): Significant improvement was seen in Q3 2017 in respect of
government spending with 0.68%, expenditures on business inventories get increased in the
fourth quarter of 2017 which resulted increment in the rate of quarterly government spendings as
3.16%, the rate was same for Q1 2018 subject to investing in capital formation was recorded as
0.683% (Zulfiqar and et. al., 2014).
Net exports of services and goods (X-M): Net Export of goods and services over import
was recorded as 36.41% for the year 2017 in Q3, It is seen that import get increased on regular
basis and significant decrement was recorded in import for Q4 2017, import get increased due to
which the difference between export and import also increased by 3.72%.
Impact of financial crisis 2008: Residential construction recorded at high rate and
federal reserve of the central banking reduced the interest tares. Low interest rates helped to
increased in credits for household and residential construction in country. Significant growth was
recorded in respect of schools, hospitals, factories, shopping centres, dams, dredging and
petrochemical plants. Canada is considered as one of the nation which was benefited due to
occurrence of the 2008 financial crisis.
2
Paraphrase This Document
Need a fresh take? Get an instant paraphrase of this document with our AI Paraphraser
2. CURRENT ACCOUNT
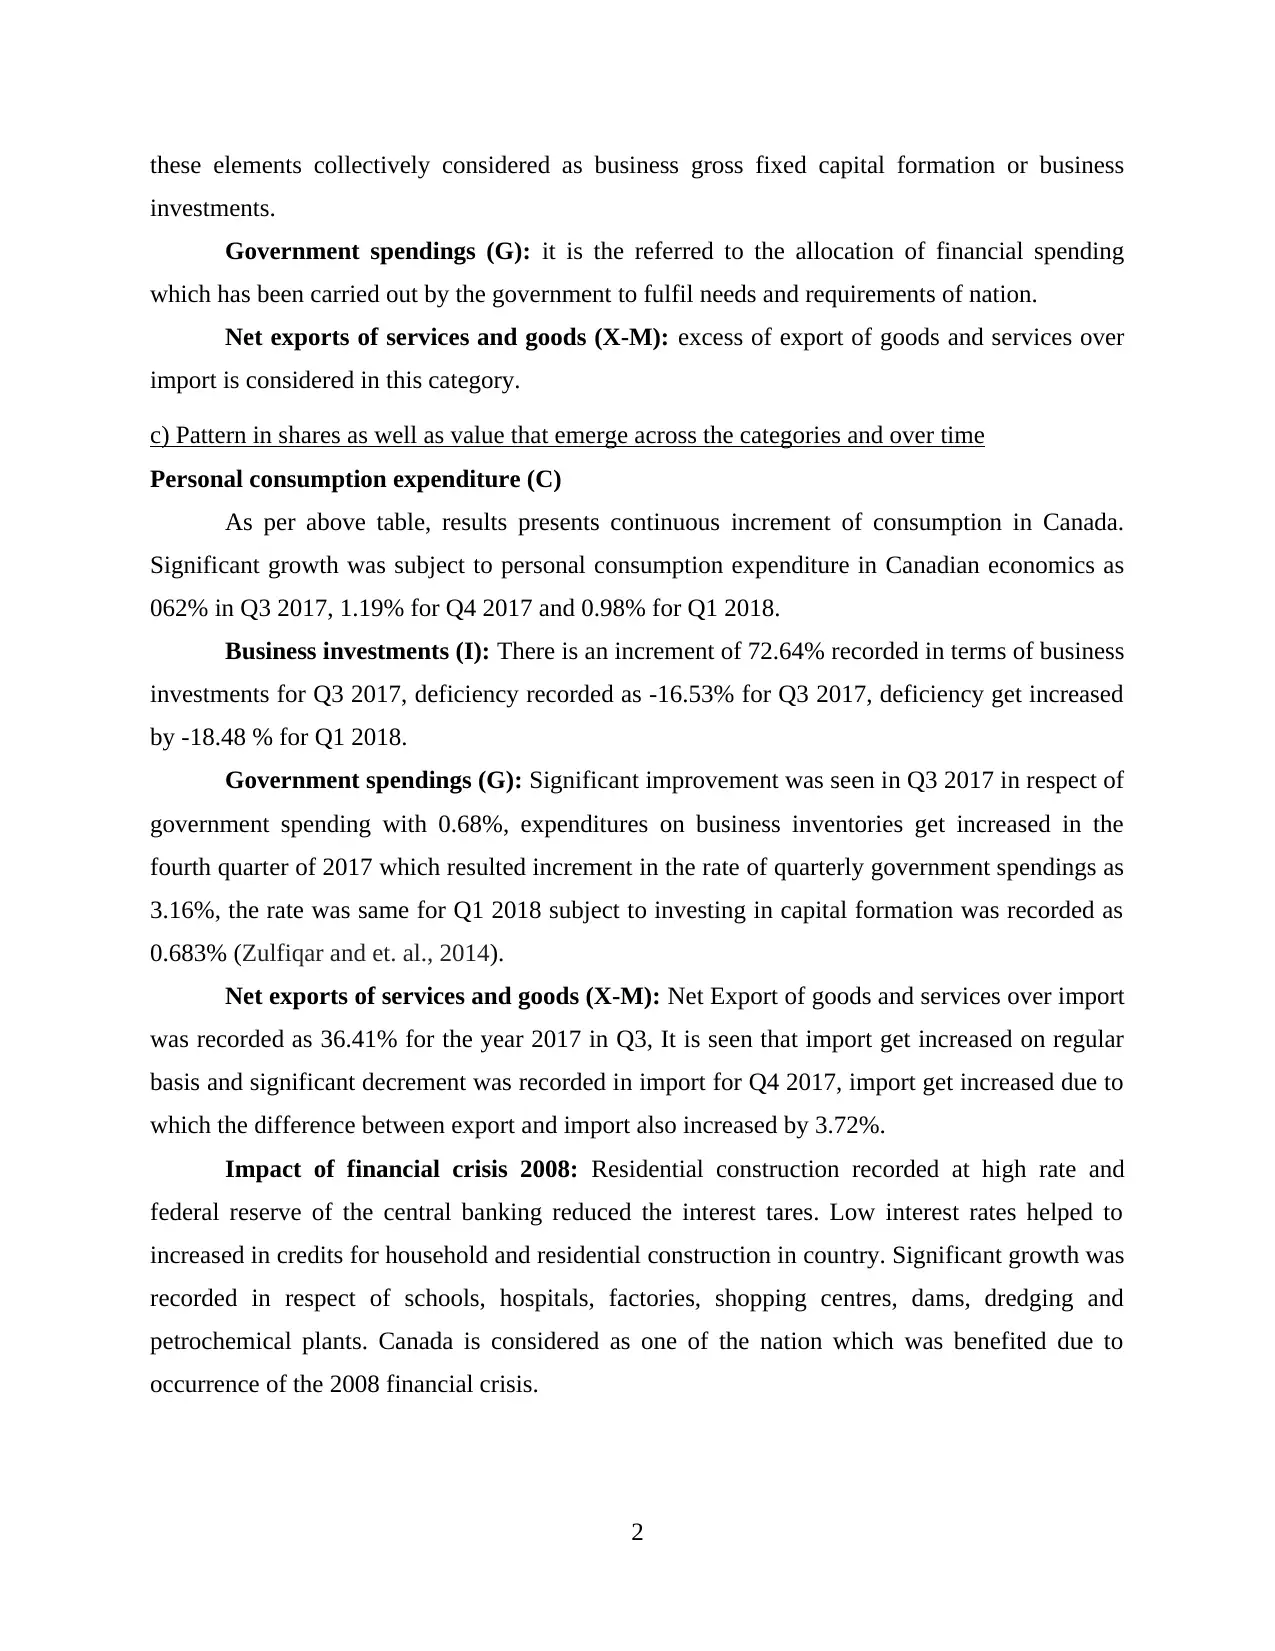
a) Table of current account
Current account
Receipts, seasonally
adjusted
Payments, seasonally
adjusted
Balances seasonally
adjusted
Q2 2017 201189 216077 -14888
Q3 2017 191931 209858 -17927
Q4 2017 200937 217423 -16486
Q1 2018 203823 221299 -17476
b) Value for 2017 Q2
There is a deficit recorded in terms of receipts and payment of balances for Q2 2017. a
deficiency of -$14888 million record in terms of seasonally adjustments. The situation of deficit
is defined to be a situation in which receipt falls short of payments. The main reason of deficit is
considered as less investment in direct investment and portfolio investment income.
c) Major components in the current account
There are 4 type of major components associated with current account like;
Trade: This contains transaction of goods and services with in and outside the economy.
Net income: this is the difference between the net receivables and net income paid to
outsiders. Direct investment is in surplus and direct investment income is in deficit.
Direct Transfers: it contains the payment made by the employees or workers outside the
country.
Asset income: The income which is generated through deposits and services to third
parties are in deficit with $-5926 million, sale of foreign based securities and direct investment
income are in surplus with $4235 million.
d) The pattern of changes in the current account and impact of crisis
Major impact of financial crisis fall upon the foreign investment and security transactions
in Canada subject to current account deficit as investment income and the goods and services to
third parties.
3
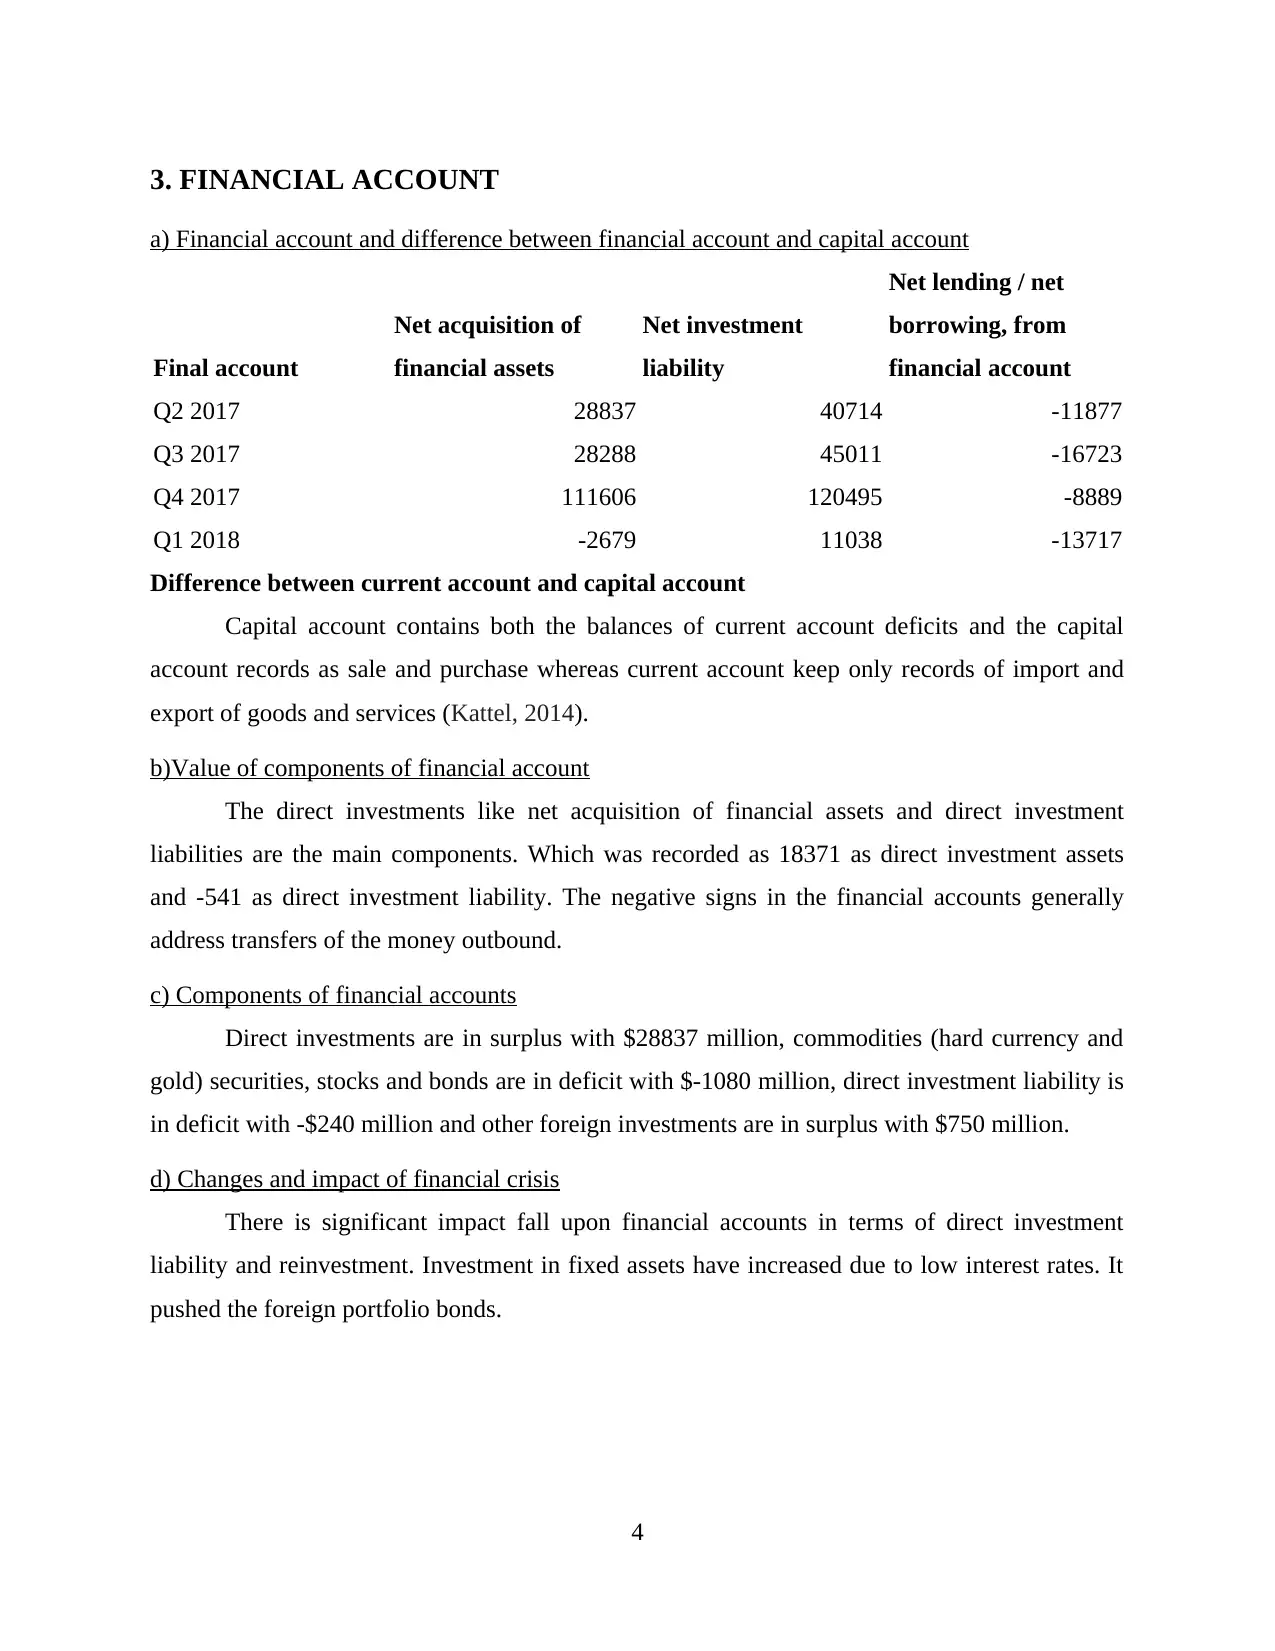
3. FINANCIAL ACCOUNT
a) Financial account and difference between financial account and capital account
Final account
Net acquisition of
financial assets
Net investment
liability
Net lending / net
borrowing, from
financial account
Q2 2017 28837 40714 -11877
Q3 2017 28288 45011 -16723
Q4 2017 111606 120495 -8889
Q1 2018 -2679 11038 -13717
Difference between current account and capital account
Capital account contains both the balances of current account deficits and the capital
account records as sale and purchase whereas current account keep only records of import and
export of goods and services (Kattel, 2014).
b)Value of components of financial account
The direct investments like net acquisition of financial assets and direct investment
liabilities are the main components. Which was recorded as 18371 as direct investment assets
and -541 as direct investment liability. The negative signs in the financial accounts generally
address transfers of the money outbound.
c) Components of financial accounts
Direct investments are in surplus with $28837 million, commodities (hard currency and
gold) securities, stocks and bonds are in deficit with $-1080 million, direct investment liability is
in deficit with -$240 million and other foreign investments are in surplus with $750 million.
d) Changes and impact of financial crisis
There is significant impact fall upon financial accounts in terms of direct investment
liability and reinvestment. Investment in fixed assets have increased due to low interest rates. It
pushed the foreign portfolio bonds.
4
⊘ This is a preview!⊘
Do you want full access?
Subscribe today to unlock all pages.
Trusted by 1+ million students worldwide
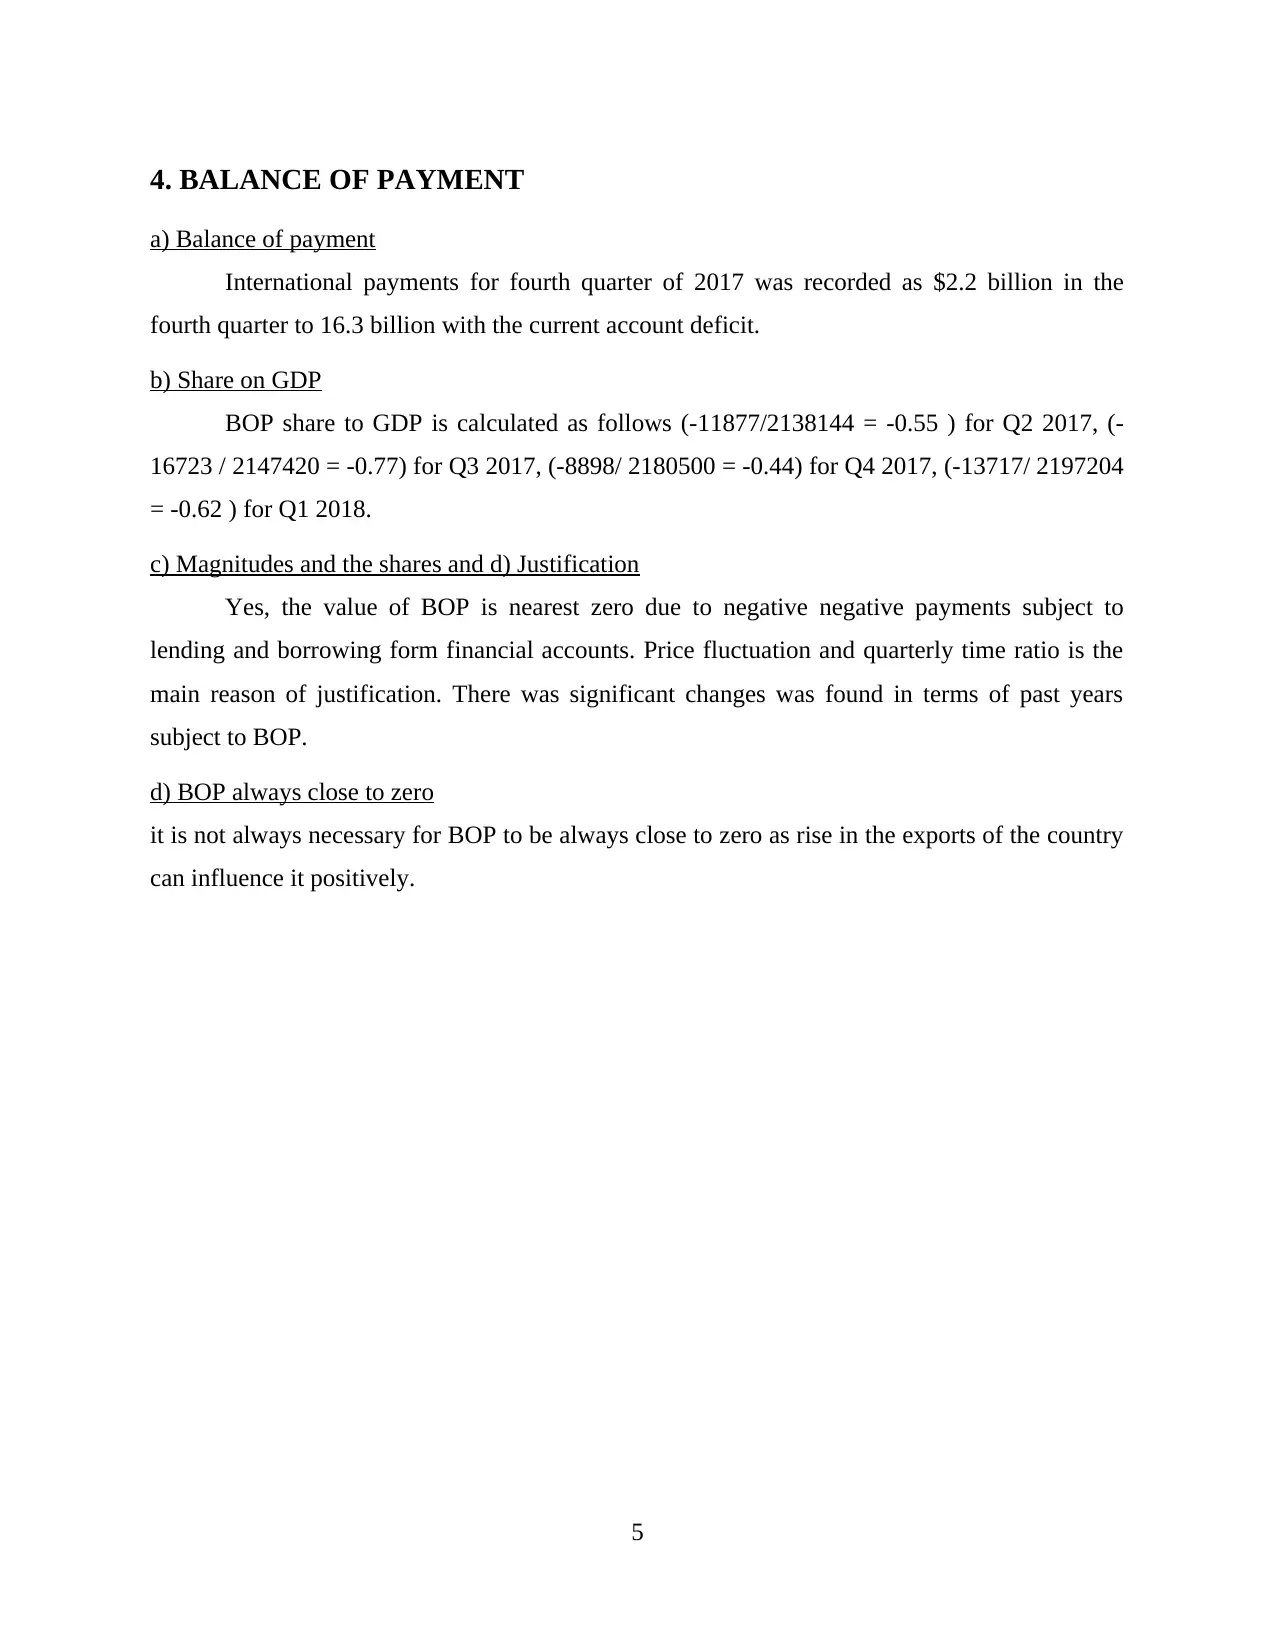
4. BALANCE OF PAYMENT
a) Balance of payment
International payments for fourth quarter of 2017 was recorded as $2.2 billion in the
fourth quarter to 16.3 billion with the current account deficit.
b) Share on GDP
BOP share to GDP is calculated as follows (-11877/2138144 = -0.55 ) for Q2 2017, (-
16723 / 2147420 = -0.77) for Q3 2017, (-8898/ 2180500 = -0.44) for Q4 2017, (-13717/ 2197204
= -0.62 ) for Q1 2018.
c) Magnitudes and the shares and d) Justification
Yes, the value of BOP is nearest zero due to negative negative payments subject to
lending and borrowing form financial accounts. Price fluctuation and quarterly time ratio is the
main reason of justification. There was significant changes was found in terms of past years
subject to BOP.
d) BOP always close to zero
it is not always necessary for BOP to be always close to zero as rise in the exports of the country
can influence it positively.
5
Paraphrase This Document
Need a fresh take? Get an instant paraphrase of this document with our AI Paraphraser
5. STOCK OF ASSET
a) Evaluation of stock foreign assets
Canada is seeking for foreign investment and increasing the foreign investment in bonds
and stocks. However, slower growth was seen in respect of securities as to $29 billion. Net
inflows in 2017 was recorded as $190 billion.
b) Relative composition
Total bonds was counted as $9219 for march 2018, $8051 for April and 7972 for may
and 17653 for June.
CONCLUSION
Canadian macroeconomic factors related to generate the GDP are summarised in this
report. Statistical analysis subject to analyse GDP, current account, Financial account, balance of
payments and stock of assets are comprises in this report.
6
REFERENCES
Books and Journals:
Clark, J., 2014. International Dictionary of Insurance and Finance. Routledge.
Qiuling, H. and Tingting, Y., 2013. The Global and Local Factors of China’s Stock and Bond
Markets——Comparison based on Different Periods. Shanghai Finance. 1. p.016.
Zulfiqar, B. and et. al., 2014. Criteria of selecting bank in Pakistani banking sector: study of
banking customers in Sahiwal, Pakistan. International Journal of Managing Value and
Supply Chains. 5(4). p.19.
Kattel, I. K., 2014. Evaluating the financial solvency of selected commercial banks of Nepal: an
application of bankometer. Journal of Advanced Academic Research. 1(1). pp.88-95.
Online
Canadian economical analysis, 2018. [online]. Available
through:<https://www150.statcan.gc.ca/t1/tbl1/en/tv.action?pid=3610010401#tables>.
7
⊘ This is a preview!⊘
Do you want full access?
Subscribe today to unlock all pages.
Trusted by 1+ million students worldwide
1 out of 9
Related Documents


Your All-in-One AI-Powered Toolkit for Academic Success.
+13062052269
info@desklib.com
Available 24*7 on WhatsApp / Email
![[object Object]](/_next/static/media/star-bottom.7253800d.svg)
Unlock your academic potential
Copyright © 2020–2026 A2Z Services. All Rights Reserved. Developed and managed by ZUCOL.