Detailed Analysis of International Banking and Finance Trading Report
VerifiedAdded on 2021/01/02
|20
|5858
|414
Report
AI Summary
This report provides an executive summary and detailed analysis of trading activities within international banking and finance. It covers various trading strategies, including day trading and position trading, and examines the use of theoretical tools to support these strategies. The report analyzes trading data from the Easy Trade Platform over a one-year period, detailing transactions in multiple currencies and financial instruments, such as the Nikkei Index, Nasdaq, and Cryptoresuce. It also discusses risk management activities, including Mark to Market valuation. The analysis includes the application of both fundamental and technical analysis, along with the utilization of take profit and stop loss orders. The report aims to provide insights into the complexities of international finance and the strategies employed to navigate market fluctuations.

International Banking and
Finance
Finance
Paraphrase This Document
Need a fresh take? Get an instant paraphrase of this document with our AI Paraphraser
EXECUTIVE SUMMARY
The report summaries the entire different trading activities that are part of indices trading
during an accounting period. There are several trading strategy that support to make specific
decision in respect to trade in particular currency such as day trading that is a methods of selling
and buying of securities in a day to gain profit. Position trading is a method to buy and hold
stock that are performed by advance trader for longer term. This kind of trade last of many days
or week according to the trend in market. Report discuss the types of financial instrument that
are consider to be assets that could be traded and can be seen as packages if capital that might get
traded in upcoming time. Assorted financial instruments such as Nikkei Index, Nasdaq,
Crypotorescue the provide the flow and transfer of capital. In a respective time frame from
27/04/18 up-to 08/05/19 there were total 26 transaction in different currencies such as GBP,
NKI, USD, NZD, EUR, AUD, HSX, CNH etc. In that specific period there were losses in
account due to different reasons such as fluctuation in market and there were stop loss, many
time user itself closes the deal as there were better trading option in future. The user also take
profit by giving proper time to a respective deal when market condition are goods in short period
of time. The report also discuses risk management activities that are helpful in reducing the
excess losses to user in specific time frame. Such as Mark to market that is a valuation method in
which open position are market to forward market price so that trader may create chances of
potential profit and loss.
Table of Contents
EXEXUTIVE SUMMARY.............................................................................................................2
INTRODUCTION...........................................................................................................................2
MAIN BODY...................................................................................................................................2
Sophistication and Management of the Trading Strategy: ..........................................................2
Use of Theoretical Tools to support the trading strategies..........................................................3
Research and external sources:...................................................................................................4
Use of trade and risk management tools:.....................................................................................5
CONCLSION...................................................................................................................................6
REFERENCES ...............................................................................................................................7
1
⊘ This is a preview!⊘
Do you want full access?
Subscribe today to unlock all pages.
Trusted by 1+ million students worldwide
INTRODUCTION
In present time, international banking is defined as the arrangement of different financial
services provided by a residential bank of any particular country to the individual living in
different part of world (Edwards, Magee and Bassetti, 2018). The concept of international
finance also includes the deals in monetary interaction that usually happen in two or more
countries. It also includes, issues refer to financial management like foreign exchange and
political risk that might appear while controlling different multinational companies. In this
report, various different risk management activities, different trading strategy with the use of
theoretical tools are being described in this report.
MAIN BODY
Sophistication and Management of the Trading Strategy:
For the purpose of successful completion of this report, the data gathered on trading
transactions relates to one-year period commencing from May 8, 2018 to May 9, 2019. The
Trading activities undertaken have been carried out using the Easy Trade Platform, an online
trading site which provides multi-asset and multi-market information on which one can carry out
transactions. The total number of days that trading over which the trading has been conducted
sums up to 169 days in the whole one year period that has been taken into account.
Over the course of Trading Sessions, a number of deals had been stricken which varied
on the basis of nature as well as size of the transactions. Mainly Indices Trading had been
executed which was not restricted to a particular Index. Some of the most prominent indices
include Cryptoresuce (CPR), Nikkei Index (NKI), NASDAQ (NDQ), Hong Kong Exchange
(HSX) among others. For instance, Deal Reference 36631053 NKI/USD wherein a long position
had been undertaken to buy 0.40 NKI as on May 8, 2019. The Opening Rate was 21555, it was
closed in the same day after minutes of buying it on 21588 with a Profit of 93.96 AUD. Specific
for limit order the deal reference 34321263 AUD/USD was consider to make a buy of about
400,000 AUD on 30 Apr 2018 at 23:58. To buy this particular open rate was 0.7535 that was
closed on 08 may 2018 at 0.7460 with a loss of -4037.28 AUD. In context to limit order the
reference deal number was 36631353 USD/JPY used to buy 100,000 on 8 may 2019 at a forward
rate of 110.10 and was closed by user on 9 may 2019 at 109.89 as the trigger forwared date is on
10 may 2019. at this point there was a loss of -274.11 Aud. In a particular trading there were too
2
Paraphrase This Document
Need a fresh take? Get an instant paraphrase of this document with our AI Paraphraser
many currencies are used such as AUD, EUR, USD etc. after analysing market in order to gain
more profit through different stock. There have been different risky trade opted by the user such
as gold, oil, index trades because of high return. These option have a better chance of making
profit in shot term but at the same time there are huge risk as prices keeps on fluctuating and
there is less stability. Due to uneven stability in market trends there was number of losses that
must be consider while making any future decision. From losses user have determined and
learned that proper time and monitoring must be given to trade charts which help to make
meaningful decision. It is also important to know about the h$% before making any trade of real
money that help to avoid losses.
Use of Theoretical Tools to support the trading strategies
The trading strategies have been executed mainly in Day Trading and Forward Contracts.
Mostly Position Trading Strategy have been undertaken for concluding a particular trading
session (Obizhaeva and Wang, 2013). For instance, in the case of Copper Deal Reference
36459048 CPR/USD a long position has been taken for an Open Day Trading Session in which
5,000 units were bought of Copper on April 9, 2019 for 2.948 USD and sold on the same day
with Day P/L being a loss of 70.01 AUD. The MaR here includes 736.95USD at the opening rate
whereas the closing shows an equivalent loss of margin at risk (MaR) on sealing the deal. The
Currency Pair CPR/USD is related to Copper and U.S. Dollar wherein the cyclical nature is sued
to one's advantage. Along with this, both US Dollar and Copper reflect the state of world
economy with one being base for heavy, light as well as construction industries whereas the USD
depicts the currency base for other world monies.
As far as Forward Contracts are concerned Deal Reference 36631353 USD/JPY with an
expiration date of May 10, 2019, another long position has been held for 100,000 units at an
opening forward rate of 110.10 JPY. Here the MaR is 330225.00 JPY for the Open Forward
Trading. However, as the closing date is near, the deal was sealed on May 9, 2019 by taking a
short position for the Forward Contracts. The rationale behind undertaking this currency pair for
Future Contracts is related to the popularity with the presence of relatively low bid-ask spreads
and attractive liquidity features (Hardie and Howarth, 2013). Mostly the future contracts are not
held by traders up until the end which may result in decline of the overall value of the future
contract. In addition to this, the end of future contract also means undertaking the delivery of the
physical asset associated with such contracts.
3
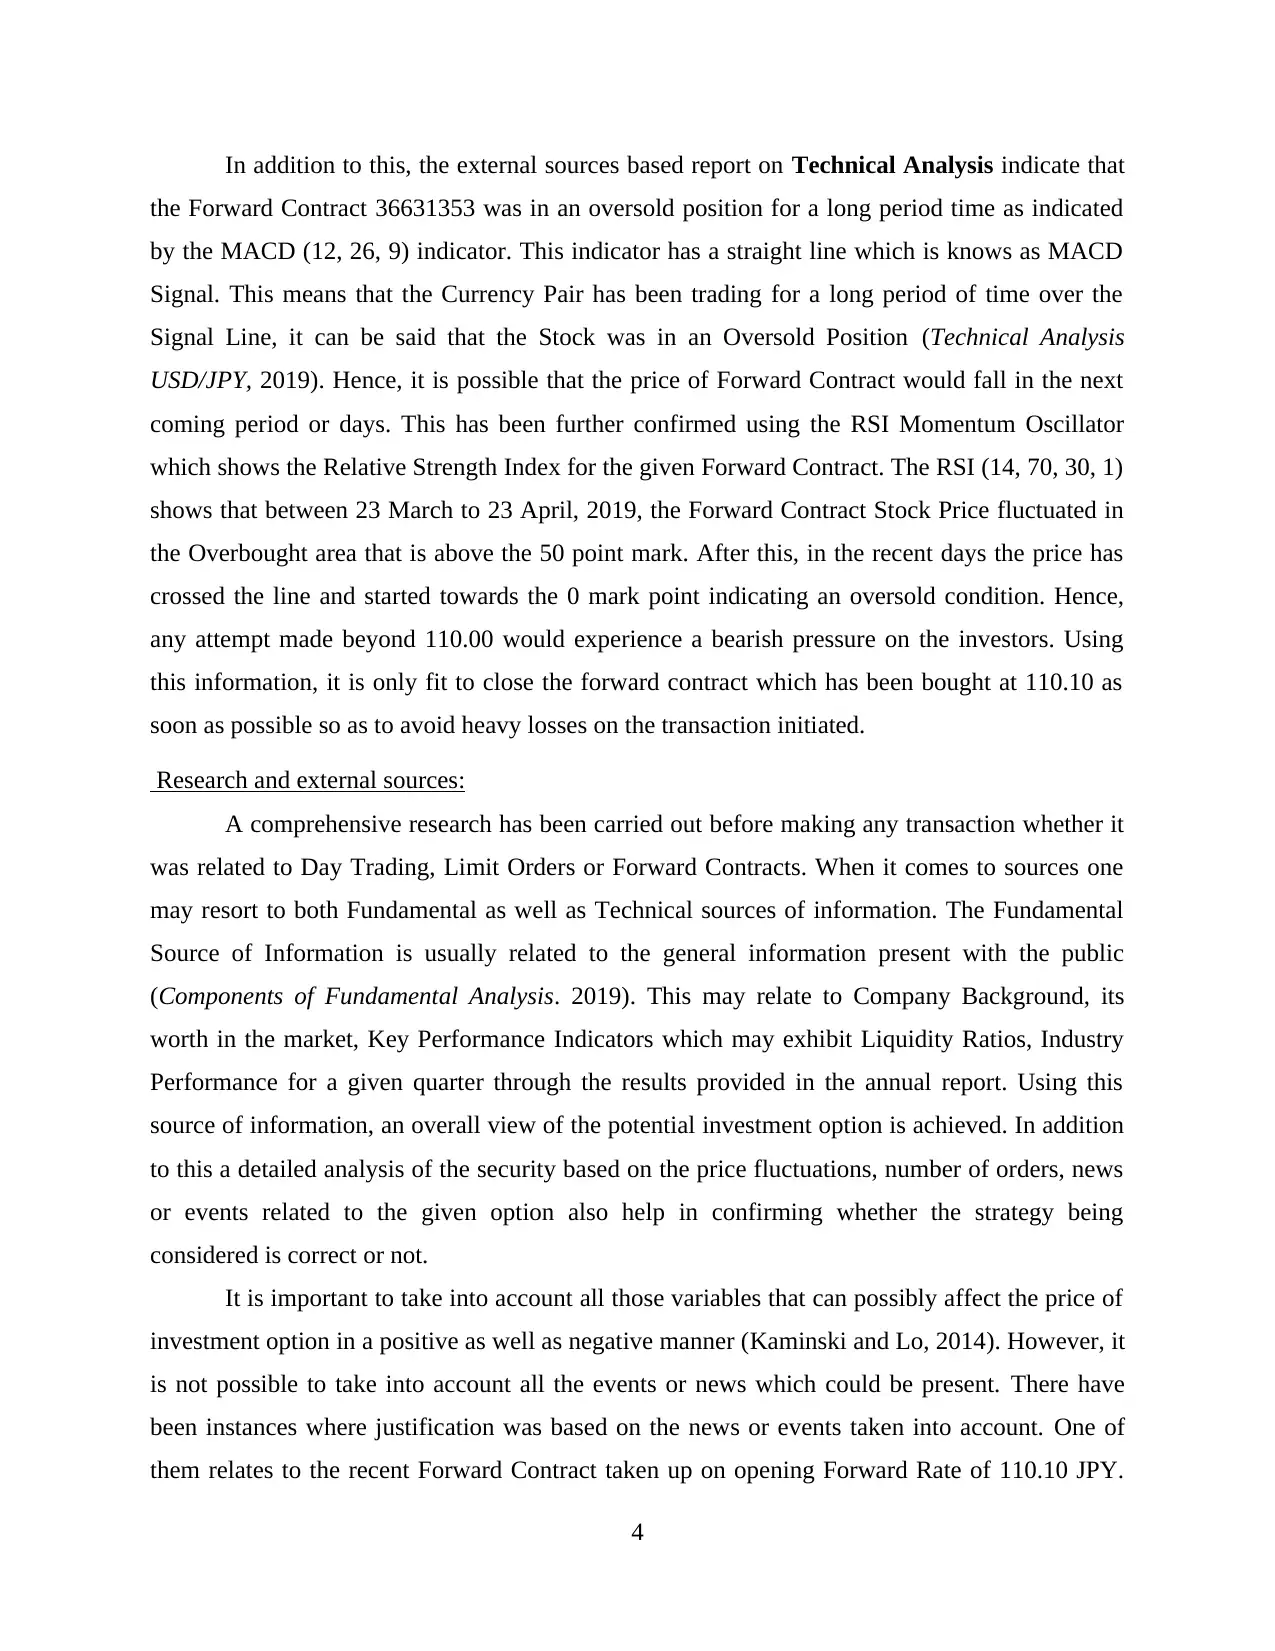
In addition to this, the external sources based report on Technical Analysis indicate that
the Forward Contract 36631353 was in an oversold position for a long period time as indicated
by the MACD (12, 26, 9) indicator. This indicator has a straight line which is knows as MACD
Signal. This means that the Currency Pair has been trading for a long period of time over the
Signal Line, it can be said that the Stock was in an Oversold Position (Technical Analysis
USD/JPY, 2019). Hence, it is possible that the price of Forward Contract would fall in the next
coming period or days. This has been further confirmed using the RSI Momentum Oscillator
which shows the Relative Strength Index for the given Forward Contract. The RSI (14, 70, 30, 1)
shows that between 23 March to 23 April, 2019, the Forward Contract Stock Price fluctuated in
the Overbought area that is above the 50 point mark. After this, in the recent days the price has
crossed the line and started towards the 0 mark point indicating an oversold condition. Hence,
any attempt made beyond 110.00 would experience a bearish pressure on the investors. Using
this information, it is only fit to close the forward contract which has been bought at 110.10 as
soon as possible so as to avoid heavy losses on the transaction initiated.
Research and external sources:
A comprehensive research has been carried out before making any transaction whether it
was related to Day Trading, Limit Orders or Forward Contracts. When it comes to sources one
may resort to both Fundamental as well as Technical sources of information. The Fundamental
Source of Information is usually related to the general information present with the public
(Components of Fundamental Analysis. 2019). This may relate to Company Background, its
worth in the market, Key Performance Indicators which may exhibit Liquidity Ratios, Industry
Performance for a given quarter through the results provided in the annual report. Using this
source of information, an overall view of the potential investment option is achieved. In addition
to this a detailed analysis of the security based on the price fluctuations, number of orders, news
or events related to the given option also help in confirming whether the strategy being
considered is correct or not.
It is important to take into account all those variables that can possibly affect the price of
investment option in a positive as well as negative manner (Kaminski and Lo, 2014). However, it
is not possible to take into account all the events or news which could be present. There have
been instances where justification was based on the news or events taken into account. One of
them relates to the recent Forward Contract taken up on opening Forward Rate of 110.10 JPY.
4
⊘ This is a preview!⊘
Do you want full access?
Subscribe today to unlock all pages.
Trusted by 1+ million students worldwide
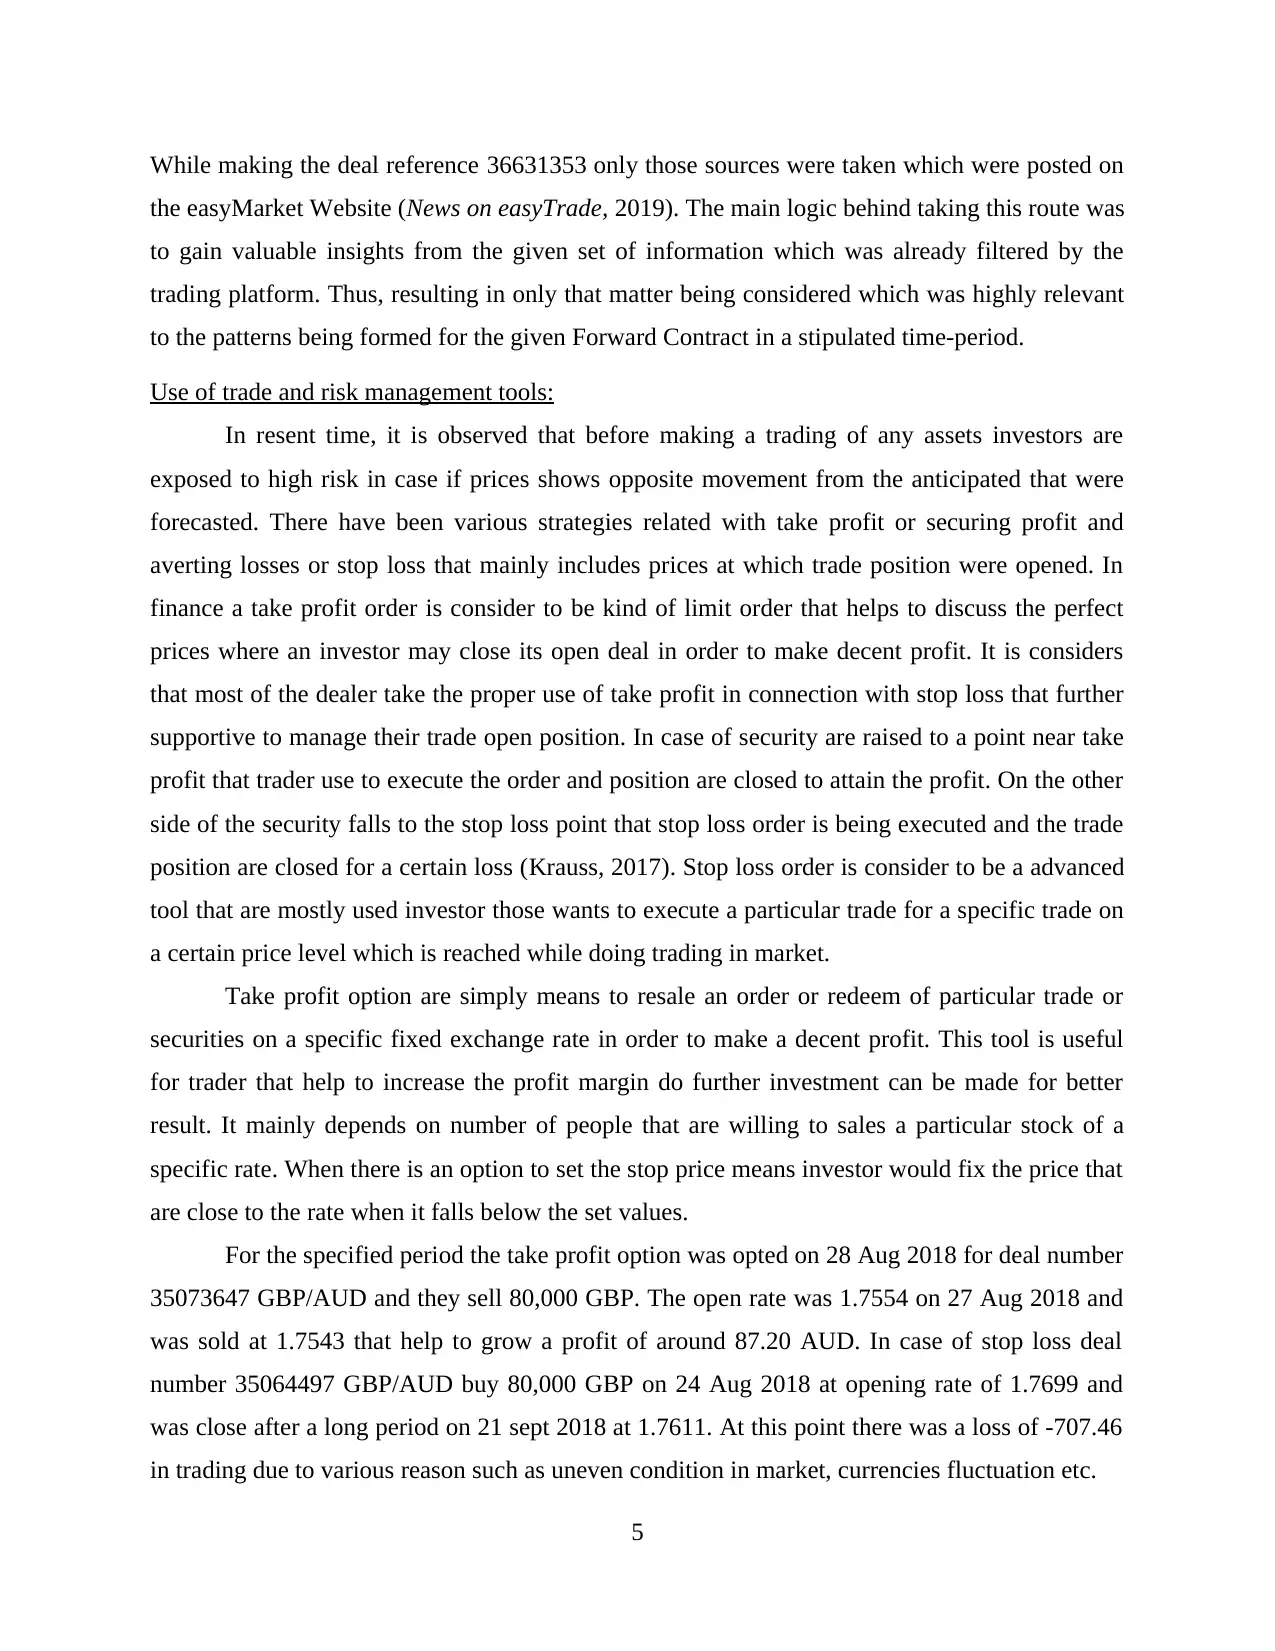
While making the deal reference 36631353 only those sources were taken which were posted on
the easyMarket Website (News on easyTrade, 2019). The main logic behind taking this route was
to gain valuable insights from the given set of information which was already filtered by the
trading platform. Thus, resulting in only that matter being considered which was highly relevant
to the patterns being formed for the given Forward Contract in a stipulated time-period.
Use of trade and risk management tools:
In resent time, it is observed that before making a trading of any assets investors are
exposed to high risk in case if prices shows opposite movement from the anticipated that were
forecasted. There have been various strategies related with take profit or securing profit and
averting losses or stop loss that mainly includes prices at which trade position were opened. In
finance a take profit order is consider to be kind of limit order that helps to discuss the perfect
prices where an investor may close its open deal in order to make decent profit. It is considers
that most of the dealer take the proper use of take profit in connection with stop loss that further
supportive to manage their trade open position. In case of security are raised to a point near take
profit that trader use to execute the order and position are closed to attain the profit. On the other
side of the security falls to the stop loss point that stop loss order is being executed and the trade
position are closed for a certain loss (Krauss, 2017). Stop loss order is consider to be a advanced
tool that are mostly used investor those wants to execute a particular trade for a specific trade on
a certain price level which is reached while doing trading in market.
Take profit option are simply means to resale an order or redeem of particular trade or
securities on a specific fixed exchange rate in order to make a decent profit. This tool is useful
for trader that help to increase the profit margin do further investment can be made for better
result. It mainly depends on number of people that are willing to sales a particular stock of a
specific rate. When there is an option to set the stop price means investor would fix the price that
are close to the rate when it falls below the set values.
For the specified period the take profit option was opted on 28 Aug 2018 for deal number
35073647 GBP/AUD and they sell 80,000 GBP. The open rate was 1.7554 on 27 Aug 2018 and
was sold at 1.7543 that help to grow a profit of around 87.20 AUD. In case of stop loss deal
number 35064497 GBP/AUD buy 80,000 GBP on 24 Aug 2018 at opening rate of 1.7699 and
was close after a long period on 21 sept 2018 at 1.7611. At this point there was a loss of -707.46
in trading due to various reason such as uneven condition in market, currencies fluctuation etc.
5
Paraphrase This Document
Need a fresh take? Get an instant paraphrase of this document with our AI Paraphraser

CONCLSION
From the above report, it is concluded that different theoretical models and risk
management tool are used to analyse the trends in market. With the implementation of various
trading strategies are useful in day and position trading stock are trade on subsequent date in
order to maximise profit and mitigate risk.
6
REFERENCES
Books and Journals:
Edwards, R. D., Magee, J. and Bassetti, W. C., 2018. Technical analysis of stock trends. CRC
press.
Hardie, I. and Howarth, D. eds., 2013. Market-based banking and the international financial
crisis. Oxford University Press.
Kaminski, K. M. and Lo, A. W., 2014. When do stop-loss rules stop losses?. Journal of
Financial Markets. 18. pp.234-254.
Krauss, C., 2017. Statistical arbitrage pairs trading strategies: Review and outlook. Journal of
Economic Surveys. 31(2). pp.513-545.
Obizhaeva, A. A. and Wang, J., 2013. Optimal trading strategy and supply/demand dynamics.
Journal of Financial Markets. 16(1). pp.1-32.
Online:
Technical Analysis USD/JPY. 2019. [Online]. Available Through:
<https://www.fxstreet.com/news/usd-jpy-technical-analysis-tumbles-to-3-month-lows-
oversold-conditions-warrant-some-consolidation-201905090826?
utm_source=tradingview&utm_medium=rss&utm_campaign=62d504f0-ae31-4d3d-
bba5-11fb479d51ae>
Components of Fundamental Analysis. 2019. [Online]. Available Through:
<https://www.indiainfoline.com/article/general-others-factiva/why-is-research-
important-in-share-trading-118052500066_1.html
News on easyTrade. 2019. [Online]. Available Through:
<https://www.easymarkets.com/int/trade/market-news/>
7
⊘ This is a preview!⊘
Do you want full access?
Subscribe today to unlock all pages.
Trusted by 1+ million students worldwide
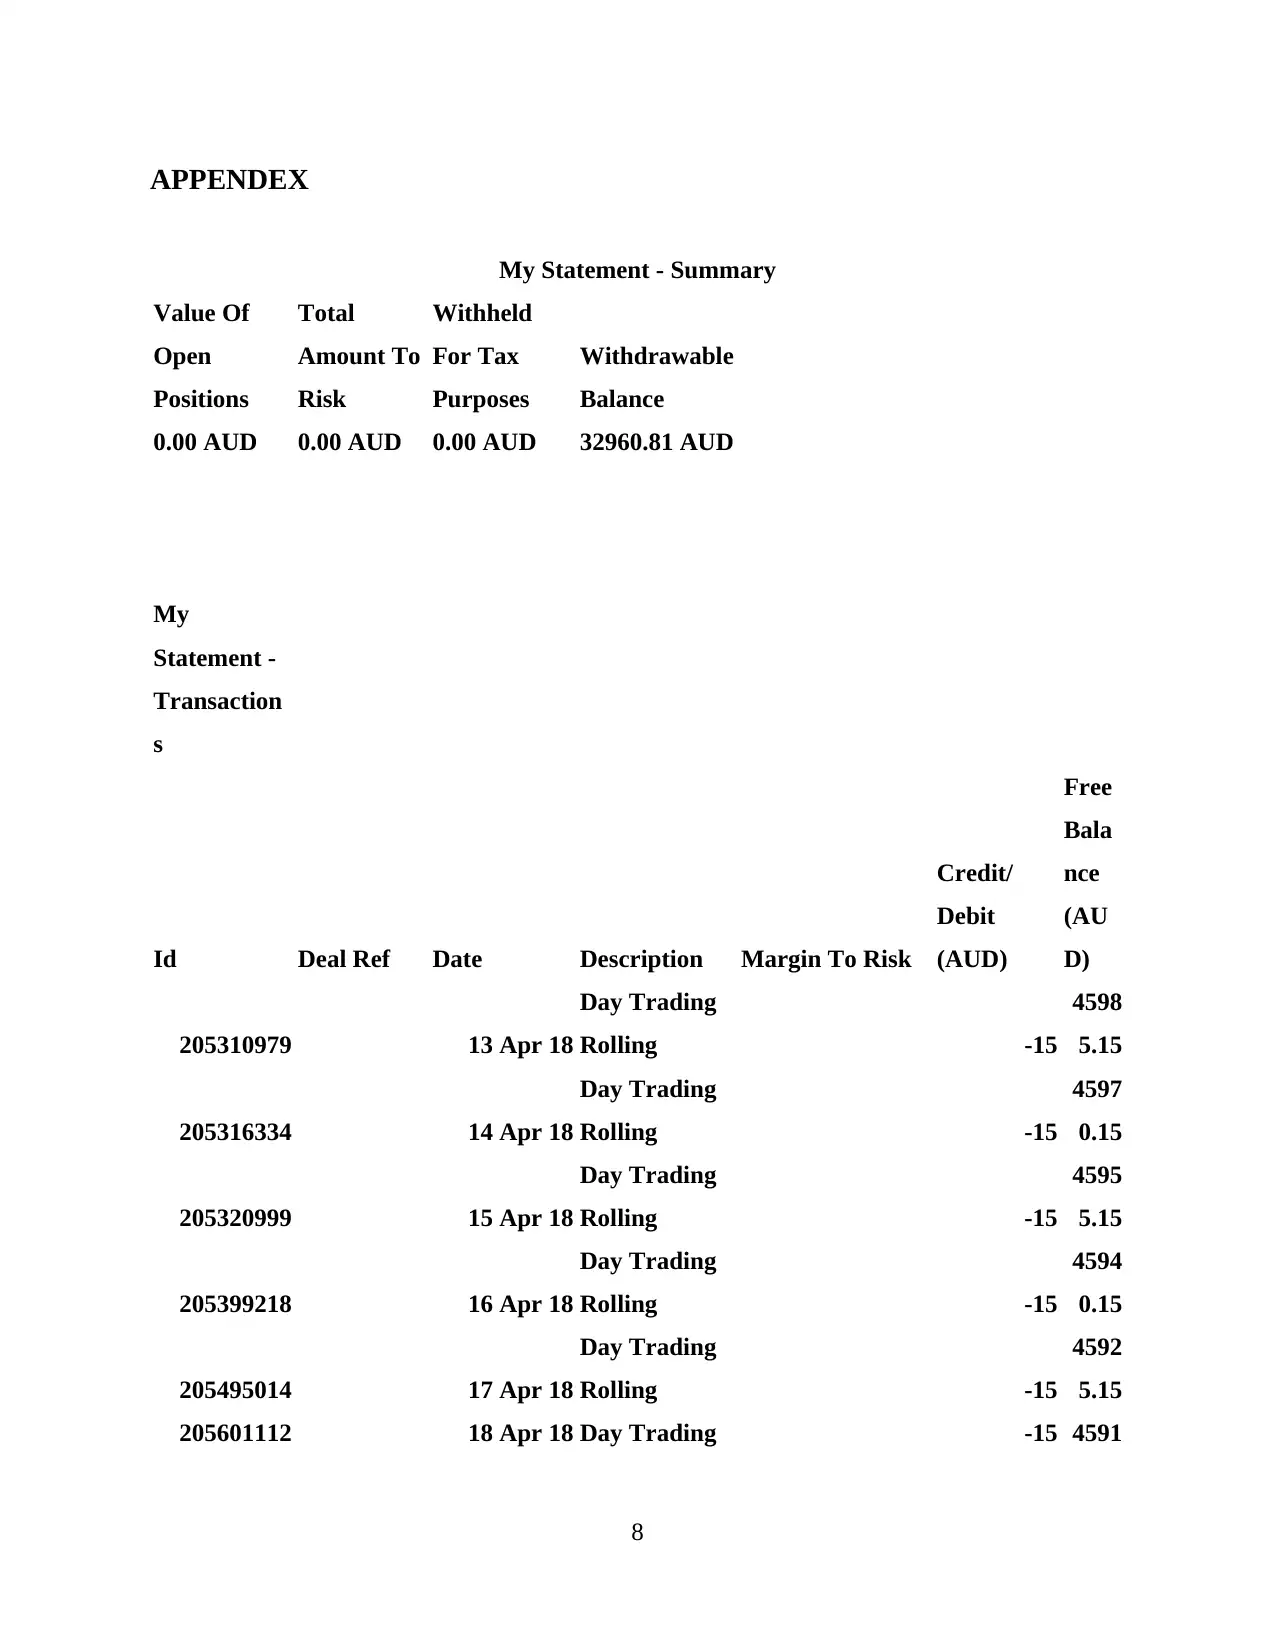
APPENDEX
My Statement - Summary
Value Of
Open
Positions
Total
Amount To
Risk
Withheld
For Tax
Purposes
Withdrawable
Balance
0.00 AUD 0.00 AUD 0.00 AUD 32960.81 AUD
My
Statement -
Transaction
s
Id Deal Ref Date Description Margin To Risk
Credit/
Debit
(AUD)
Free
Bala
nce
(AU
D)
205310979 13 Apr 18
Day Trading
Rolling -15
4598
5.15
205316334 14 Apr 18
Day Trading
Rolling -15
4597
0.15
205320999 15 Apr 18
Day Trading
Rolling -15
4595
5.15
205399218 16 Apr 18
Day Trading
Rolling -15
4594
0.15
205495014 17 Apr 18
Day Trading
Rolling -15
4592
5.15
205601112 18 Apr 18 Day Trading -15 4591
8
Paraphrase This Document
Need a fresh take? Get an instant paraphrase of this document with our AI Paraphraser
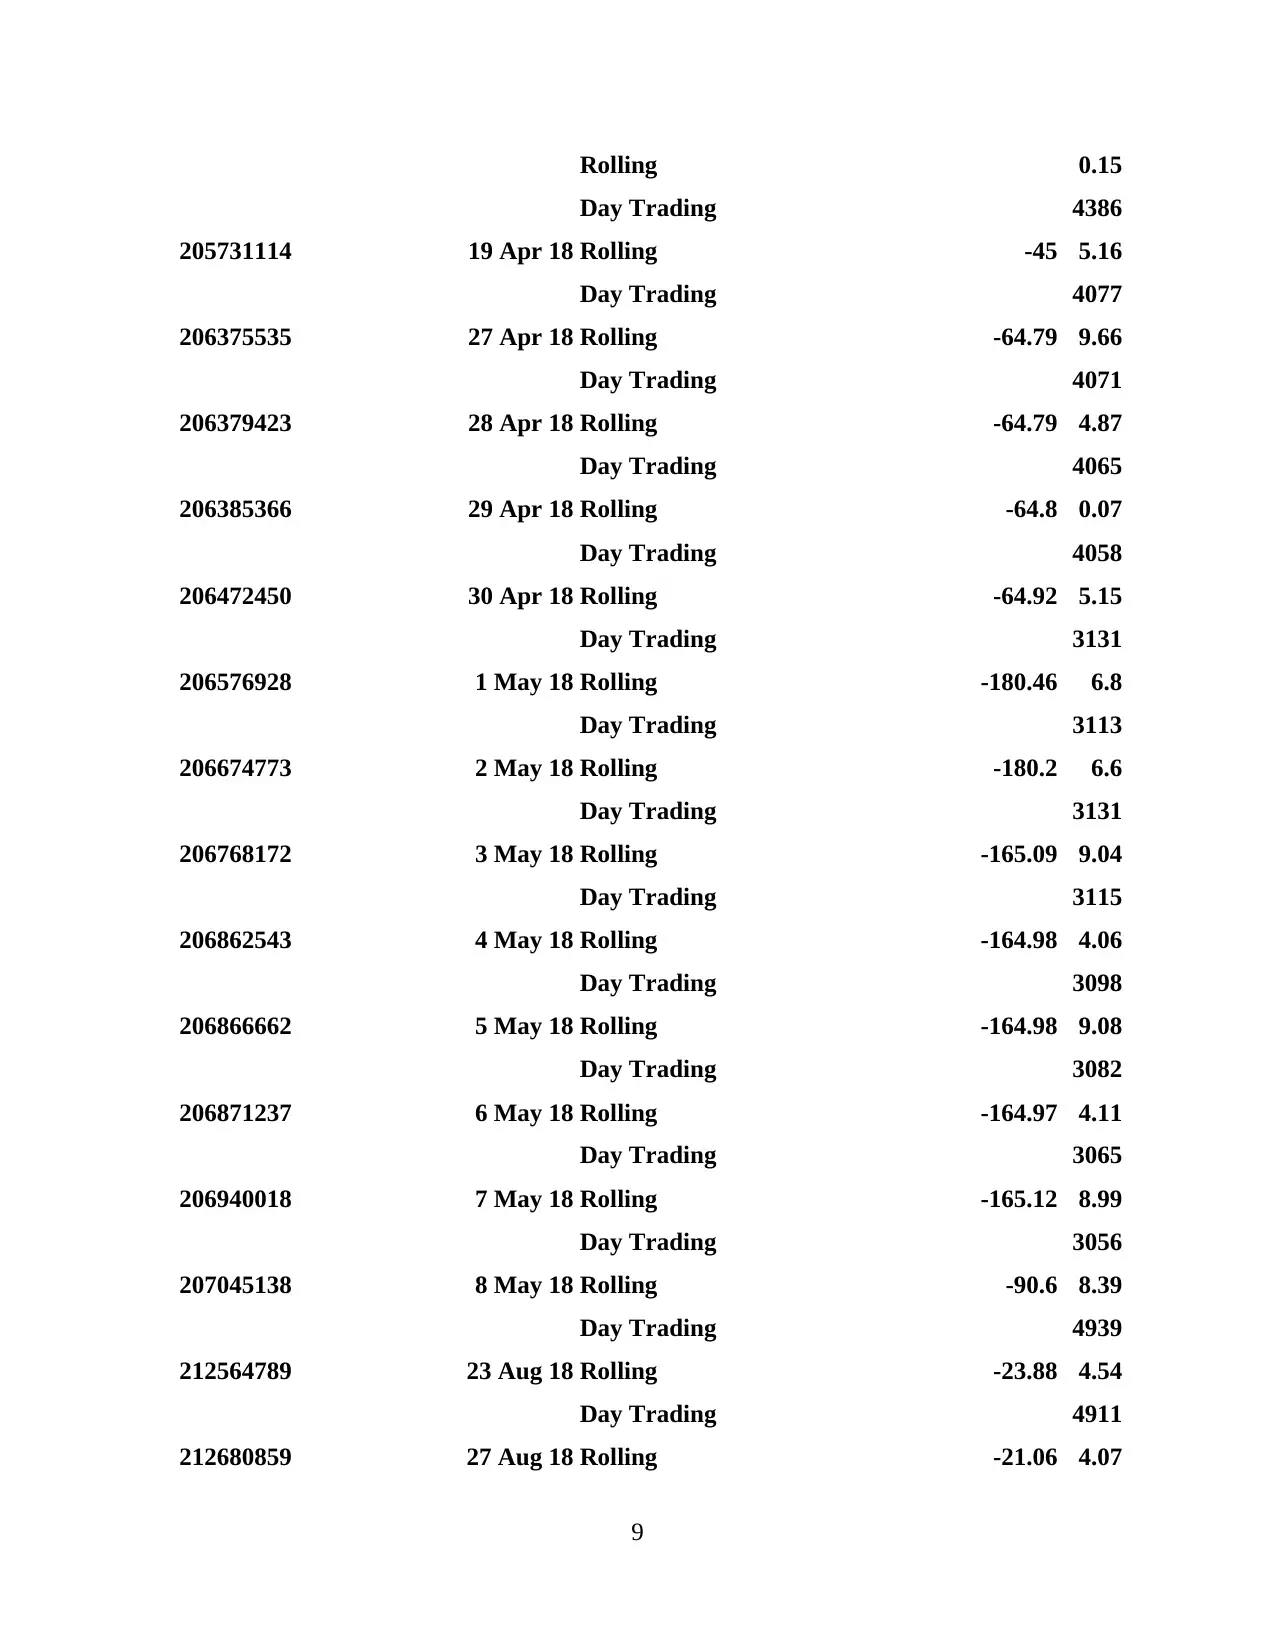
Rolling 0.15
205731114 19 Apr 18
Day Trading
Rolling -45
4386
5.16
206375535 27 Apr 18
Day Trading
Rolling -64.79
4077
9.66
206379423 28 Apr 18
Day Trading
Rolling -64.79
4071
4.87
206385366 29 Apr 18
Day Trading
Rolling -64.8
4065
0.07
206472450 30 Apr 18
Day Trading
Rolling -64.92
4058
5.15
206576928 1 May 18
Day Trading
Rolling -180.46
3131
6.8
206674773 2 May 18
Day Trading
Rolling -180.2
3113
6.6
206768172 3 May 18
Day Trading
Rolling -165.09
3131
9.04
206862543 4 May 18
Day Trading
Rolling -164.98
3115
4.06
206866662 5 May 18
Day Trading
Rolling -164.98
3098
9.08
206871237 6 May 18
Day Trading
Rolling -164.97
3082
4.11
206940018 7 May 18
Day Trading
Rolling -165.12
3065
8.99
207045138 8 May 18
Day Trading
Rolling -90.6
3056
8.39
212564789 23 Aug 18
Day Trading
Rolling -23.88
4939
4.54
212680859 27 Aug 18
Day Trading
Rolling -21.06
4911
4.07
9
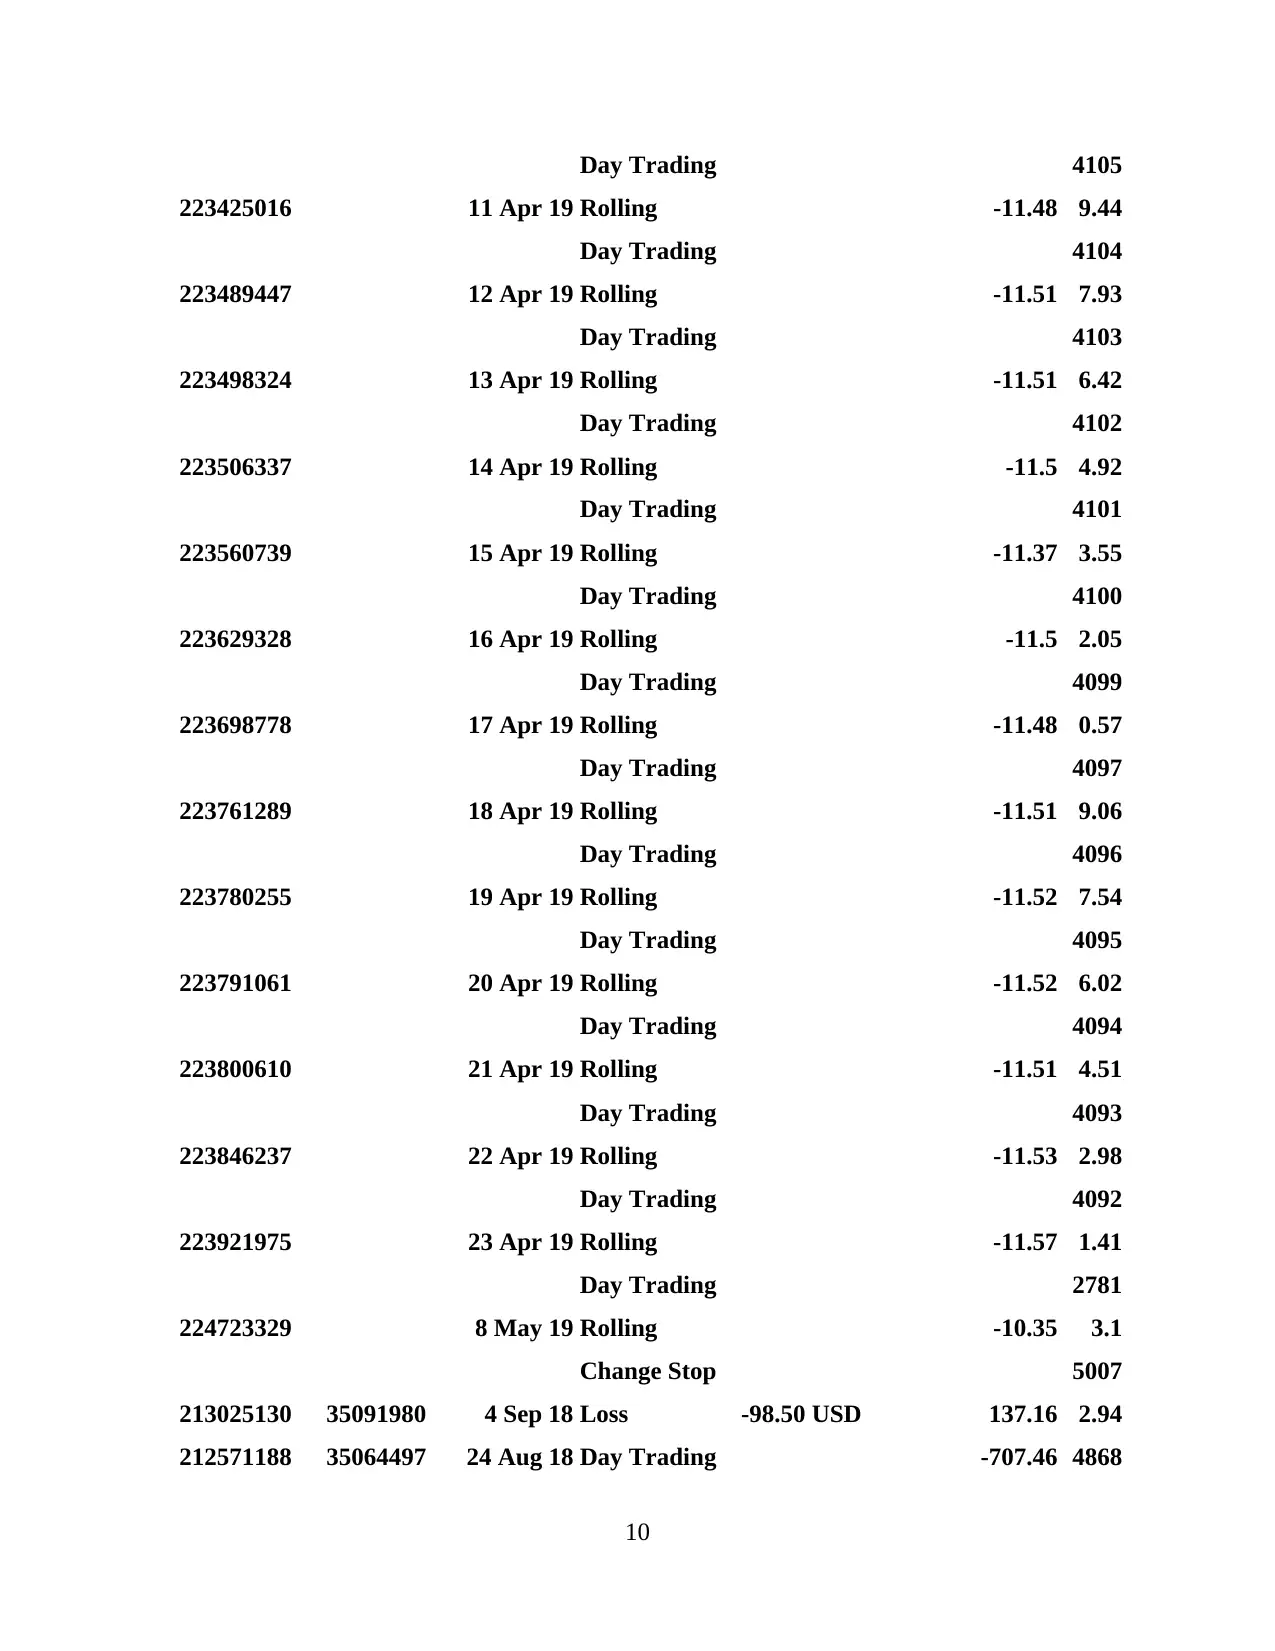
223425016 11 Apr 19
Day Trading
Rolling -11.48
4105
9.44
223489447 12 Apr 19
Day Trading
Rolling -11.51
4104
7.93
223498324 13 Apr 19
Day Trading
Rolling -11.51
4103
6.42
223506337 14 Apr 19
Day Trading
Rolling -11.5
4102
4.92
223560739 15 Apr 19
Day Trading
Rolling -11.37
4101
3.55
223629328 16 Apr 19
Day Trading
Rolling -11.5
4100
2.05
223698778 17 Apr 19
Day Trading
Rolling -11.48
4099
0.57
223761289 18 Apr 19
Day Trading
Rolling -11.51
4097
9.06
223780255 19 Apr 19
Day Trading
Rolling -11.52
4096
7.54
223791061 20 Apr 19
Day Trading
Rolling -11.52
4095
6.02
223800610 21 Apr 19
Day Trading
Rolling -11.51
4094
4.51
223846237 22 Apr 19
Day Trading
Rolling -11.53
4093
2.98
223921975 23 Apr 19
Day Trading
Rolling -11.57
4092
1.41
224723329 8 May 19
Day Trading
Rolling -10.35
2781
3.1
213025130 35091980 4 Sep 18
Change Stop
Loss -98.50 USD 137.16
5007
2.94
212571188 35064497 24 Aug 18 Day Trading -707.46 4868
10
Day Trading
Rolling -11.48
4105
9.44
223489447 12 Apr 19
Day Trading
Rolling -11.51
4104
7.93
223498324 13 Apr 19
Day Trading
Rolling -11.51
4103
6.42
223506337 14 Apr 19
Day Trading
Rolling -11.5
4102
4.92
223560739 15 Apr 19
Day Trading
Rolling -11.37
4101
3.55
223629328 16 Apr 19
Day Trading
Rolling -11.5
4100
2.05
223698778 17 Apr 19
Day Trading
Rolling -11.48
4099
0.57
223761289 18 Apr 19
Day Trading
Rolling -11.51
4097
9.06
223780255 19 Apr 19
Day Trading
Rolling -11.52
4096
7.54
223791061 20 Apr 19
Day Trading
Rolling -11.52
4095
6.02
223800610 21 Apr 19
Day Trading
Rolling -11.51
4094
4.51
223846237 22 Apr 19
Day Trading
Rolling -11.53
4093
2.98
223921975 23 Apr 19
Day Trading
Rolling -11.57
4092
1.41
224723329 8 May 19
Day Trading
Rolling -10.35
2781
3.1
213025130 35091980 4 Sep 18
Change Stop
Loss -98.50 USD 137.16
5007
2.94
212571188 35064497 24 Aug 18 Day Trading -707.46 4868
10
⊘ This is a preview!⊘
Do you want full access?
Subscribe today to unlock all pages.
Trusted by 1+ million students worldwide
1 out of 20
Related Documents


Your All-in-One AI-Powered Toolkit for Academic Success.
+13062052269
info@desklib.com
Available 24*7 on WhatsApp / Email
![[object Object]](/_next/static/media/star-bottom.7253800d.svg)
Unlock your academic potential
Copyright © 2020–2026 A2Z Services. All Rights Reserved. Developed and managed by ZUCOL.