International Finance Report: Ulster University, International Finance
VerifiedAdded on 2023/01/12
|10
|2879
|29
Report
AI Summary
This report provides an in-depth analysis of TESCO's international finance operations. It begins with an introduction to international finance and its relevance to multinational corporations like TESCO, which operates in various countries and is part of the retail industry. The report then explores the impact of international finance policies on TESCO's market development, emphasizing foreign exchange policies, access to international financial institutions, and strategies for maximizing profit and minimizing risk. A section is dedicated to TESCO's risk management policies, including capital structure, sources of funding, and dividend policies. The report also includes a financial performance analysis of TESCO for two consecutive years (2018 and 2019), using profitability, liquidity, and efficiency ratios to assess the company's financial health. The analysis covers gross profit ratio, net profit ratio, quick ratio, current ratio, inventory turnover ratio, and fixed assets turnover ratio, offering insights into TESCO's financial strategies and performance amid global economic challenges.
International Finance
Paraphrase This Document
Need a fresh take? Get an instant paraphrase of this document with our AI Paraphraser
Contents
Contents...........................................................................................................................................2
INTRODUCTION...........................................................................................................................1
TASK 1............................................................................................................................................1
1) Impact of international fiancé development policies on TESCO...........................................1
2) Risk management policy of TESCO......................................................................................1
3) Financial performance analysis of 2 consecutive years of TESCO........................................1
CONCLUSION................................................................................................................................1
REFRENCE.....................................................................................................................................1
INTRODUCTION
International finance is a special branch of economic which is included in study of macro
economics. This branch of economics covers the area of sources of collection finance from
international level. This covers balance of payment are, foreign policies, tax calculation,
exchange rate mechanism, direct investment policies, etc. In order to understand the concept on
international finance in a wider way TESCO has been taken. This is multinational organization
which is established in 1919 at London. The company deal with groceries product it is included
retail industry. It provides super market chain in London and other countries. In this report
impact of international fiancé polices on organization has been define briefly. It also included
risk management polices of company and an analysis of financial performance through using
various ratios calculation has been described clearly.
TASK 1
1) Impact of international fiancé development policies on TESCO
Tesco run their business activites in India, Japan, Malaises, Thailand Poland, Hungry etc. It
provide diversify products and supermarket services at global level. Thus international finance
policies play essential role in developing the market area of this company. By using foreign
exchange policies the company can easily covert their currency into foreign currencies and with
the uses of various schemes they can easily get loan and help with international financial
institution. International financial policies use to determine them the way they trade their
business and enhance it within the global market area. (Frisari and Stadelmann, 2015). They use
it for their promotional and marketing strategies, These policies also provided them productions
factors at low area which will help in increasing their profitability rate due to BREXIT
agreement their trade rate in European countries decline but they still earn profit as they focus on
other countries and with the uses of these polices they can determine their rate and invest in
foreign organizations. International financial policies help in maximizing profit and minimizing
risk for investors and they also improving goodwill of the company it will positively impact on
TESCO on upcoming year to enhance their value.
⊘ This is a preview!⊘
Do you want full access?
Subscribe today to unlock all pages.
Trusted by 1+ million students worldwide
2) Risk management policy of TESCO
Business organization formulate risk management polices to reduce chances of
uncertainties. These policy their implement on the basis of data collected from
environment scanning techniques./It will use to identify problems, threats arise during
international trade process. Business organization also formulate capital structure policy in
which they describe their source of collection of fund.
TESCO use capital budgeting to identifying their source following are the source of their
finance:
Retained earnings: Company invested their amount of profit in their own company and
finds ways of collection of funds.
Fixed assets: Manager of this company use fixed assets as tools of their earning, TESCO is
multinational company and they have many lands, building and equipment they use it to
gain profits
Current assets: Tesco use their inventory for gaining income. They use cash and cash
equivalent tools for their funds
Investment: TESCO invest in various securities they invest their money in large area and
a big portfolio of security which help in earning profits with minimum risk. The company
also generate income in setting in banks and other financial institution (Hieronymi, 2016).
Share: Main source of funds are share, TESCO provides shares to the public it is
international enterprise but due to recession their share price has been decline since 2013
and now due to pandemic of COVID 19 its possibility that their share value not increase.
Corporation: TESCO is established as corporation and with their acquisition, merger,
activites the company earn income. This also engaged in various social activites it will also
help them granting loan easily from government organizations and various financial
institutions.
Paraphrase This Document
Need a fresh take? Get an instant paraphrase of this document with our AI Paraphraser
Hire purchase: Company can also collect funds from their purchase the company
established their super market in many places and they are not purchase sometimes they
hire the land and generate income from business activites.
Business operational activites: Main source of funds for TESCO is income generates from
their super market branches, the company run super market in United kingdom and more
then 11 country included EUROPEAN and mid Asia. and America country. They
generated profits by selling grocery items to their customers.
Dividend policy: Every company build policy of dividend. It is a part of profit use by
business organization to distribute for their shareholders. Tesco currently applying new
dividend policy. In which the management department of TESCO focus on increasing
dividend payout in line with their running growth rate. Tesco provides dividend on
continuously basis they decided their divided amount in annual general meting. At present
they provides 0.07 dividend value per share to their customer and they declare to provide
cash dividend to their shareholders. They us dividend reinvestment plan ad they have 2.19
% dividend yield ratio.
3) Financial performance analysis of 2 consecutive years of TESCO
TESCO is one of the biggest organization of United Kingdom. Due to BREXIT agreement
and now COVID 19 their performance has been effected. Managers uses various technique
of management and financial accounting tools in order to analysis heir organizations s
performance. For this they use financial statement, with various ratios mangers can easily
recognize performance evaluation of their company with compare to other or itself
previous year’s performance (Carroll, 2015).
Ratio analyse: It is formulated for comparison of each item of balance sheet for business
organization. It is used for determining financial health and operational efficiency, of a
company. Various types of ratio are use for financial analyses process which includes
profitability, investment, efficiency, ratio. Each has their own benefits. Following are the
ratio use for comparison of 2018 and 2019 performance of TESCO:
Profitability: This ratio is used to calculate profitability rate of the company. It is financial
metrics which is use for identifying ability of an entity to generate profit from their sales, balance
sheet items, equity of shareholders, and operating cost incurred during operations activities.
1
Theses ratio repre4sent the worth of an entity how they are able to utilize their assets for gearing
profits and value for their relevant shareholders. It is dived into 2 parts, marginal and return
ratios. Margin ratio use for analysing business organization capability for generate income from
sales and on the other side return ratio are use for identifying capacity to geanrate profits to its
reliable shareholders. Following are example of profitability ratio
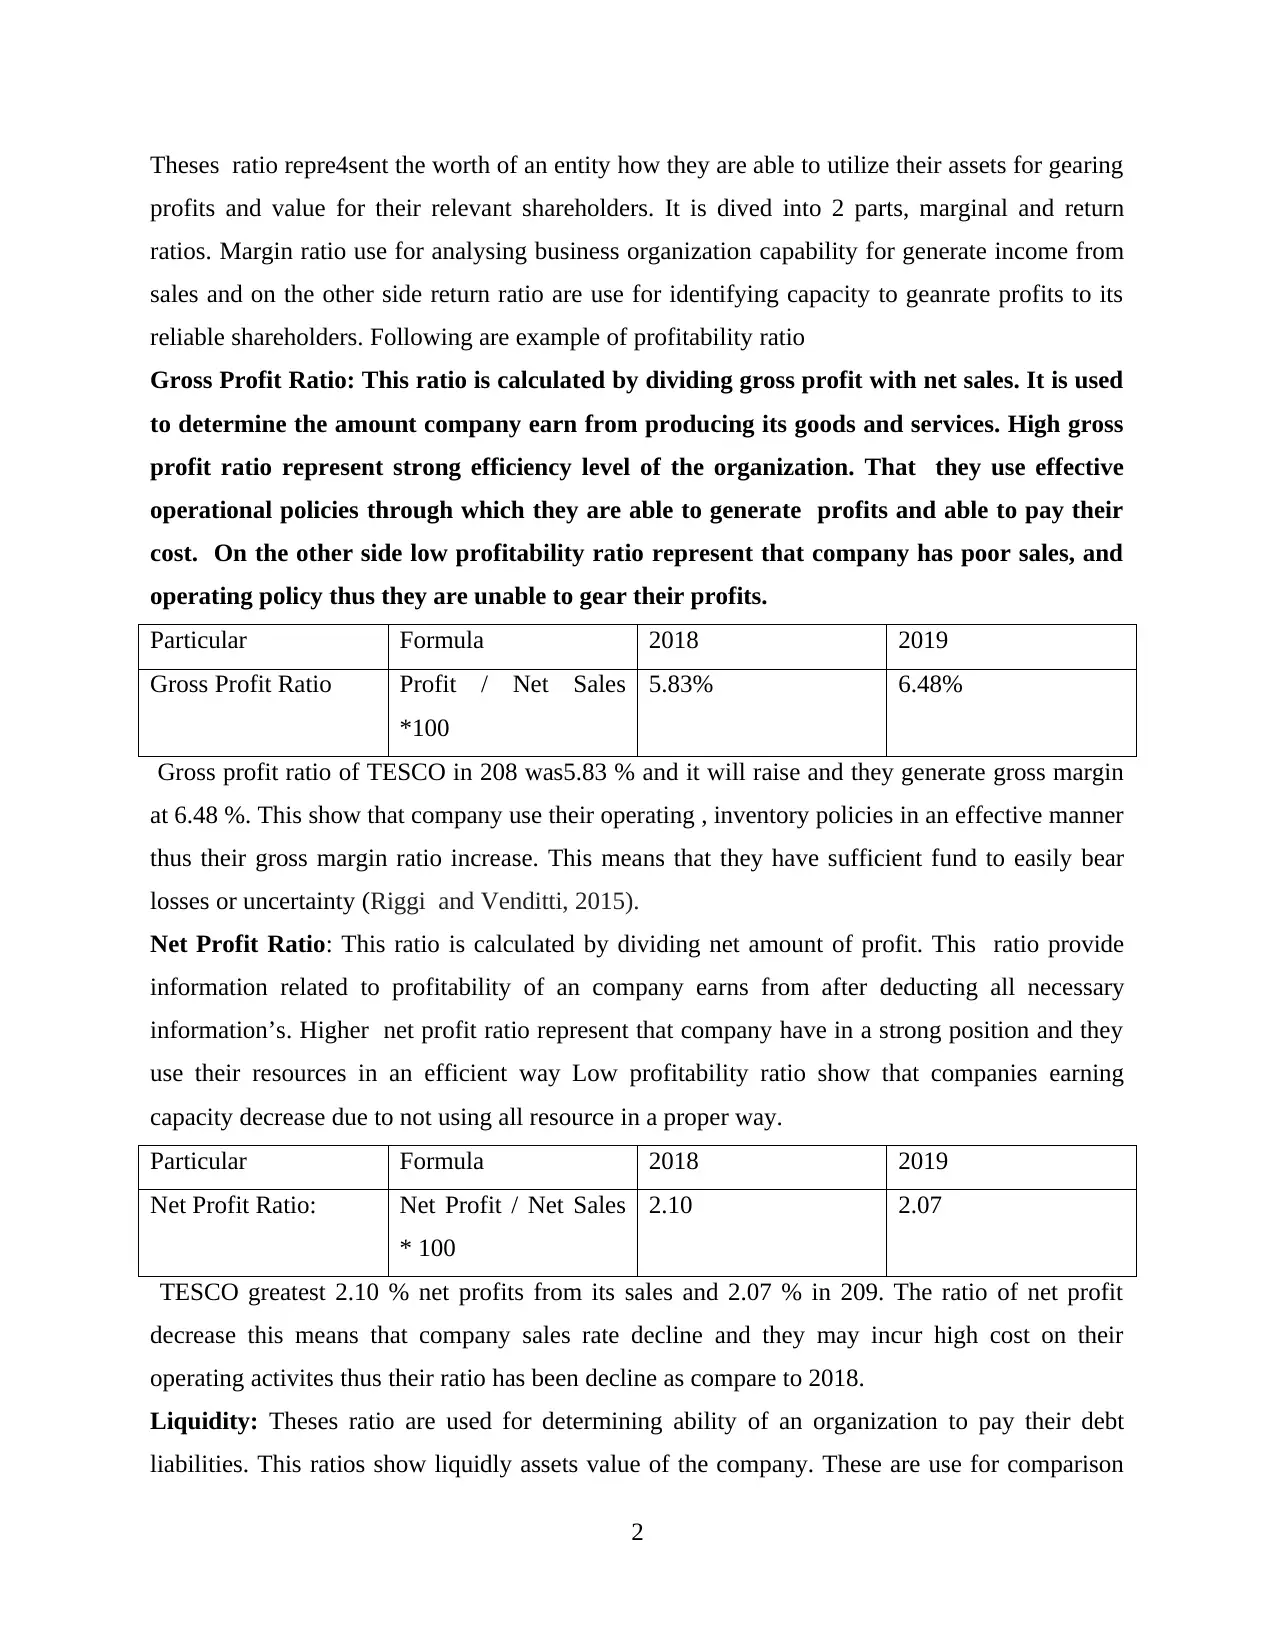
Gross Profit Ratio: This ratio is calculated by dividing gross profit with net sales. It is used
to determine the amount company earn from producing its goods and services. High gross
profit ratio represent strong efficiency level of the organization. That they use effective
operational policies through which they are able to generate profits and able to pay their
cost. On the other side low profitability ratio represent that company has poor sales, and
operating policy thus they are unable to gear their profits.
Particular Formula 2018 2019
Gross Profit Ratio Profit / Net Sales
*100
5.83% 6.48%
Gross profit ratio of TESCO in 208 was5.83 % and it will raise and they generate gross margin
at 6.48 %. This show that company use their operating , inventory policies in an effective manner
thus their gross margin ratio increase. This means that they have sufficient fund to easily bear
losses or uncertainty (Riggi and Venditti, 2015).
Net Profit Ratio: This ratio is calculated by dividing net amount of profit. This ratio provide
information related to profitability of an company earns from after deducting all necessary
information’s. Higher net profit ratio represent that company have in a strong position and they
use their resources in an efficient way Low profitability ratio show that companies earning
capacity decrease due to not using all resource in a proper way.
Particular Formula 2018 2019
Net Profit Ratio: Net Profit / Net Sales
* 100
2.10 2.07
TESCO greatest 2.10 % net profits from its sales and 2.07 % in 209. The ratio of net profit
decrease this means that company sales rate decline and they may incur high cost on their
operating activites thus their ratio has been decline as compare to 2018.
Liquidity: Theses ratio are used for determining ability of an organization to pay their debt
liabilities. This ratios show liquidly assets value of the company. These are use for comparison
2
profits and value for their relevant shareholders. It is dived into 2 parts, marginal and return
ratios. Margin ratio use for analysing business organization capability for generate income from
sales and on the other side return ratio are use for identifying capacity to geanrate profits to its
reliable shareholders. Following are example of profitability ratio
Gross Profit Ratio: This ratio is calculated by dividing gross profit with net sales. It is used
to determine the amount company earn from producing its goods and services. High gross
profit ratio represent strong efficiency level of the organization. That they use effective
operational policies through which they are able to generate profits and able to pay their
cost. On the other side low profitability ratio represent that company has poor sales, and
operating policy thus they are unable to gear their profits.
Particular Formula 2018 2019
Gross Profit Ratio Profit / Net Sales
*100
5.83% 6.48%
Gross profit ratio of TESCO in 208 was5.83 % and it will raise and they generate gross margin
at 6.48 %. This show that company use their operating , inventory policies in an effective manner
thus their gross margin ratio increase. This means that they have sufficient fund to easily bear
losses or uncertainty (Riggi and Venditti, 2015).
Net Profit Ratio: This ratio is calculated by dividing net amount of profit. This ratio provide
information related to profitability of an company earns from after deducting all necessary
information’s. Higher net profit ratio represent that company have in a strong position and they
use their resources in an efficient way Low profitability ratio show that companies earning
capacity decrease due to not using all resource in a proper way.
Particular Formula 2018 2019
Net Profit Ratio: Net Profit / Net Sales
* 100
2.10 2.07
TESCO greatest 2.10 % net profits from its sales and 2.07 % in 209. The ratio of net profit
decrease this means that company sales rate decline and they may incur high cost on their
operating activites thus their ratio has been decline as compare to 2018.
Liquidity: Theses ratio are used for determining ability of an organization to pay their debt
liabilities. This ratios show liquidly assets value of the company. These are use for comparison
2
⊘ This is a preview!⊘
Do you want full access?
Subscribe today to unlock all pages.
Trusted by 1+ million students worldwide
of strategic position of the business organization. Liquidity ratio also help in calculating assets
available in cash form so that they can easily use for to meet obligations of short term liabilities.
It included current ratio, quick ratio, quick acid ratio, etc. Following are the measurement of
TESCO liquidity performance:
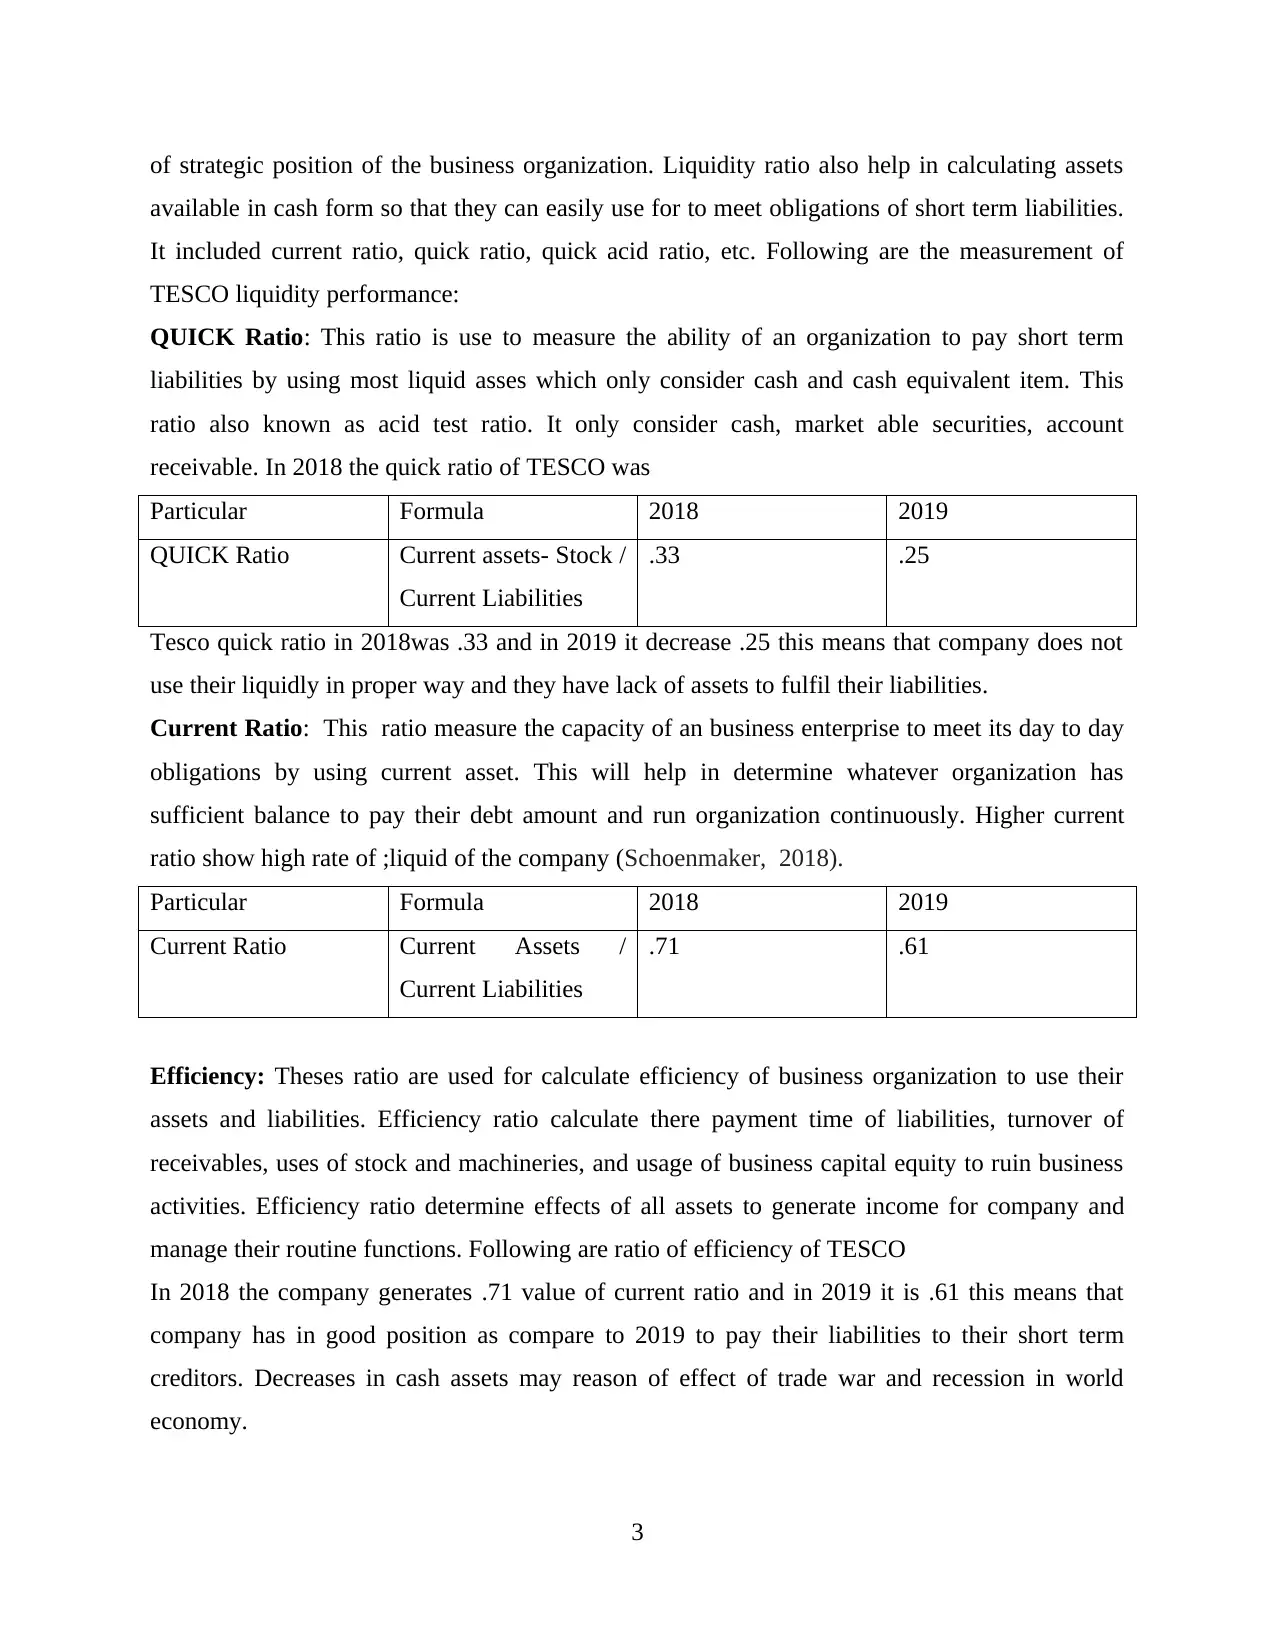
QUICK Ratio: This ratio is use to measure the ability of an organization to pay short term
liabilities by using most liquid asses which only consider cash and cash equivalent item. This
ratio also known as acid test ratio. It only consider cash, market able securities, account
receivable. In 2018 the quick ratio of TESCO was
Particular Formula 2018 2019
QUICK Ratio Current assets- Stock /
Current Liabilities
.33 .25
Tesco quick ratio in 2018was .33 and in 2019 it decrease .25 this means that company does not
use their liquidly in proper way and they have lack of assets to fulfil their liabilities.
Current Ratio: This ratio measure the capacity of an business enterprise to meet its day to day
obligations by using current asset. This will help in determine whatever organization has
sufficient balance to pay their debt amount and run organization continuously. Higher current
ratio show high rate of ;liquid of the company (Schoenmaker, 2018).
Particular Formula 2018 2019
Current Ratio Current Assets /
Current Liabilities
.71 .61
Efficiency: Theses ratio are used for calculate efficiency of business organization to use their
assets and liabilities. Efficiency ratio calculate there payment time of liabilities, turnover of
receivables, uses of stock and machineries, and usage of business capital equity to ruin business
activities. Efficiency ratio determine effects of all assets to generate income for company and
manage their routine functions. Following are ratio of efficiency of TESCO
In 2018 the company generates .71 value of current ratio and in 2019 it is .61 this means that
company has in good position as compare to 2019 to pay their liabilities to their short term
creditors. Decreases in cash assets may reason of effect of trade war and recession in world
economy.
3
available in cash form so that they can easily use for to meet obligations of short term liabilities.
It included current ratio, quick ratio, quick acid ratio, etc. Following are the measurement of
TESCO liquidity performance:
QUICK Ratio: This ratio is use to measure the ability of an organization to pay short term
liabilities by using most liquid asses which only consider cash and cash equivalent item. This
ratio also known as acid test ratio. It only consider cash, market able securities, account
receivable. In 2018 the quick ratio of TESCO was
Particular Formula 2018 2019
QUICK Ratio Current assets- Stock /
Current Liabilities
.33 .25
Tesco quick ratio in 2018was .33 and in 2019 it decrease .25 this means that company does not
use their liquidly in proper way and they have lack of assets to fulfil their liabilities.
Current Ratio: This ratio measure the capacity of an business enterprise to meet its day to day
obligations by using current asset. This will help in determine whatever organization has
sufficient balance to pay their debt amount and run organization continuously. Higher current
ratio show high rate of ;liquid of the company (Schoenmaker, 2018).
Particular Formula 2018 2019
Current Ratio Current Assets /
Current Liabilities
.71 .61
Efficiency: Theses ratio are used for calculate efficiency of business organization to use their
assets and liabilities. Efficiency ratio calculate there payment time of liabilities, turnover of
receivables, uses of stock and machineries, and usage of business capital equity to ruin business
activities. Efficiency ratio determine effects of all assets to generate income for company and
manage their routine functions. Following are ratio of efficiency of TESCO
In 2018 the company generates .71 value of current ratio and in 2019 it is .61 this means that
company has in good position as compare to 2019 to pay their liabilities to their short term
creditors. Decreases in cash assets may reason of effect of trade war and recession in world
economy.
3
Paraphrase This Document
Need a fresh take? Get an instant paraphrase of this document with our AI Paraphraser
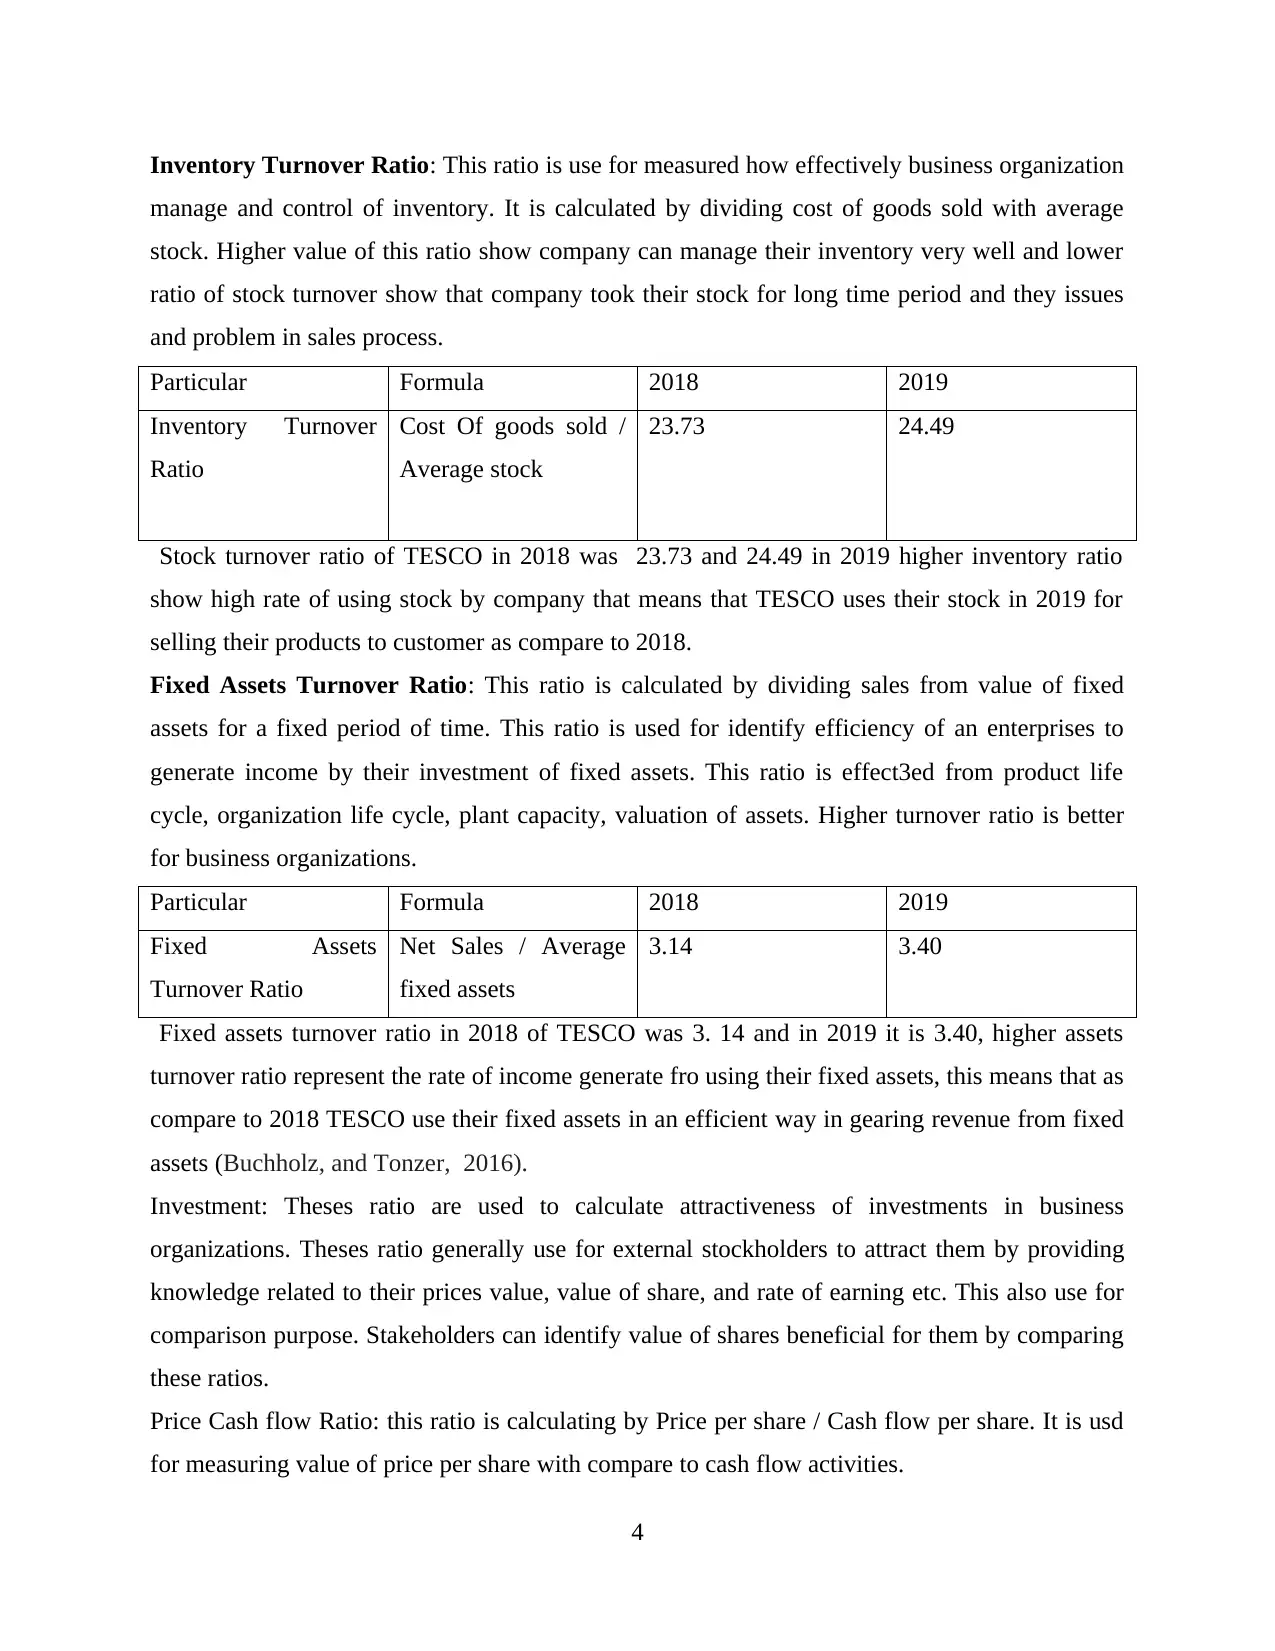
Inventory Turnover Ratio: This ratio is use for measured how effectively business organization
manage and control of inventory. It is calculated by dividing cost of goods sold with average
stock. Higher value of this ratio show company can manage their inventory very well and lower
ratio of stock turnover show that company took their stock for long time period and they issues
and problem in sales process.
Particular Formula 2018 2019
Inventory Turnover
Ratio
Cost Of goods sold /
Average stock
23.73 24.49
Stock turnover ratio of TESCO in 2018 was 23.73 and 24.49 in 2019 higher inventory ratio
show high rate of using stock by company that means that TESCO uses their stock in 2019 for
selling their products to customer as compare to 2018.
Fixed Assets Turnover Ratio: This ratio is calculated by dividing sales from value of fixed
assets for a fixed period of time. This ratio is used for identify efficiency of an enterprises to
generate income by their investment of fixed assets. This ratio is effect3ed from product life
cycle, organization life cycle, plant capacity, valuation of assets. Higher turnover ratio is better
for business organizations.
Particular Formula 2018 2019
Fixed Assets
Turnover Ratio
Net Sales / Average
fixed assets
3.14 3.40
Fixed assets turnover ratio in 2018 of TESCO was 3. 14 and in 2019 it is 3.40, higher assets
turnover ratio represent the rate of income generate fro using their fixed assets, this means that as
compare to 2018 TESCO use their fixed assets in an efficient way in gearing revenue from fixed
assets (Buchholz, and Tonzer, 2016).
Investment: Theses ratio are used to calculate attractiveness of investments in business
organizations. Theses ratio generally use for external stockholders to attract them by providing
knowledge related to their prices value, value of share, and rate of earning etc. This also use for
comparison purpose. Stakeholders can identify value of shares beneficial for them by comparing
these ratios.
Price Cash flow Ratio: this ratio is calculating by Price per share / Cash flow per share. It is usd
for measuring value of price per share with compare to cash flow activities.
4
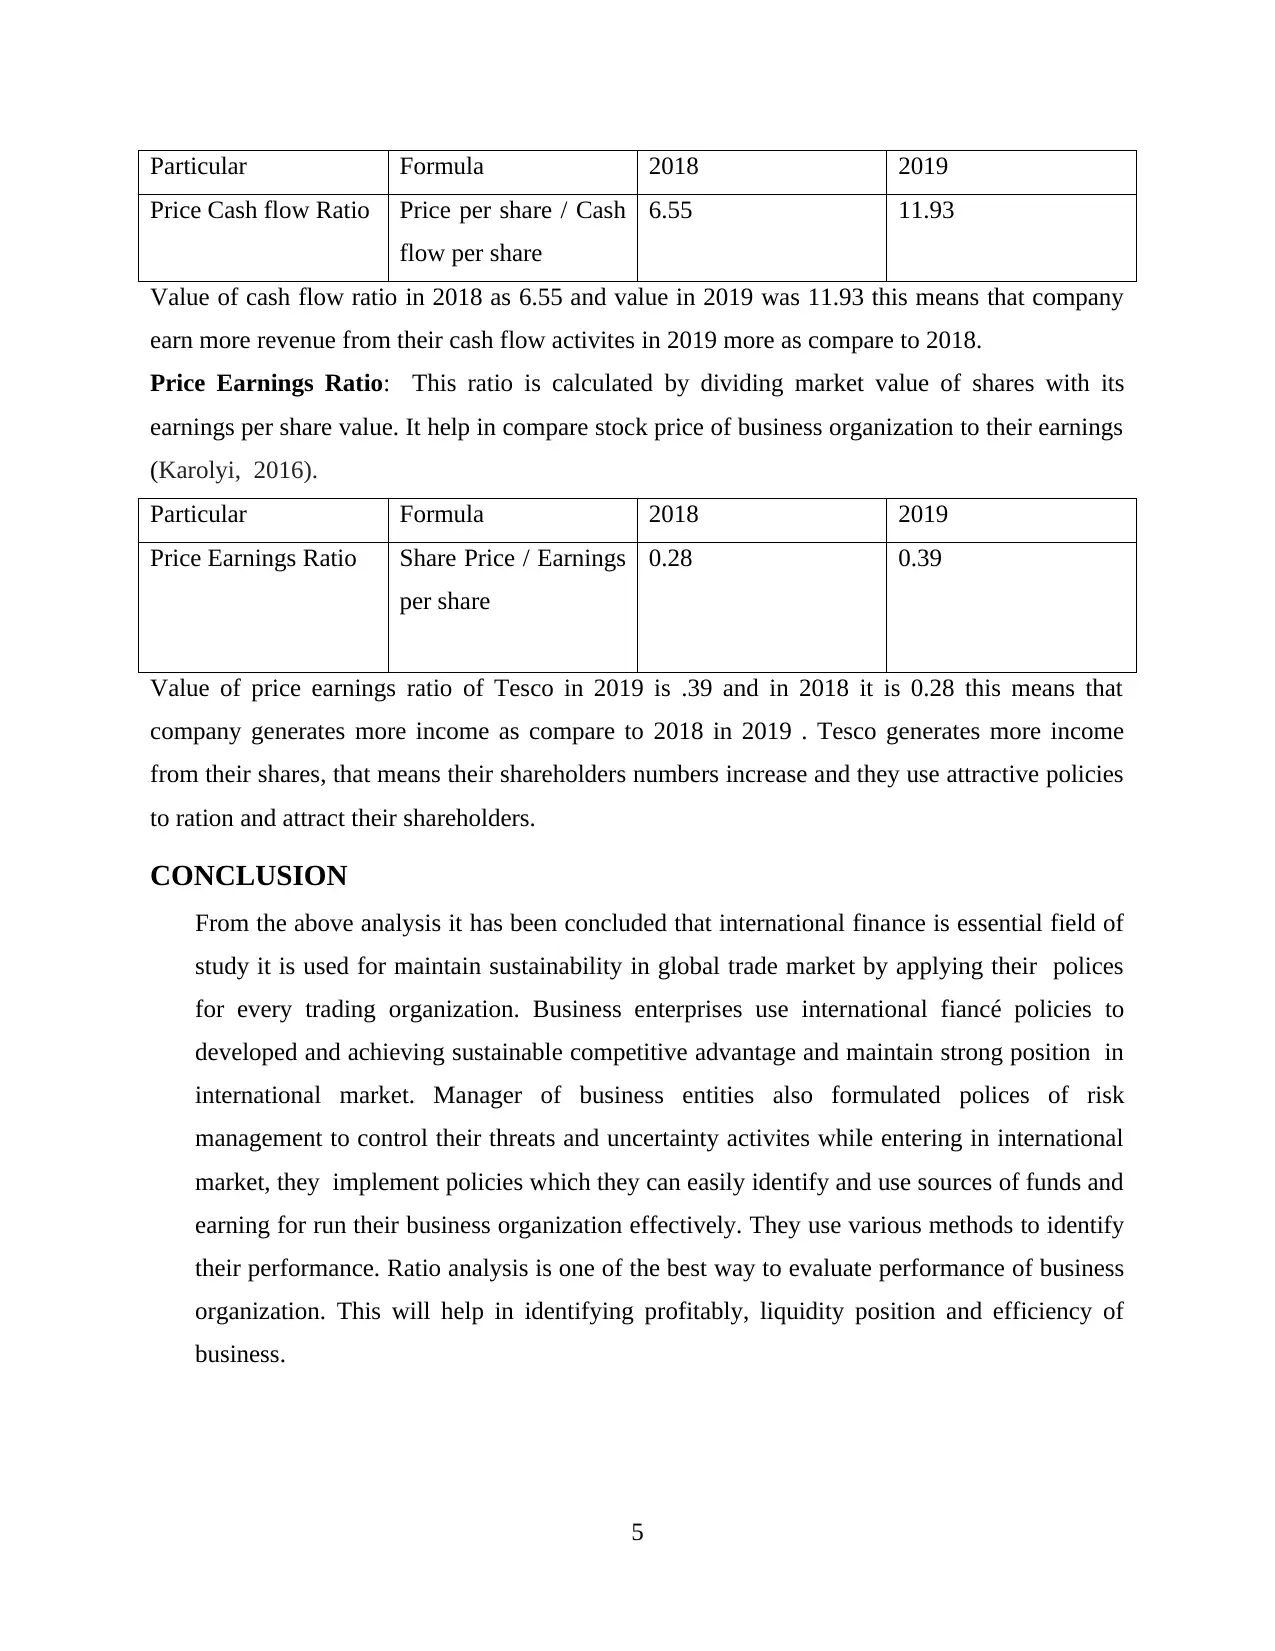
Particular Formula 2018 2019
Price Cash flow Ratio Price per share / Cash
flow per share
6.55 11.93
Value of cash flow ratio in 2018 as 6.55 and value in 2019 was 11.93 this means that company
earn more revenue from their cash flow activites in 2019 more as compare to 2018.
Price Earnings Ratio: This ratio is calculated by dividing market value of shares with its
earnings per share value. It help in compare stock price of business organization to their earnings
(Karolyi, 2016).
Particular Formula 2018 2019
Price Earnings Ratio Share Price / Earnings
per share
0.28 0.39
Value of price earnings ratio of Tesco in 2019 is .39 and in 2018 it is 0.28 this means that
company generates more income as compare to 2018 in 2019 . Tesco generates more income
from their shares, that means their shareholders numbers increase and they use attractive policies
to ration and attract their shareholders.
CONCLUSION
From the above analysis it has been concluded that international finance is essential field of
study it is used for maintain sustainability in global trade market by applying their polices
for every trading organization. Business enterprises use international fiancé policies to
developed and achieving sustainable competitive advantage and maintain strong position in
international market. Manager of business entities also formulated polices of risk
management to control their threats and uncertainty activites while entering in international
market, they implement policies which they can easily identify and use sources of funds and
earning for run their business organization effectively. They use various methods to identify
their performance. Ratio analysis is one of the best way to evaluate performance of business
organization. This will help in identifying profitably, liquidity position and efficiency of
business.
5
⊘ This is a preview!⊘
Do you want full access?
Subscribe today to unlock all pages.
Trusted by 1+ million students worldwide
REFRENCES
From books and journals
Frisari, G. and Stadelmann, M., 2015. De-risking concentrated solar power in emerging markets:
The role of policies and international finance institutions. Energy Policy, 82, pp.12-22.
Hieronymi, O., 2016. The crisis of international finance, the Eurozone and economic growth.
In Financial crisis, bank behaviour and credit crunch (pp. 3-18). Springer, Cham.
Carroll, T., 2015. “Access to Finance” and the Death of Development in the Asia-
Pacific. Journal of Contemporary Asia, 45(1), pp.139-166.
Riggi, M. and Venditti, F., 2015. Failing to Forecast Low Inflation and Phillips Curve Instability:
A Euro‐Area Perspective. International Finance, 18(1), pp.47-68.
Schoenmaker, D., 2018. Resolution of international banks: Can smaller countries
cope?. International Finance, 21(1), pp.39-54.
Buchholz, M. and Tonzer, L., 2016. Sovereign Credit Risk Co‐Movements in the Eurozone:
Simple Interdependence or Contagion?. International finance, 19(3), pp.246-268.
Karolyi, G. A., 2016. The gravity of culture for finance. Journal of Corporate Finance, 41,
pp.610-625.
Navias, M. S., 2017. Finance warfare as a response to international terrorism. In War on
Terrorism (pp. 323-345). Routledge.
6
1 out of 10
Related Documents


Your All-in-One AI-Powered Toolkit for Academic Success.
+13062052269
info@desklib.com
Available 24*7 on WhatsApp / Email
![[object Object]](/_next/static/media/star-bottom.7253800d.svg)
Unlock your academic potential
Copyright © 2020–2026 A2Z Services. All Rights Reserved. Developed and managed by ZUCOL.