International Financial Management Analysis Report
VerifiedAdded on 2022/12/09
|18
|3576
|54
Report
AI Summary
This report delves into the core concepts of international financial management, offering a comprehensive analysis of investment strategies and risk assessment. It begins by calculating the expected net present value (NPV) and standard deviation of a project, evaluating its profitability and associated risks. The report then assesses the feasibility of acquiring English lignite mines, determining the expected NPV, standard deviation, and probabilities of avoiding liquidation and achieving positive returns. Furthermore, it compares the NPV of different projects, explaining the superiority of NPV over the internal rate of return (IRR) for investment appraisal, and calculates the highest achievable NPV under resource constraints. The report concludes by examining the probability of a product generating a negative NPV, providing a thorough examination of financial decision-making under uncertainty.

International Financial
Management
Management
Paraphrase This Document
Need a fresh take? Get an instant paraphrase of this document with our AI Paraphraser
Table of Contents
INTRODUCTION...........................................................................................................................3
MAIN BODY..................................................................................................................................3
QUESTION 1..................................................................................................................................3
(a) Calculation of expected net present value..............................................................................3
(b) Calculation of standard deviation of NPV.............................................................................4
QUESTION 2..................................................................................................................................5
(a) Calculation of expected NPV and standard deviation of the NPV for the project to buy
English lignite mines...................................................................................................................5
(b) Calculation of probability of avoiding liquidation.................................................................8
(c) Calculation of probability of occurring..................................................................................9
QUESTION 3..................................................................................................................................9
(a) Calculation of Net Present Value of each project on the assumption that the cash flows are
not subject to any risk..................................................................................................................9
(b) Reason of why NPV is being superior to internal rate of return for investment appraisal. .11
(c) Calculation of Highest Net Present Value achievable on the assumption that each project is
divisible......................................................................................................................................12
(d) Calculation of probability of the product producing a negative net present value..............13
CONCLUSION..............................................................................................................................16
REFERENCES................................................................................................................................1
INTRODUCTION
Financial management is the part of the business if they want to run their company smoothly
and efficiently. Financial decision is the decision which became impossible to change if the
manages take such decision in a wrong way. The loses the company need to bear may be to that
extent that the company might dissolve their business. So, this report will cover the concept of
expected return the company can expects from their investment plans and the probability of
losing the amount. The report also covers the standard deviation concept which need the
attention of company and their managers which making any finance related decision.
MAIN BODY
QUESTION 1
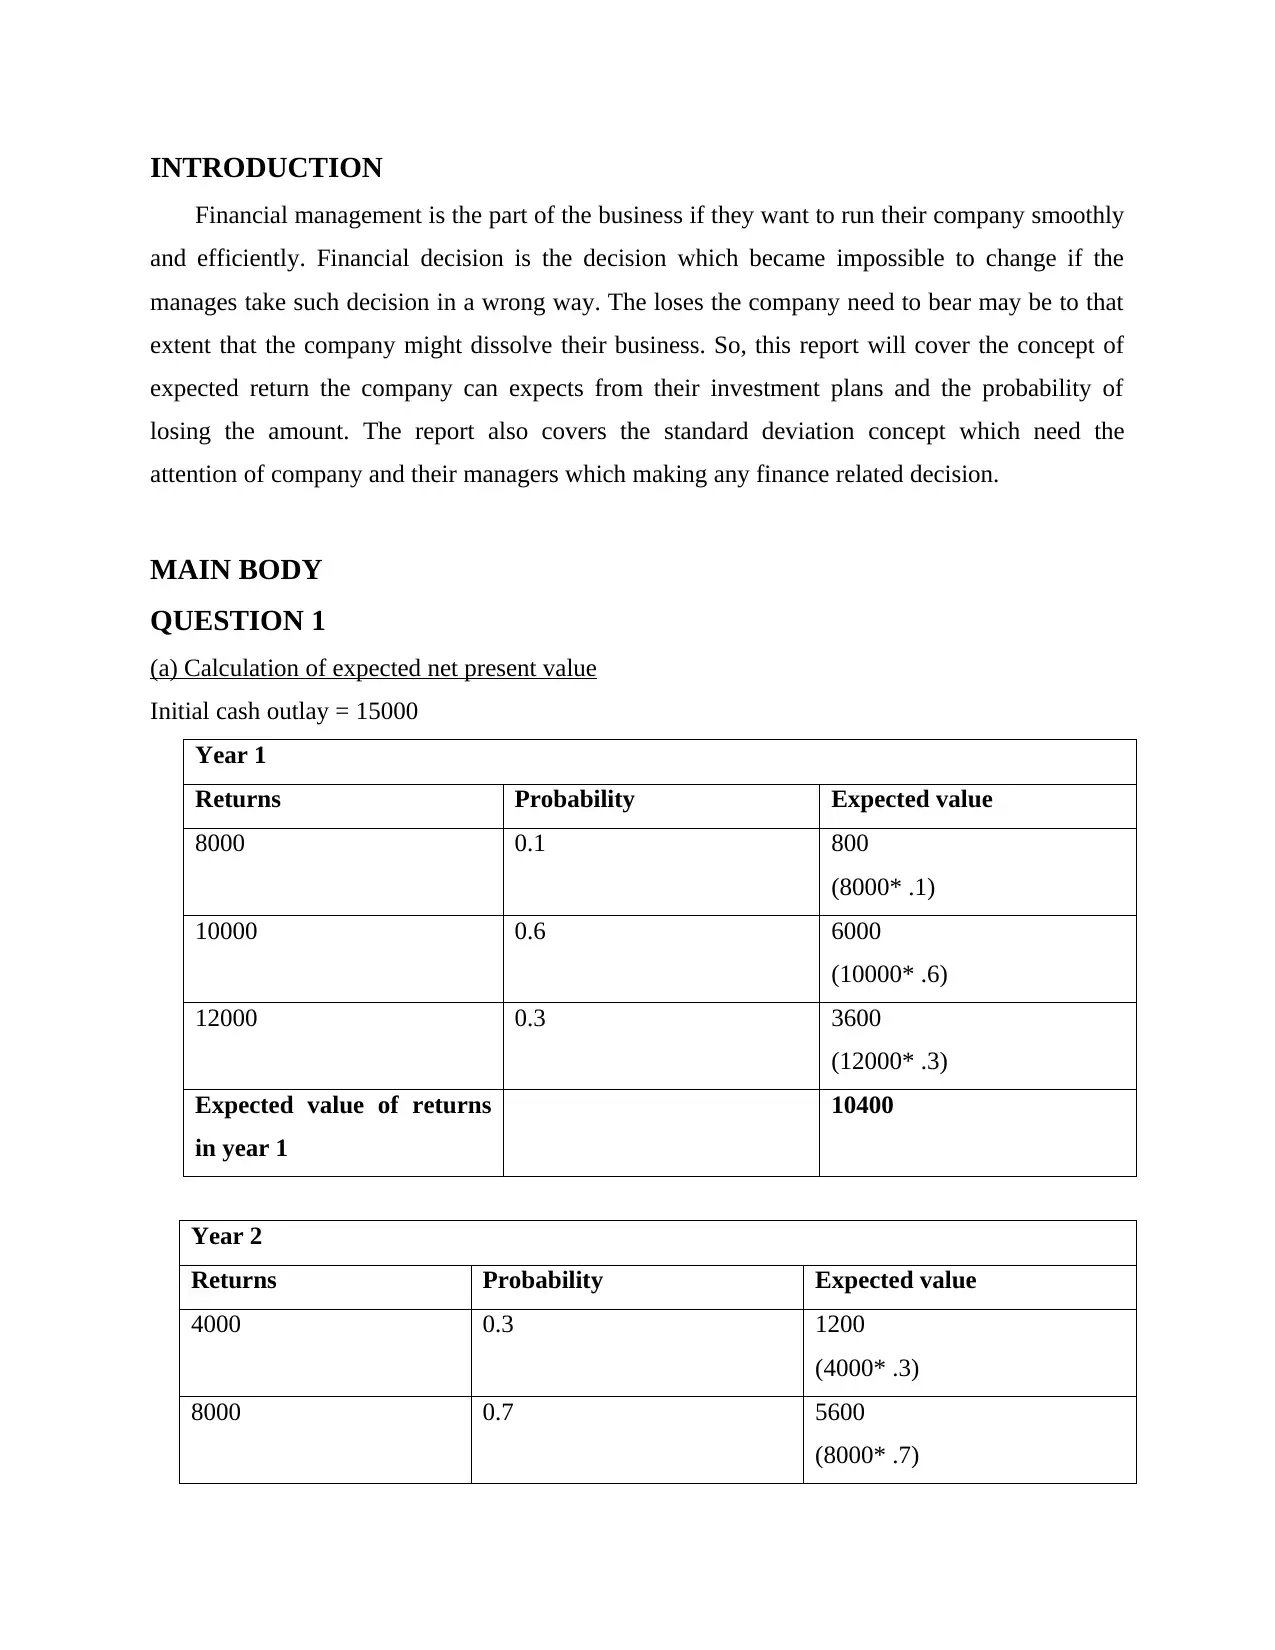
(a) Calculation of expected net present value
Initial cash outlay = 15000
Year 1
Returns Probability Expected value
8000 0.1 800
(8000* .1)
10000 0.6 6000
(10000* .6)
12000 0.3 3600
(12000* .3)
Expected value of returns
in year 1
10400
Year 2
Returns Probability Expected value
4000 0.3 1200
(4000* .3)
8000 0.7 5600
(8000* .7)
Financial management is the part of the business if they want to run their company smoothly
and efficiently. Financial decision is the decision which became impossible to change if the
manages take such decision in a wrong way. The loses the company need to bear may be to that
extent that the company might dissolve their business. So, this report will cover the concept of
expected return the company can expects from their investment plans and the probability of
losing the amount. The report also covers the standard deviation concept which need the
attention of company and their managers which making any finance related decision.
MAIN BODY
QUESTION 1
(a) Calculation of expected net present value
Initial cash outlay = 15000
Year 1
Returns Probability Expected value
8000 0.1 800
(8000* .1)
10000 0.6 6000
(10000* .6)
12000 0.3 3600
(12000* .3)
Expected value of returns
in year 1
10400
Year 2
Returns Probability Expected value
4000 0.3 1200
(4000* .3)
8000 0.7 5600
(8000* .7)
⊘ This is a preview!⊘
Do you want full access?
Subscribe today to unlock all pages.
Trusted by 1+ million students worldwide
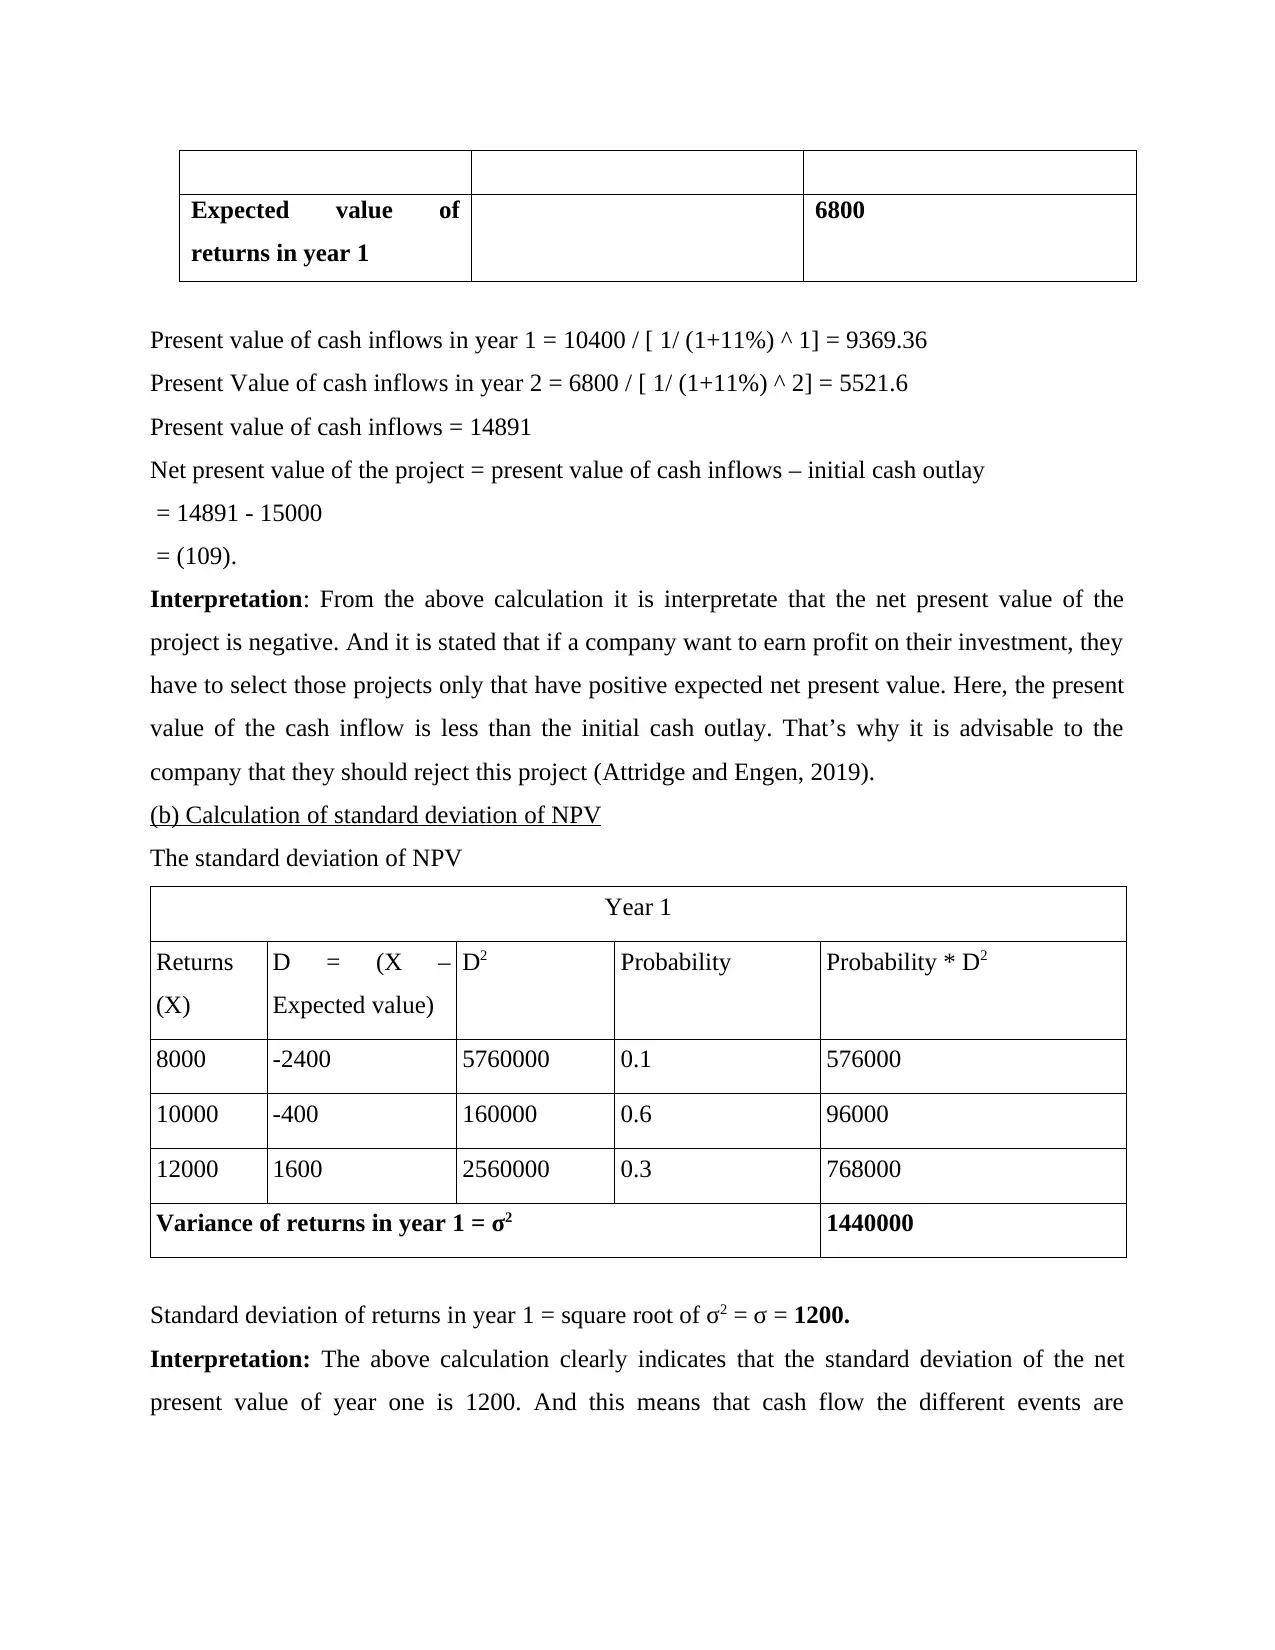
Expected value of
returns in year 1
6800
Present value of cash inflows in year 1 = 10400 / [ 1/ (1+11%) ^ 1] = 9369.36
Present Value of cash inflows in year 2 = 6800 / [ 1/ (1+11%) ^ 2] = 5521.6
Present value of cash inflows = 14891
Net present value of the project = present value of cash inflows – initial cash outlay
= 14891 - 15000
= (109).
Interpretation: From the above calculation it is interpretate that the net present value of the
project is negative. And it is stated that if a company want to earn profit on their investment, they
have to select those projects only that have positive expected net present value. Here, the present
value of the cash inflow is less than the initial cash outlay. That’s why it is advisable to the
company that they should reject this project (Attridge and Engen, 2019).
(b) Calculation of standard deviation of NPV
The standard deviation of NPV
Year 1
Returns
(X)
D = (X –
Expected value)
D2 Probability Probability * D2
8000 -2400 5760000 0.1 576000
10000 -400 160000 0.6 96000
12000 1600 2560000 0.3 768000
Variance of returns in year 1 = σ2 1440000
Standard deviation of returns in year 1 = square root of σ2 = σ = 1200.
Interpretation: The above calculation clearly indicates that the standard deviation of the net
present value of year one is 1200. And this means that cash flow the different events are
Paraphrase This Document
Need a fresh take? Get an instant paraphrase of this document with our AI Paraphraser
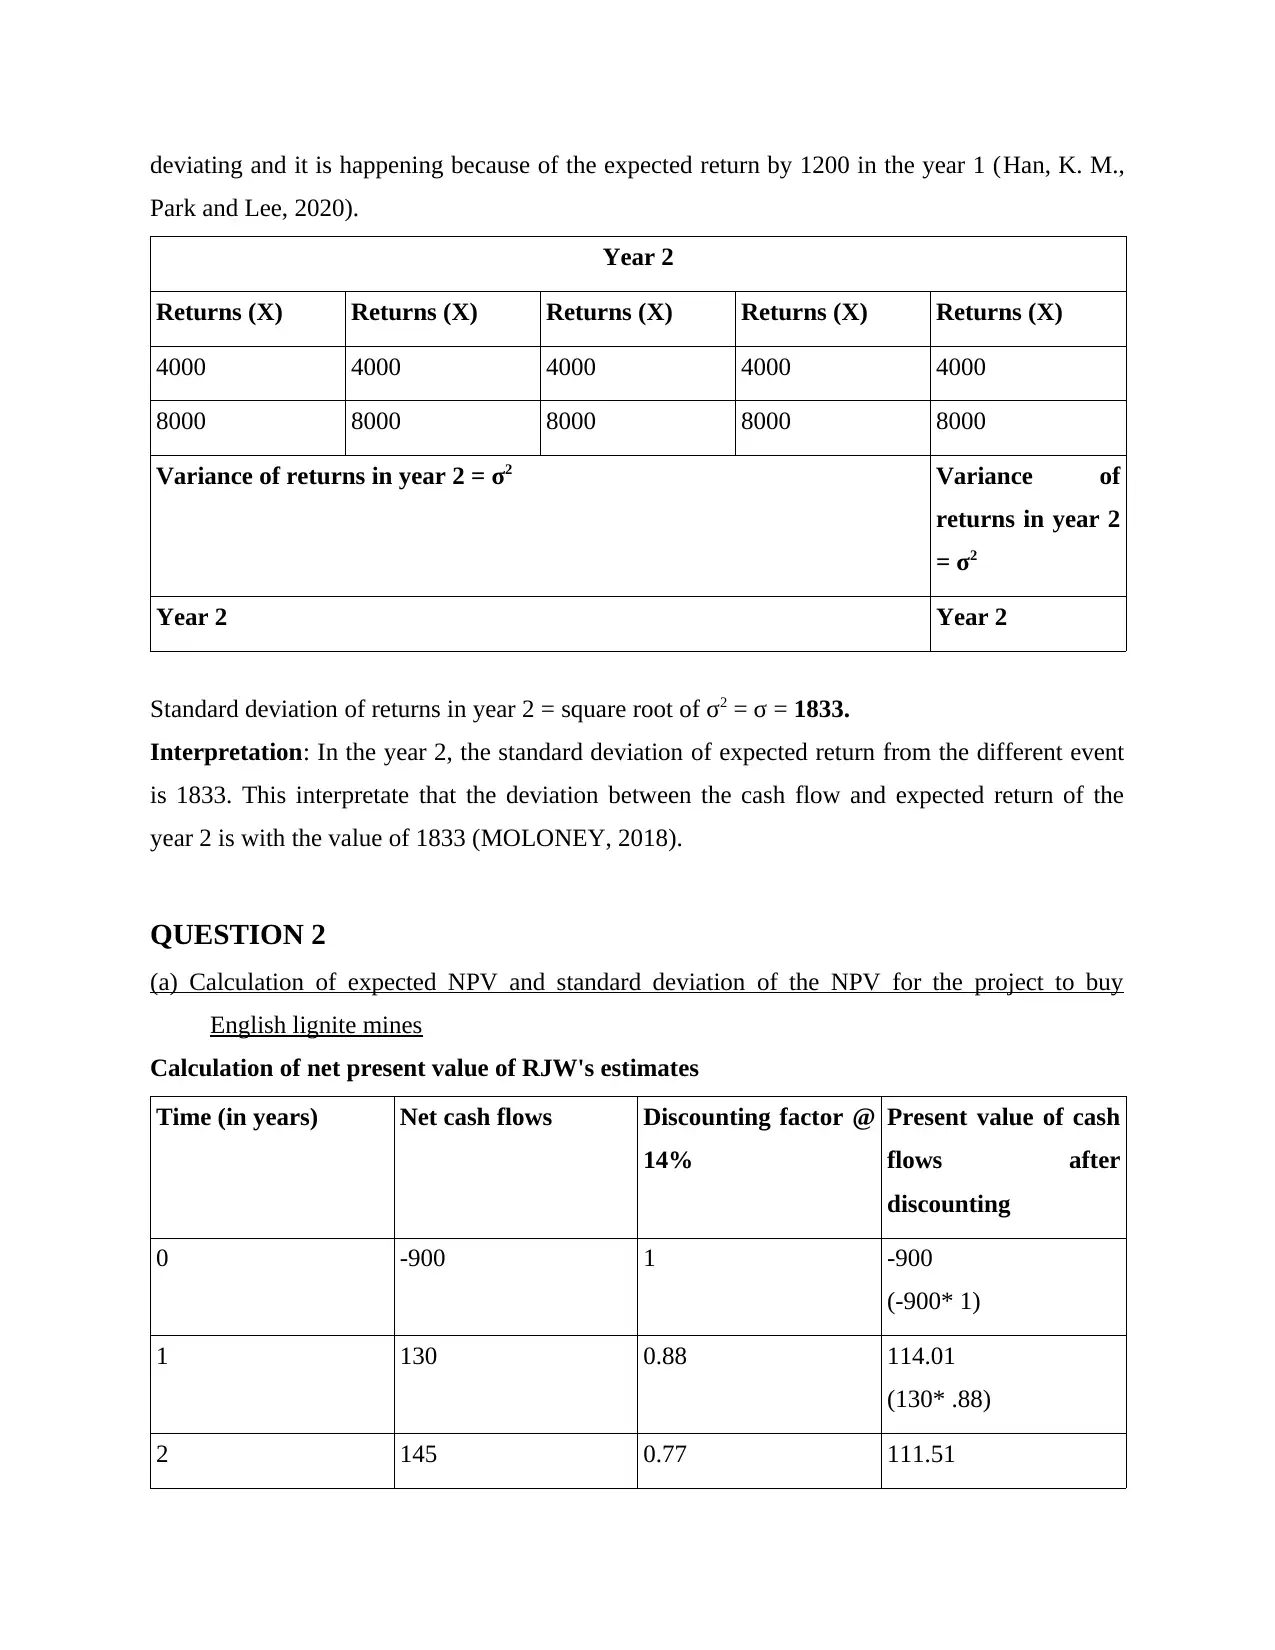
deviating and it is happening because of the expected return by 1200 in the year 1 (Han, K. M.,
Park and Lee, 2020).
Year 2
Returns (X) Returns (X) Returns (X) Returns (X) Returns (X)
4000 4000 4000 4000 4000
8000 8000 8000 8000 8000
Variance of returns in year 2 = σ2 Variance of
returns in year 2
= σ2
Year 2 Year 2
Standard deviation of returns in year 2 = square root of σ2 = σ = 1833.
Interpretation: In the year 2, the standard deviation of expected return from the different event
is 1833. This interpretate that the deviation between the cash flow and expected return of the
year 2 is with the value of 1833 (MOLONEY, 2018).
QUESTION 2
(a) Calculation of expected NPV and standard deviation of the NPV for the project to buy
English lignite mines
Calculation of net present value of RJW's estimates
Time (in years) Net cash flows Discounting factor @
14%
Present value of cash
flows after
discounting
0 -900 1 -900
(-900* 1)
1 130 0.88 114.01
(130* .88)
2 145 0.77 111.51
(145* .77)
3 150 0.68 101.25
(150* .68)
4 130 0.59 76.96
(130* .59)
5 150 0.52 77.85
(150* .52)
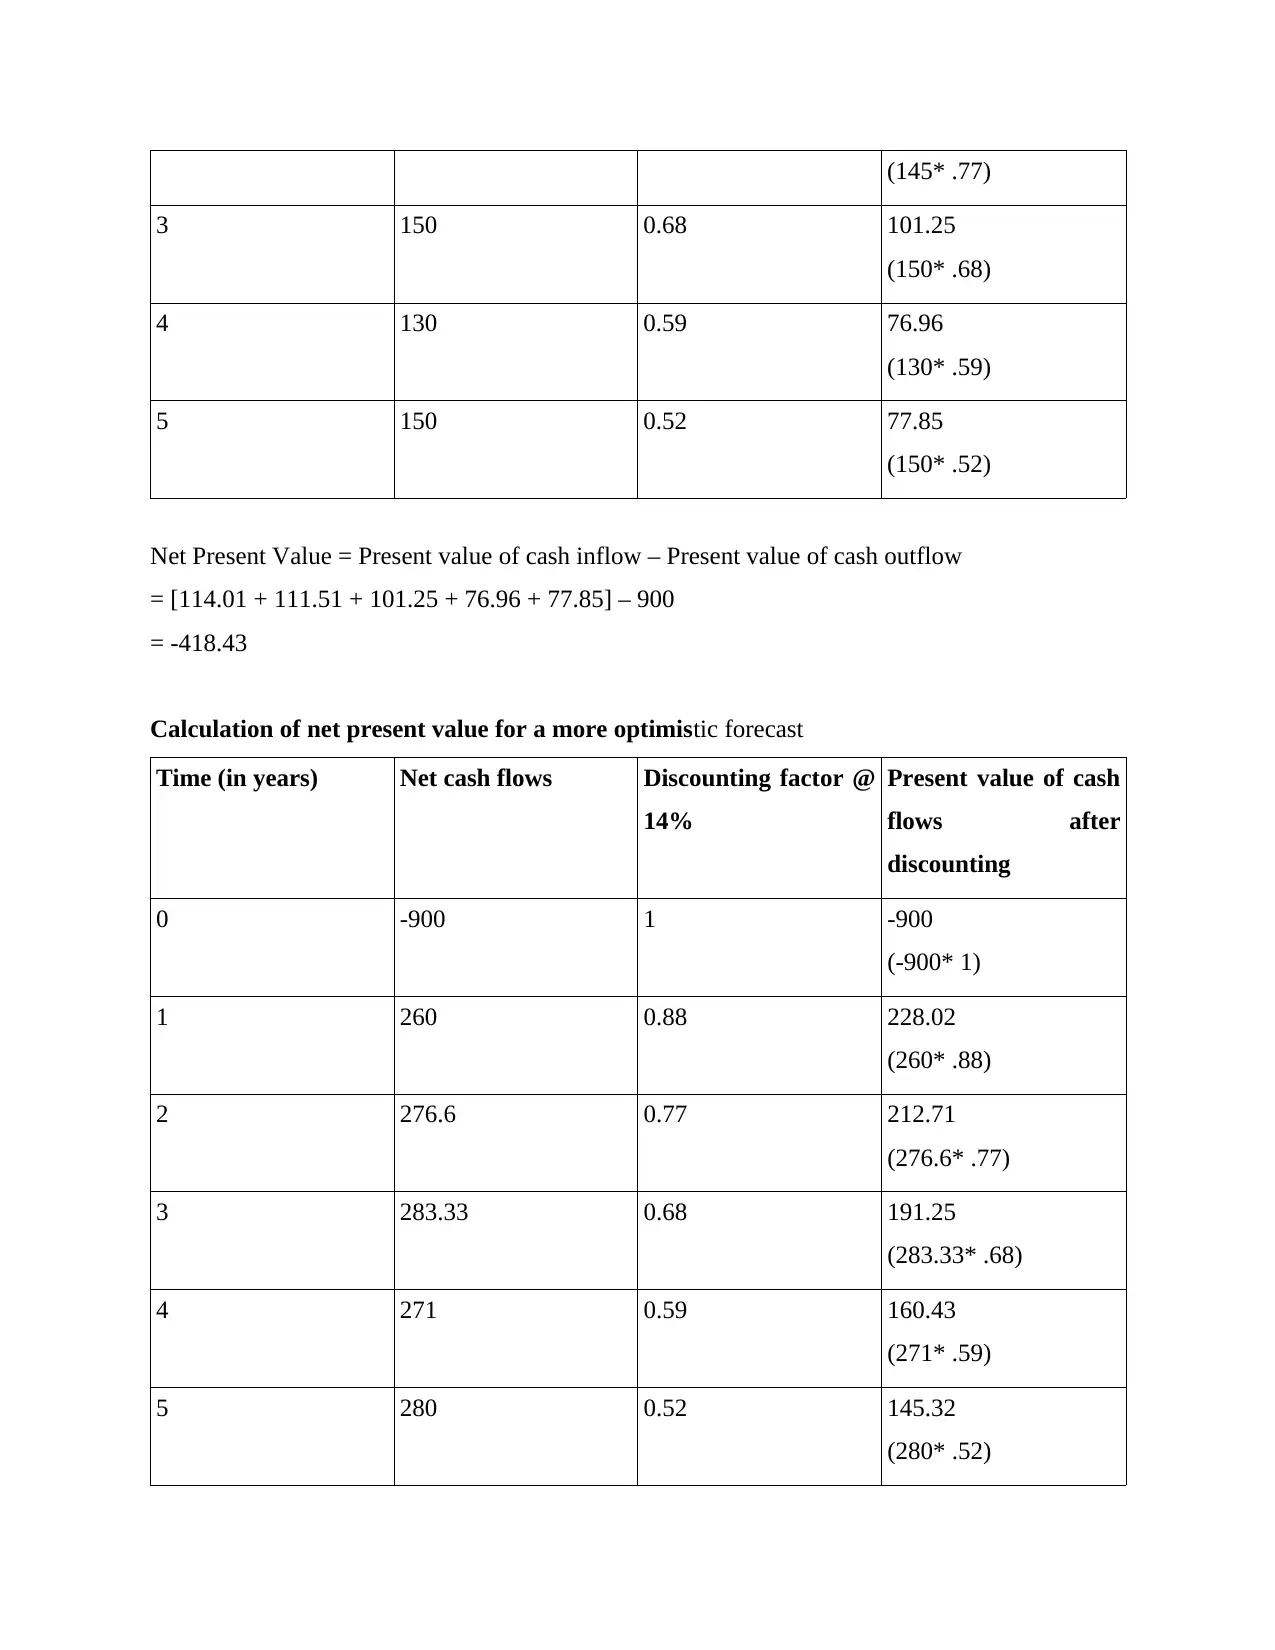
Net Present Value = Present value of cash inflow – Present value of cash outflow
= [114.01 + 111.51 + 101.25 + 76.96 + 77.85] – 900
= -418.43
Calculation of net present value for a more optimistic forecast
Time (in years) Net cash flows Discounting factor @
14%
Present value of cash
flows after
discounting
0 -900 1 -900
(-900* 1)
1 260 0.88 228.02
(260* .88)
2 276.6 0.77 212.71
(276.6* .77)
3 283.33 0.68 191.25
(283.33* .68)
4 271 0.59 160.43
(271* .59)
5 280 0.52 145.32
(280* .52)
3 150 0.68 101.25
(150* .68)
4 130 0.59 76.96
(130* .59)
5 150 0.52 77.85
(150* .52)
Net Present Value = Present value of cash inflow – Present value of cash outflow
= [114.01 + 111.51 + 101.25 + 76.96 + 77.85] – 900
= -418.43
Calculation of net present value for a more optimistic forecast
Time (in years) Net cash flows Discounting factor @
14%
Present value of cash
flows after
discounting
0 -900 1 -900
(-900* 1)
1 260 0.88 228.02
(260* .88)
2 276.6 0.77 212.71
(276.6* .77)
3 283.33 0.68 191.25
(283.33* .68)
4 271 0.59 160.43
(271* .59)
5 280 0.52 145.32
(280* .52)
⊘ This is a preview!⊘
Do you want full access?
Subscribe today to unlock all pages.
Trusted by 1+ million students worldwide
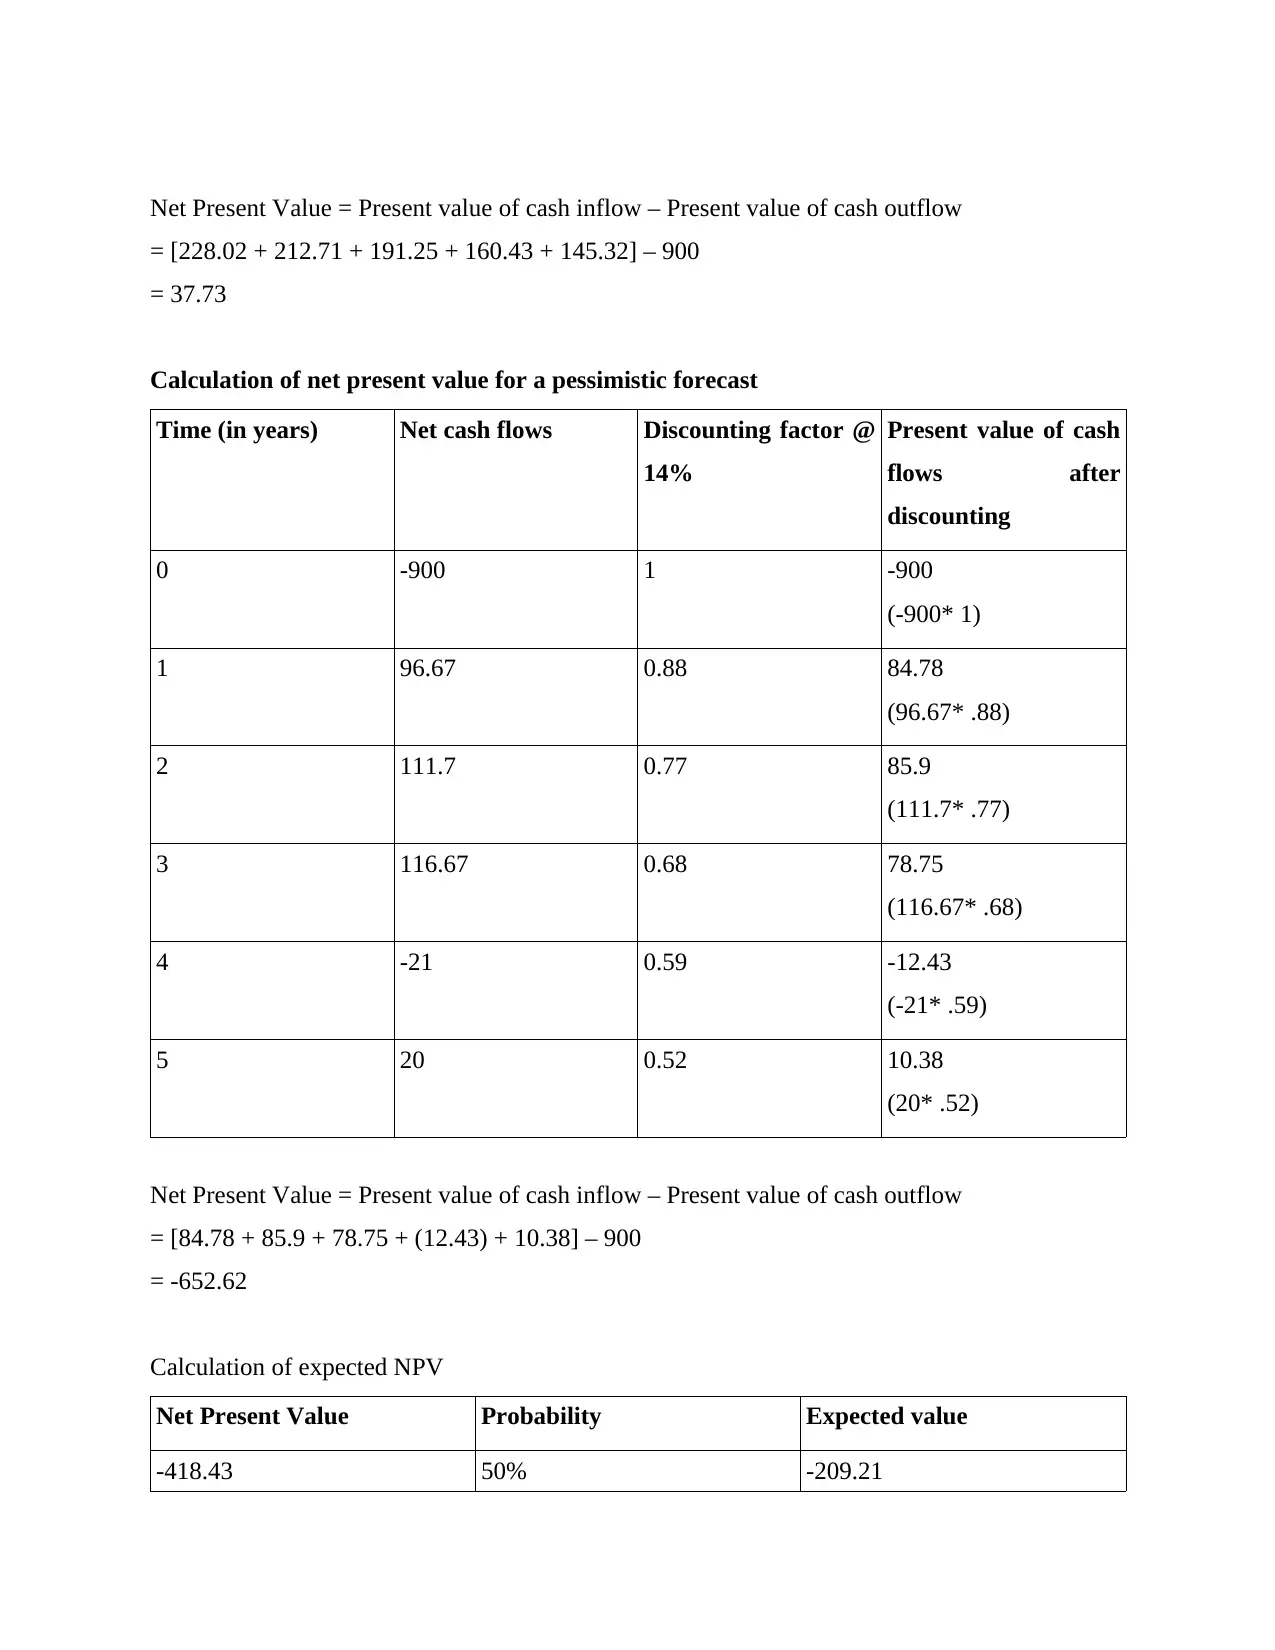
Net Present Value = Present value of cash inflow – Present value of cash outflow
= [228.02 + 212.71 + 191.25 + 160.43 + 145.32] – 900
= 37.73
Calculation of net present value for a pessimistic forecast
Time (in years) Net cash flows Discounting factor @
14%
Present value of cash
flows after
discounting
0 -900 1 -900
(-900* 1)
1 96.67 0.88 84.78
(96.67* .88)
2 111.7 0.77 85.9
(111.7* .77)
3 116.67 0.68 78.75
(116.67* .68)
4 -21 0.59 -12.43
(-21* .59)
5 20 0.52 10.38
(20* .52)
Net Present Value = Present value of cash inflow – Present value of cash outflow
= [84.78 + 85.9 + 78.75 + (12.43) + 10.38] – 900
= -652.62
Calculation of expected NPV
Net Present Value Probability Expected value
-418.43 50% -209.21
Paraphrase This Document
Need a fresh take? Get an instant paraphrase of this document with our AI Paraphraser
(-418.43* 50%)
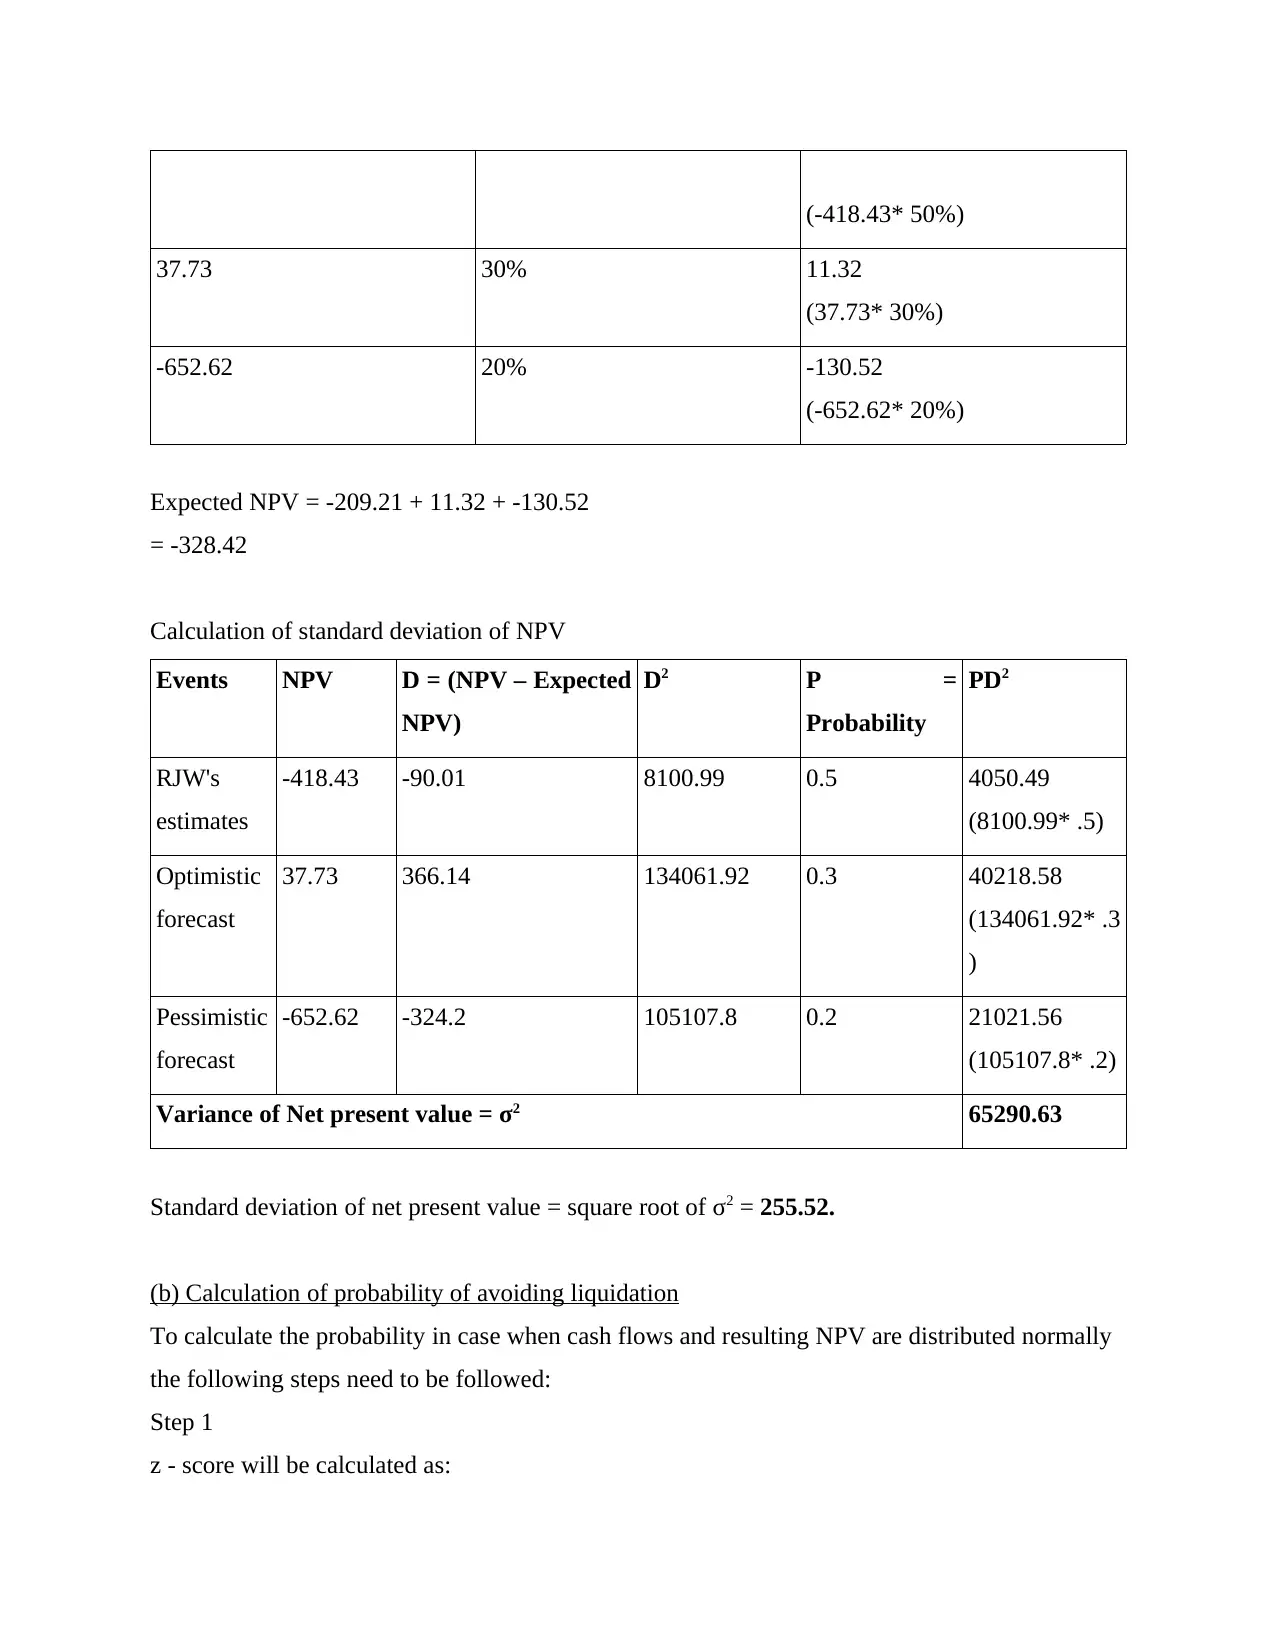
37.73 30% 11.32
(37.73* 30%)
-652.62 20% -130.52
(-652.62* 20%)
Expected NPV = -209.21 + 11.32 + -130.52
= -328.42
Calculation of standard deviation of NPV
Events NPV D = (NPV – Expected
NPV)
D2 P =
Probability
PD2
RJW's
estimates
-418.43 -90.01 8100.99 0.5 4050.49
(8100.99* .5)
Optimistic
forecast
37.73 366.14 134061.92 0.3 40218.58
(134061.92* .3
)
Pessimistic
forecast
-652.62 -324.2 105107.8 0.2 21021.56
(105107.8* .2)
Variance of Net present value = σ2 65290.63
Standard deviation of net present value = square root of σ2 = 255.52.
(b) Calculation of probability of avoiding liquidation
To calculate the probability in case when cash flows and resulting NPV are distributed normally
the following steps need to be followed:
Step 1
z - score will be calculated as:
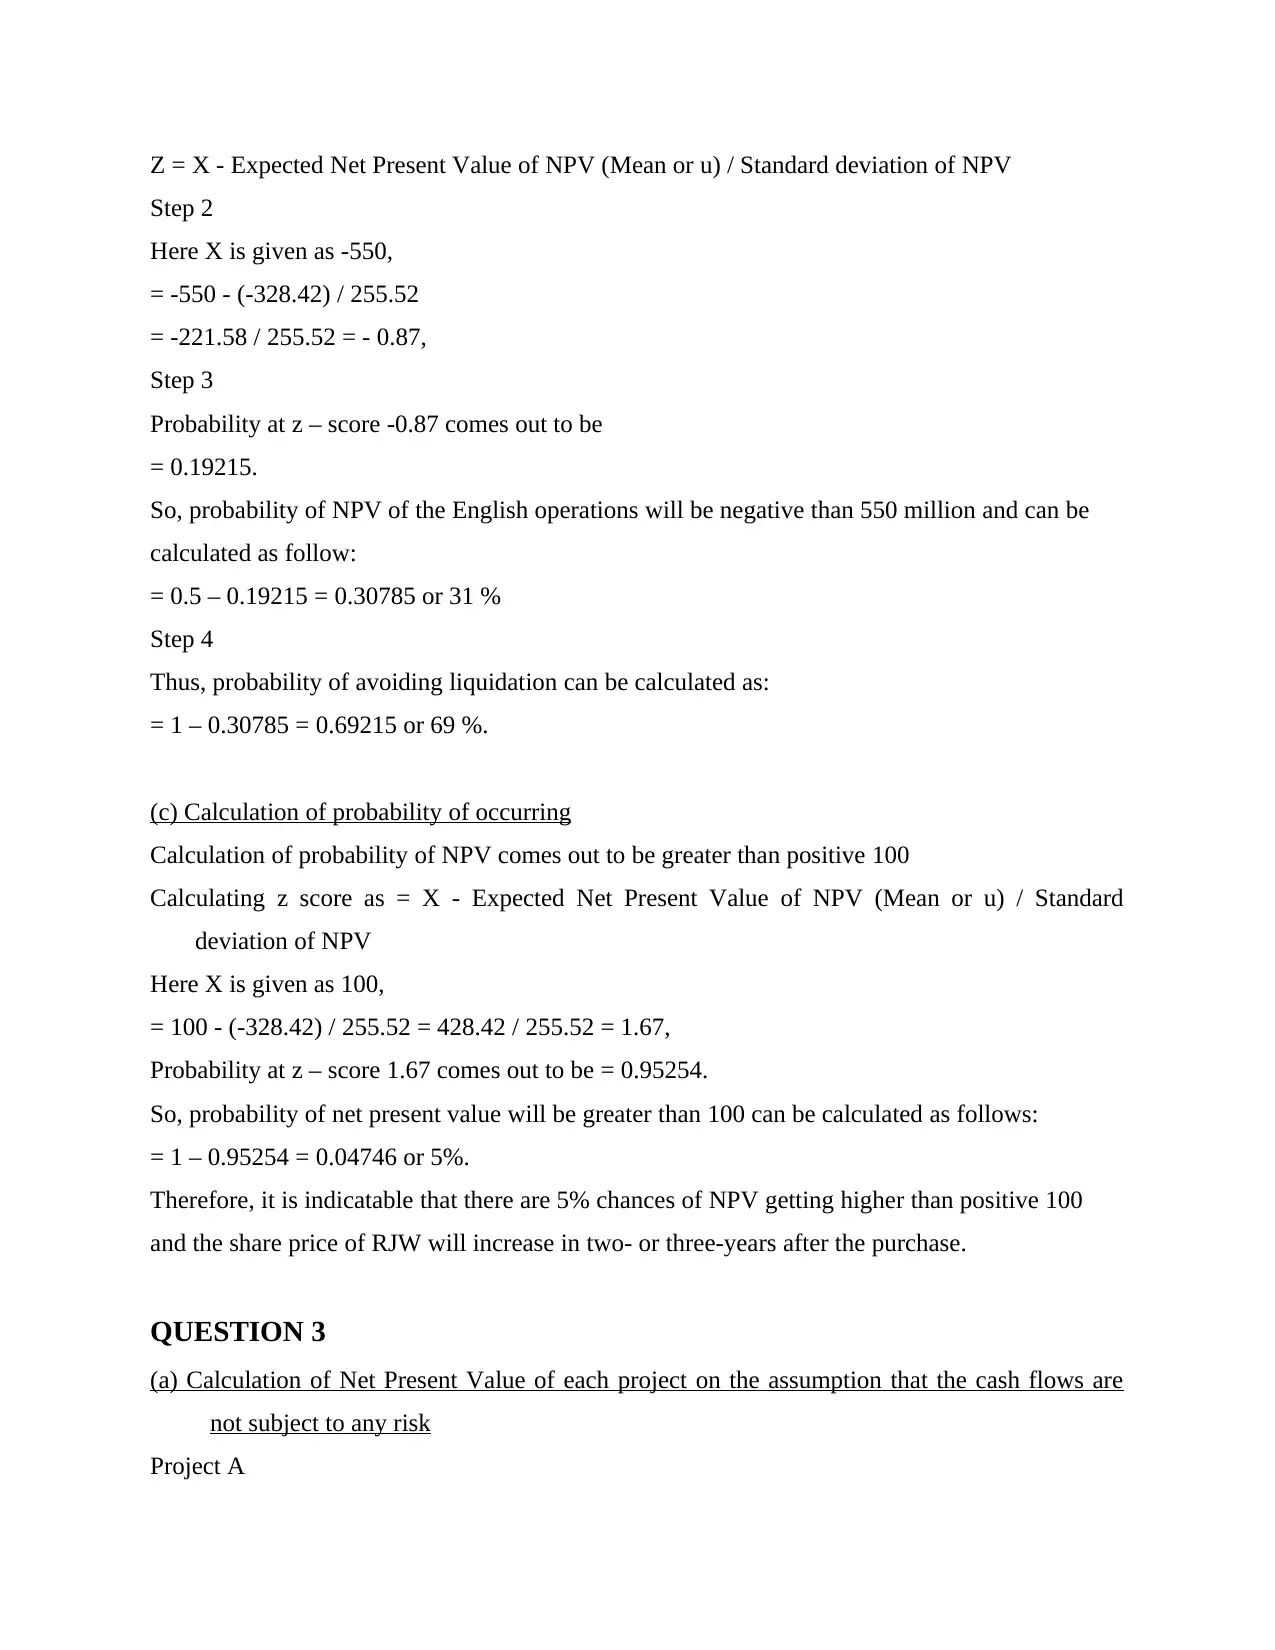
Z = X - Expected Net Present Value of NPV (Mean or u) / Standard deviation of NPV
Step 2
Here X is given as -550,
= -550 - (-328.42) / 255.52
= -221.58 / 255.52 = - 0.87,
Step 3
Probability at z – score -0.87 comes out to be
= 0.19215.
So, probability of NPV of the English operations will be negative than 550 million and can be
calculated as follow:
= 0.5 – 0.19215 = 0.30785 or 31 %
Step 4
Thus, probability of avoiding liquidation can be calculated as:
= 1 – 0.30785 = 0.69215 or 69 %.
(c) Calculation of probability of occurring
Calculation of probability of NPV comes out to be greater than positive 100
Calculating z score as = X - Expected Net Present Value of NPV (Mean or u) / Standard
deviation of NPV
Here X is given as 100,
= 100 - (-328.42) / 255.52 = 428.42 / 255.52 = 1.67,
Probability at z – score 1.67 comes out to be = 0.95254.
So, probability of net present value will be greater than 100 can be calculated as follows:
= 1 – 0.95254 = 0.04746 or 5%.
Therefore, it is indicatable that there are 5% chances of NPV getting higher than positive 100
and the share price of RJW will increase in two- or three-years after the purchase.
QUESTION 3
(a) Calculation of Net Present Value of each project on the assumption that the cash flows are
not subject to any risk
Project A
⊘ This is a preview!⊘
Do you want full access?
Subscribe today to unlock all pages.
Trusted by 1+ million students worldwide
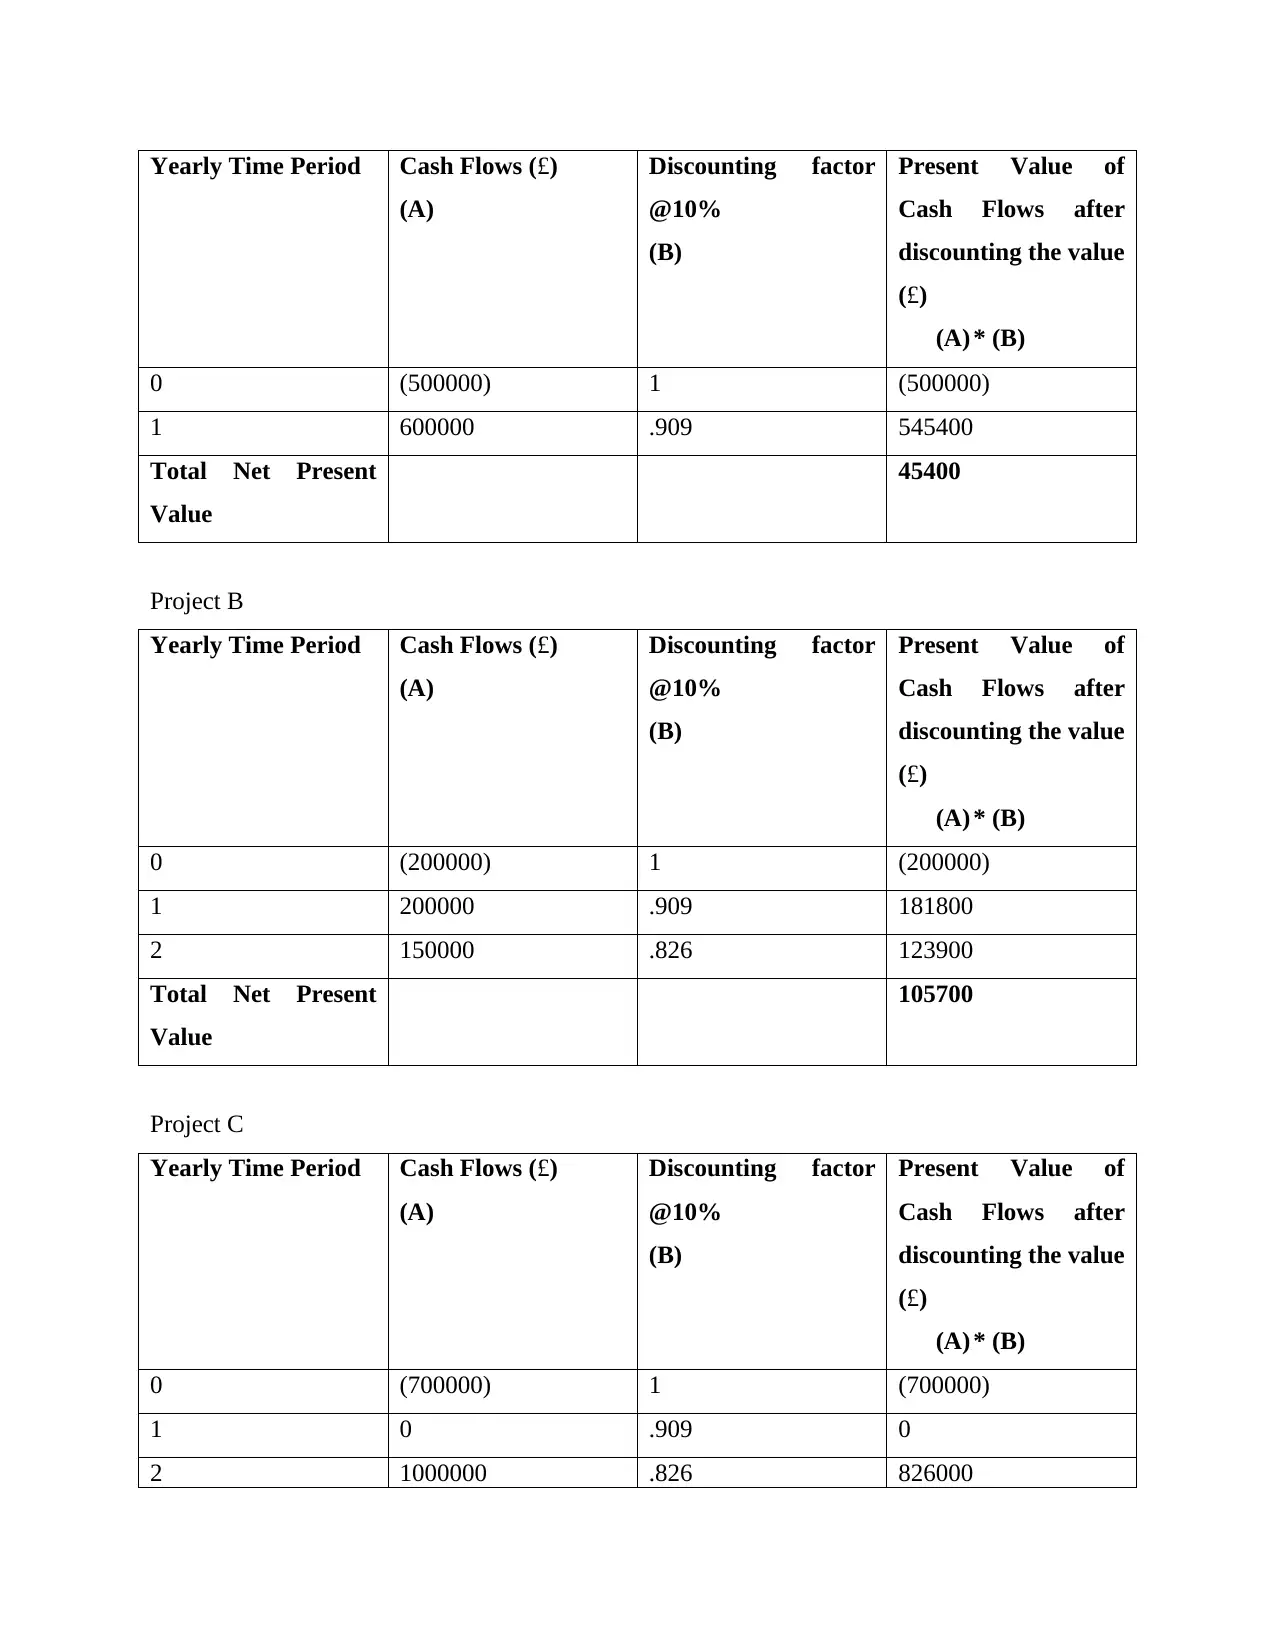
Yearly Time Period Cash Flows (£)
(A)
Discounting factor
@10%
(B)
Present Value of
Cash Flows after
discounting the value
(£)
(A) * (B)
0 (500000) 1 (500000)
1 600000 .909 545400
Total Net Present
Value
45400
Project B
Yearly Time Period Cash Flows (£)
(A)
Discounting factor
@10%
(B)
Present Value of
Cash Flows after
discounting the value
(£)
(A) * (B)
0 (200000) 1 (200000)
1 200000 .909 181800
2 150000 .826 123900
Total Net Present
Value
105700
Project C
Yearly Time Period Cash Flows (£)
(A)
Discounting factor
@10%
(B)
Present Value of
Cash Flows after
discounting the value
(£)
(A) * (B)
0 (700000) 1 (700000)
1 0 .909 0
2 1000000 .826 826000
(A)
Discounting factor
@10%
(B)
Present Value of
Cash Flows after
discounting the value
(£)
(A) * (B)
0 (500000) 1 (500000)
1 600000 .909 545400
Total Net Present
Value
45400
Project B
Yearly Time Period Cash Flows (£)
(A)
Discounting factor
@10%
(B)
Present Value of
Cash Flows after
discounting the value
(£)
(A) * (B)
0 (200000) 1 (200000)
1 200000 .909 181800
2 150000 .826 123900
Total Net Present
Value
105700
Project C
Yearly Time Period Cash Flows (£)
(A)
Discounting factor
@10%
(B)
Present Value of
Cash Flows after
discounting the value
(£)
(A) * (B)
0 (700000) 1 (700000)
1 0 .909 0
2 1000000 .826 826000
Paraphrase This Document
Need a fresh take? Get an instant paraphrase of this document with our AI Paraphraser
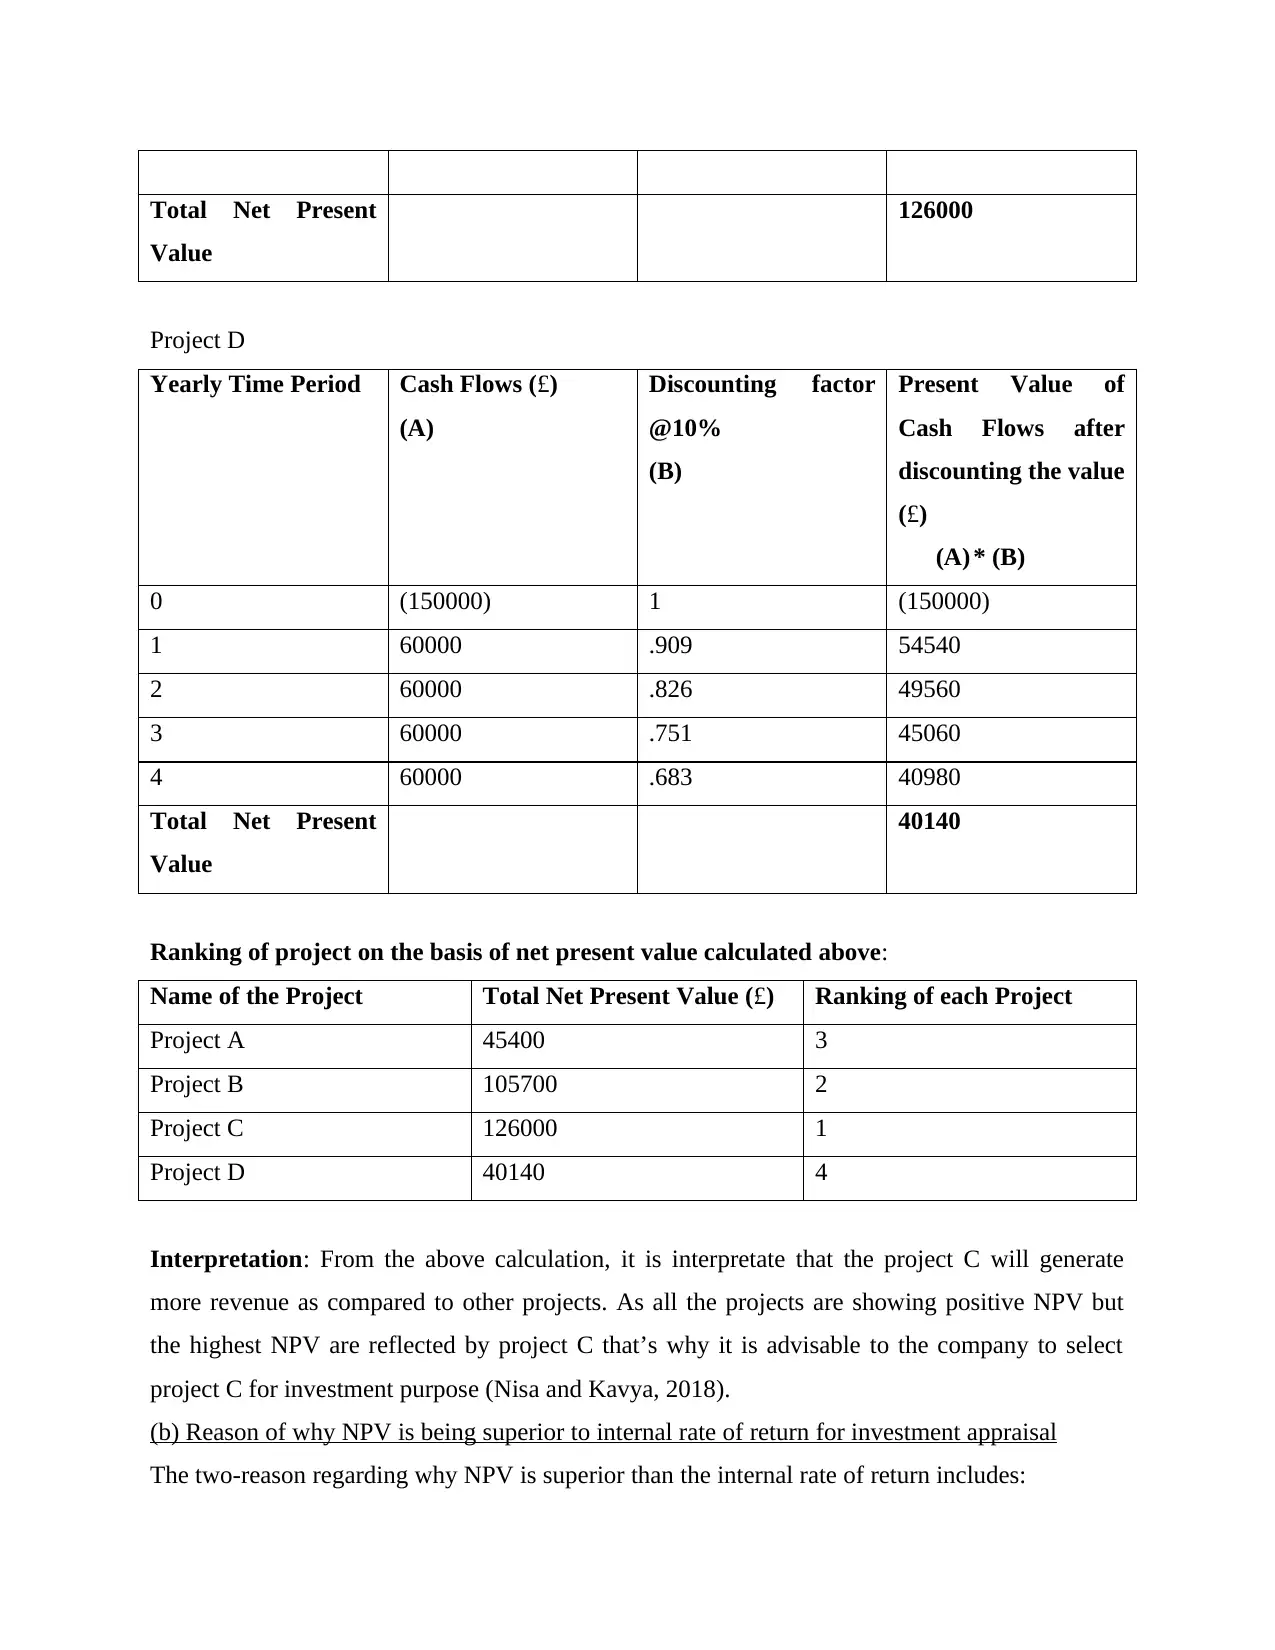
Total Net Present
Value
126000
Project D
Yearly Time Period Cash Flows (£)
(A)
Discounting factor
@10%
(B)
Present Value of
Cash Flows after
discounting the value
(£)
(A) * (B)
0 (150000) 1 (150000)
1 60000 .909 54540
2 60000 .826 49560
3 60000 .751 45060
4 60000 .683 40980
Total Net Present
Value
40140
Ranking of project on the basis of net present value calculated above:
Name of the Project Total Net Present Value (£) Ranking of each Project
Project A 45400 3
Project B 105700 2
Project C 126000 1
Project D 40140 4
Interpretation: From the above calculation, it is interpretate that the project C will generate
more revenue as compared to other projects. As all the projects are showing positive NPV but
the highest NPV are reflected by project C that’s why it is advisable to the company to select
project C for investment purpose (Nisa and Kavya, 2018).
(b) Reason of why NPV is being superior to internal rate of return for investment appraisal
The two-reason regarding why NPV is superior than the internal rate of return includes:
Value
126000
Project D
Yearly Time Period Cash Flows (£)
(A)
Discounting factor
@10%
(B)
Present Value of
Cash Flows after
discounting the value
(£)
(A) * (B)
0 (150000) 1 (150000)
1 60000 .909 54540
2 60000 .826 49560
3 60000 .751 45060
4 60000 .683 40980
Total Net Present
Value
40140
Ranking of project on the basis of net present value calculated above:
Name of the Project Total Net Present Value (£) Ranking of each Project
Project A 45400 3
Project B 105700 2
Project C 126000 1
Project D 40140 4
Interpretation: From the above calculation, it is interpretate that the project C will generate
more revenue as compared to other projects. As all the projects are showing positive NPV but
the highest NPV are reflected by project C that’s why it is advisable to the company to select
project C for investment purpose (Nisa and Kavya, 2018).
(b) Reason of why NPV is being superior to internal rate of return for investment appraisal
The two-reason regarding why NPV is superior than the internal rate of return includes:
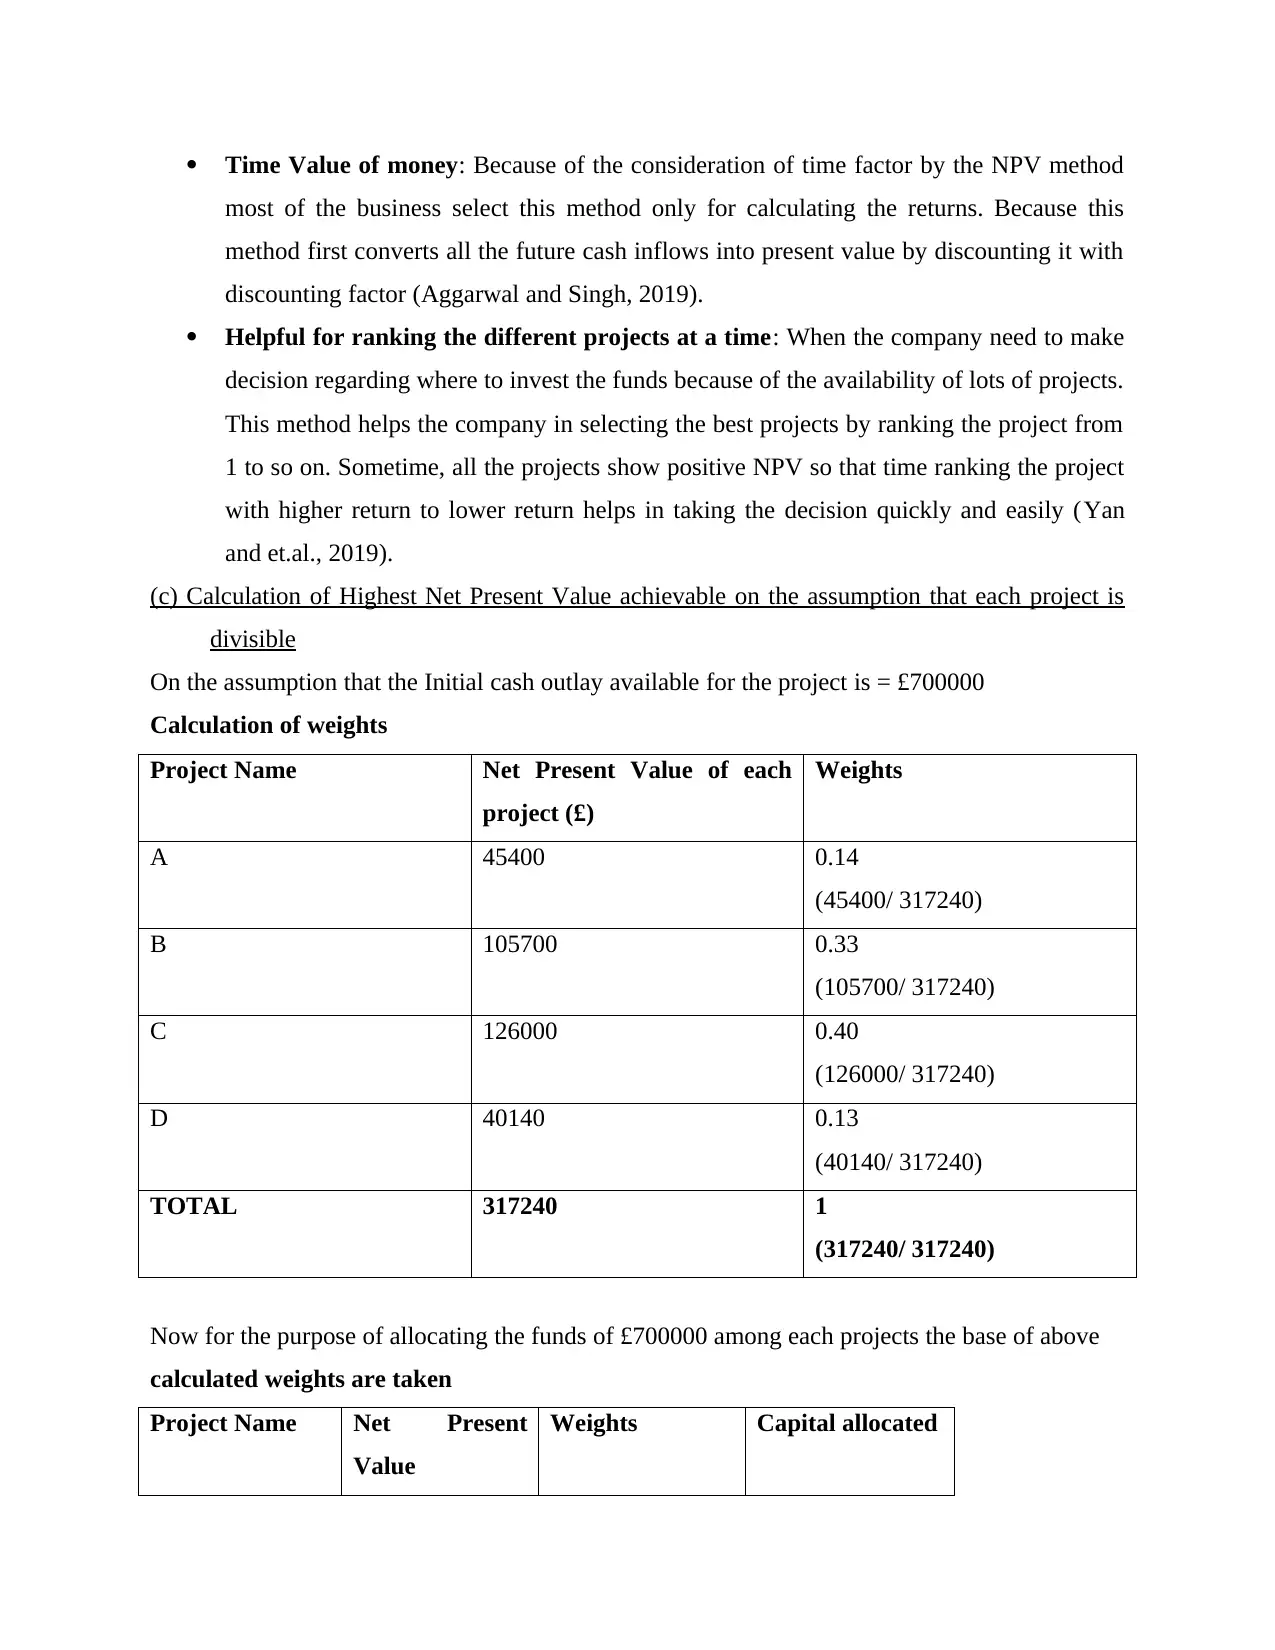
Time Value of money: Because of the consideration of time factor by the NPV method
most of the business select this method only for calculating the returns. Because this
method first converts all the future cash inflows into present value by discounting it with
discounting factor (Aggarwal and Singh, 2019).
Helpful for ranking the different projects at a time: When the company need to make
decision regarding where to invest the funds because of the availability of lots of projects.
This method helps the company in selecting the best projects by ranking the project from
1 to so on. Sometime, all the projects show positive NPV so that time ranking the project
with higher return to lower return helps in taking the decision quickly and easily (Yan
and et.al., 2019).
(c) Calculation of Highest Net Present Value achievable on the assumption that each project is
divisible
On the assumption that the Initial cash outlay available for the project is = £700000
Calculation of weights
Project Name Net Present Value of each
project (£)
Weights
A 45400 0.14
(45400/ 317240)
B 105700 0.33
(105700/ 317240)
C 126000 0.40
(126000/ 317240)
D 40140 0.13
(40140/ 317240)
TOTAL 317240 1
(317240/ 317240)
Now for the purpose of allocating the funds of £700000 among each projects the base of above
calculated weights are taken
Project Name Net Present
Value
Weights Capital allocated
⊘ This is a preview!⊘
Do you want full access?
Subscribe today to unlock all pages.
Trusted by 1+ million students worldwide
1 out of 18
Related Documents

![International Finance Management Assignment - Finance [Course Code]](/_next/image/?url=https%3A%2F%2Fdesklib.com%2Fmedia%2Fimages%2Ffd%2F69271dad5c5f4f2c8ab93e7e6daf77ee.jpg&w=256&q=75)


Your All-in-One AI-Powered Toolkit for Academic Success.
+13062052269
info@desklib.com
Available 24*7 on WhatsApp / Email
![[object Object]](/_next/static/media/star-bottom.7253800d.svg)
Unlock your academic potential
Copyright © 2020–2026 A2Z Services. All Rights Reserved. Developed and managed by ZUCOL.