International Financial Management Assignment: Company Analysis
VerifiedAdded on 2023/01/09
|14
|3993
|42
Homework Assignment
AI Summary
This assignment provides a comprehensive analysis of two companies' financial performance using various financial ratios, including profitability, investor, efficiency, and gearing ratios. It calculates and compares the Return on Capital Employed (ROCE), Gross Profit Margin, Net Profit Margin, Return on Equity (ROE), Asset Turnover, Inventory Turnover, Accounts Receivable Turnover, and Interest Cover ratios. The analysis evaluates the financial health and efficiency of each company, highlighting strengths and weaknesses. Furthermore, the assignment delves into the calculation of the Weighted Average Cost of Capital (WACC) and the Book Value Weighted Average Cost of Capital. It discusses the circumstances where WACC is applicable in investment appraisal techniques and its limitations. Finally, the assignment explores the objectives of working capital management and its central role in financial management, providing a holistic view of financial analysis and management concepts.

INTERNATIONAL FINANCIAL
MANAGEMENT
MANAGEMENT
Paraphrase This Document
Need a fresh take? Get an instant paraphrase of this document with our AI Paraphraser
TABLE OF CONTENTS
TABLE OF CONTENTS................................................................................................................2
QUESTION ONE............................................................................................................................1
a) Calculation of the ratios...........................................................................................................1
b) Financial performance of both the companies........................................................................2
c) Limitations of the analysis.......................................................................................................5
QUESTION TWO...........................................................................................................................6
a) Calculation of the Weighted Average Cost of Capital and Book value weighted average cost
of capital of Art Co......................................................................................................................6
b) Circumstances where the weighted average cost of capital of company could be used in the
investment appraisal techniques and limitations as discount rate...............................................8
QUESTION THREE.......................................................................................................................9
Objectives of the working capital management and central role of working capital in financial
management.................................................................................................................................9
REFERENCES..............................................................................................................................12
QUESTION ONE
a) Calculation of the ratios
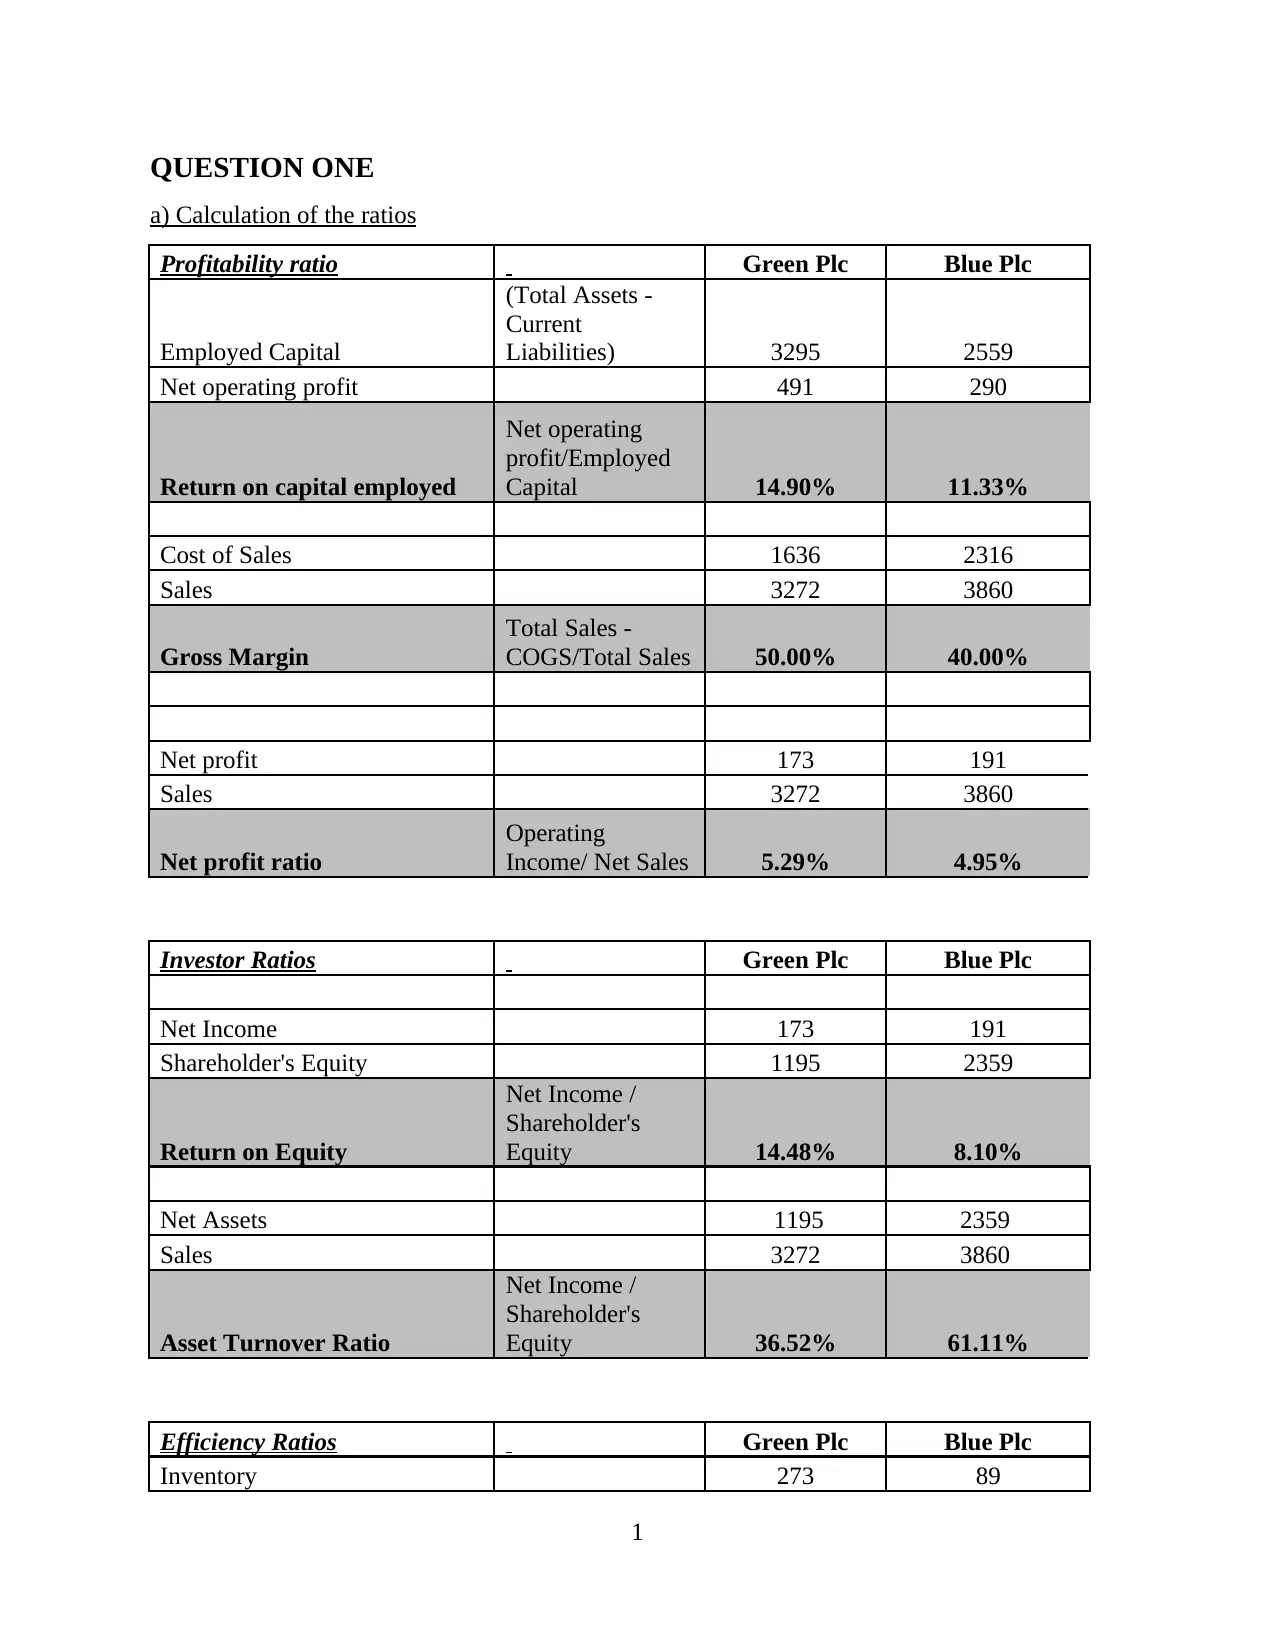
Profitability ratio Green Plc Blue Plc
Employed Capital
(Total Assets -
Current
Liabilities) 3295 2559
Net operating profit 491 290
Return on capital employed
Net operating
profit/Employed
Capital 14.90% 11.33%
Cost of Sales 1636 2316
Sales 3272 3860
Gross Margin
Total Sales -
COGS/Total Sales 50.00% 40.00%
Net profit 173 191
Sales 3272 3860
Net profit ratio
Operating
Income/ Net Sales 5.29% 4.95%
Investor Ratios Green Plc Blue Plc
Net Income 173 191
Shareholder's Equity 1195 2359
Return on Equity
Net Income /
Shareholder's
Equity 14.48% 8.10%
Net Assets 1195 2359
Sales 3272 3860
Asset Turnover Ratio
Net Income /
Shareholder's
Equity 36.52% 61.11%
Efficiency Ratios Green Plc Blue Plc
Inventory 273 89
1
a) Calculation of the ratios
Profitability ratio Green Plc Blue Plc
Employed Capital
(Total Assets -
Current
Liabilities) 3295 2559
Net operating profit 491 290
Return on capital employed
Net operating
profit/Employed
Capital 14.90% 11.33%
Cost of Sales 1636 2316
Sales 3272 3860
Gross Margin
Total Sales -
COGS/Total Sales 50.00% 40.00%
Net profit 173 191
Sales 3272 3860
Net profit ratio
Operating
Income/ Net Sales 5.29% 4.95%
Investor Ratios Green Plc Blue Plc
Net Income 173 191
Shareholder's Equity 1195 2359
Return on Equity
Net Income /
Shareholder's
Equity 14.48% 8.10%
Net Assets 1195 2359
Sales 3272 3860
Asset Turnover Ratio
Net Income /
Shareholder's
Equity 36.52% 61.11%
Efficiency Ratios Green Plc Blue Plc
Inventory 273 89
1
⊘ This is a preview!⊘
Do you want full access?
Subscribe today to unlock all pages.
Trusted by 1+ million students worldwide
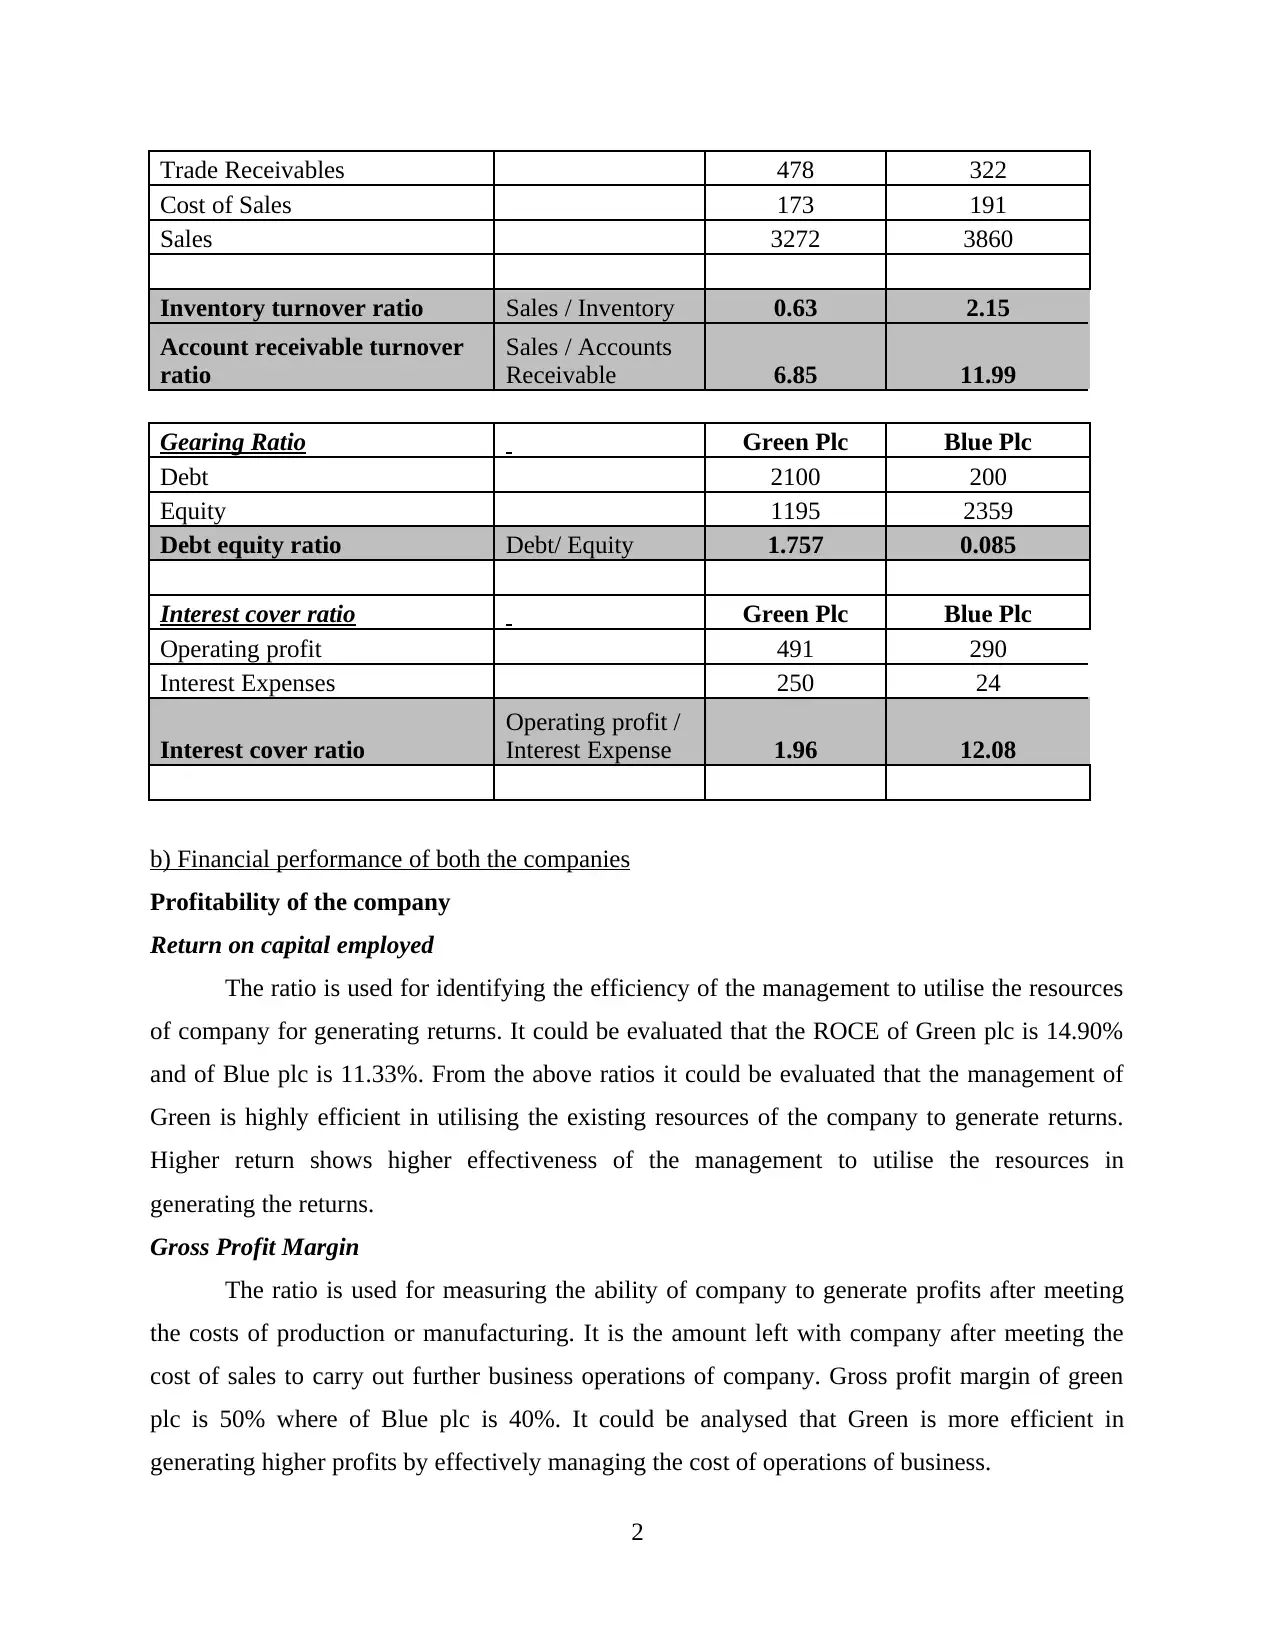
Trade Receivables 478 322
Cost of Sales 173 191
Sales 3272 3860
Inventory turnover ratio Sales / Inventory 0.63 2.15
Account receivable turnover
ratio
Sales / Accounts
Receivable 6.85 11.99
Gearing Ratio Green Plc Blue Plc
Debt 2100 200
Equity 1195 2359
Debt equity ratio Debt/ Equity 1.757 0.085
Interest cover ratio Green Plc Blue Plc
Operating profit 491 290
Interest Expenses 250 24
Interest cover ratio
Operating profit /
Interest Expense 1.96 12.08
b) Financial performance of both the companies
Profitability of the company
Return on capital employed
The ratio is used for identifying the efficiency of the management to utilise the resources
of company for generating returns. It could be evaluated that the ROCE of Green plc is 14.90%
and of Blue plc is 11.33%. From the above ratios it could be evaluated that the management of
Green is highly efficient in utilising the existing resources of the company to generate returns.
Higher return shows higher effectiveness of the management to utilise the resources in
generating the returns.
Gross Profit Margin
The ratio is used for measuring the ability of company to generate profits after meeting
the costs of production or manufacturing. It is the amount left with company after meeting the
cost of sales to carry out further business operations of company. Gross profit margin of green
plc is 50% where of Blue plc is 40%. It could be analysed that Green is more efficient in
generating higher profits by effectively managing the cost of operations of business.
2
Paraphrase This Document
Need a fresh take? Get an instant paraphrase of this document with our AI Paraphraser
Net Profit Margin
Net profit is an important profitability ratio that is used by the managers to assess the returns
or profit generated by carrying out the business. It is essential for the business to earn sufficient
for running the company as well as for growth. Net profit margin of Green plc is 5.29% and of
Blue plc is 5.95%. It could be analysed that net profit of Green plc is higher and shows that
company is effectively managing the costs to generate returns (Rakićević and et.al., 2016).
However the returns of companies are not adequate they are required to develop strategies to
increase the profits and decrease costs.
Investor Ratios
Return on Equity
It is an investor ratio used for measuring the efficiency of the management in generating
returns over capital employed. Return on equity of Green plc is 14.48% and of Blue plc is
8.10%. ROE of Blue is lower than that of the Green plc. Lower ROE represents that company is
not efficient in utilising the resources for generating returns over the capital employed. Investors
are mainly concerned towards getting adequate returns over their investments in company. If
company is not having adequate returns it will not be able to attract new investors. Blue plc is
required to take effective steps for the business for increasing the returns of company. Lower
return tends to decrease the market share of company and investors tend to shift towards
companies with higher returns. Steps for improving the performance of company is required to
be taken for controlling the costs.
Assets Turnover
Asset turnover ratio is used for measuring value of revenues or sales of company in
relation to assets. Asset turnover ratio is used as indicator of efficiency of the management in
using assets for generating assets. It is considered that higher the asset ratio higher is the
efficiency of management in generating sales from the assets. Asset turnover ratio of Green plc is
36.52% where of Blue plc is having asset turnover of 61.11%. Investor after return on their
investments is concerned with efficiency of the management in generating returns for the
business using the existing assets of company. Asset ratio is higher of Blue is high which shows
that management is more efficiently utilising the assets for generating revenues for company.
Management has the ability of making effective utilisation of the assets however it is required to
3
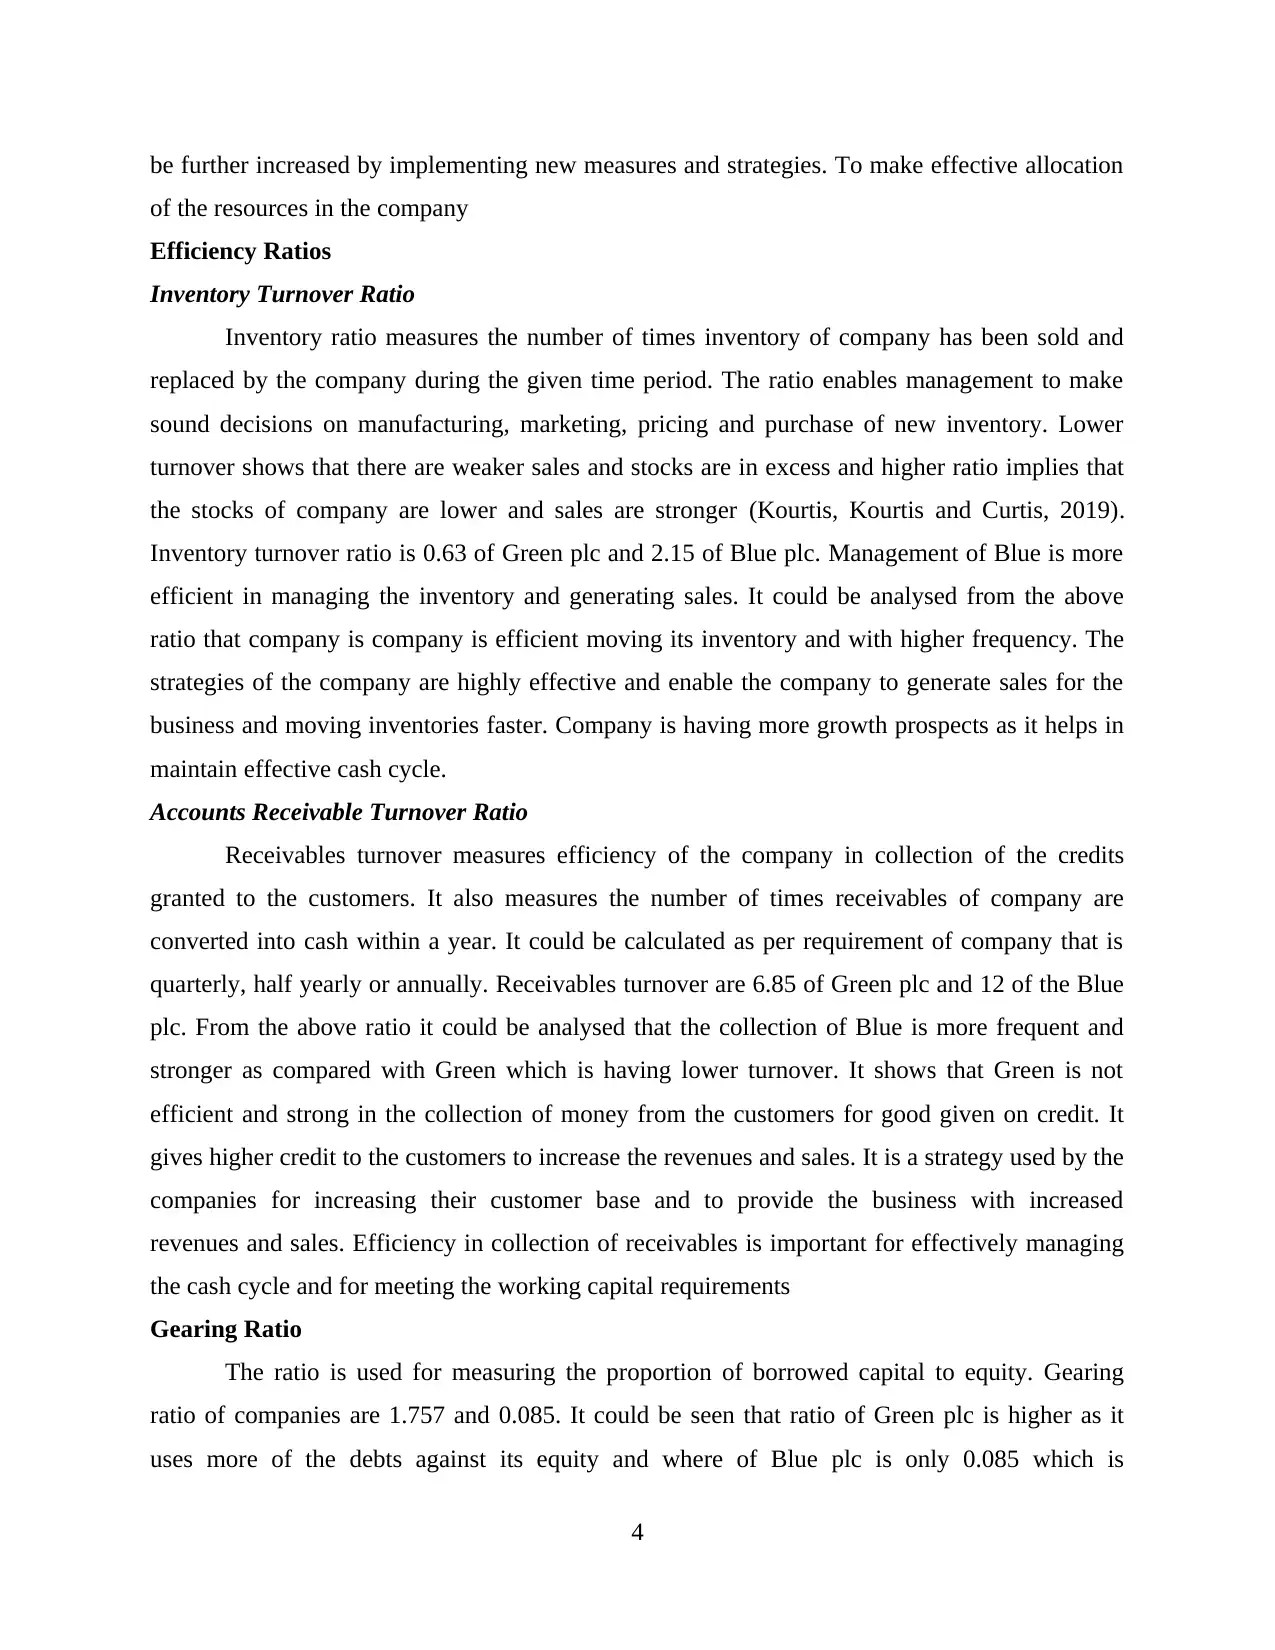
be further increased by implementing new measures and strategies. To make effective allocation
of the resources in the company
Efficiency Ratios
Inventory Turnover Ratio
Inventory ratio measures the number of times inventory of company has been sold and
replaced by the company during the given time period. The ratio enables management to make
sound decisions on manufacturing, marketing, pricing and purchase of new inventory. Lower
turnover shows that there are weaker sales and stocks are in excess and higher ratio implies that
the stocks of company are lower and sales are stronger (Kourtis, Kourtis and Curtis, 2019).
Inventory turnover ratio is 0.63 of Green plc and 2.15 of Blue plc. Management of Blue is more
efficient in managing the inventory and generating sales. It could be analysed from the above
ratio that company is company is efficient moving its inventory and with higher frequency. The
strategies of the company are highly effective and enable the company to generate sales for the
business and moving inventories faster. Company is having more growth prospects as it helps in
maintain effective cash cycle.
Accounts Receivable Turnover Ratio
Receivables turnover measures efficiency of the company in collection of the credits
granted to the customers. It also measures the number of times receivables of company are
converted into cash within a year. It could be calculated as per requirement of company that is
quarterly, half yearly or annually. Receivables turnover are 6.85 of Green plc and 12 of the Blue
plc. From the above ratio it could be analysed that the collection of Blue is more frequent and
stronger as compared with Green which is having lower turnover. It shows that Green is not
efficient and strong in the collection of money from the customers for good given on credit. It
gives higher credit to the customers to increase the revenues and sales. It is a strategy used by the
companies for increasing their customer base and to provide the business with increased
revenues and sales. Efficiency in collection of receivables is important for effectively managing
the cash cycle and for meeting the working capital requirements
Gearing Ratio
The ratio is used for measuring the proportion of borrowed capital to equity. Gearing
ratio of companies are 1.757 and 0.085. It could be seen that ratio of Green plc is higher as it
uses more of the debts against its equity and where of Blue plc is only 0.085 which is
4
⊘ This is a preview!⊘
Do you want full access?
Subscribe today to unlock all pages.
Trusted by 1+ million students worldwide
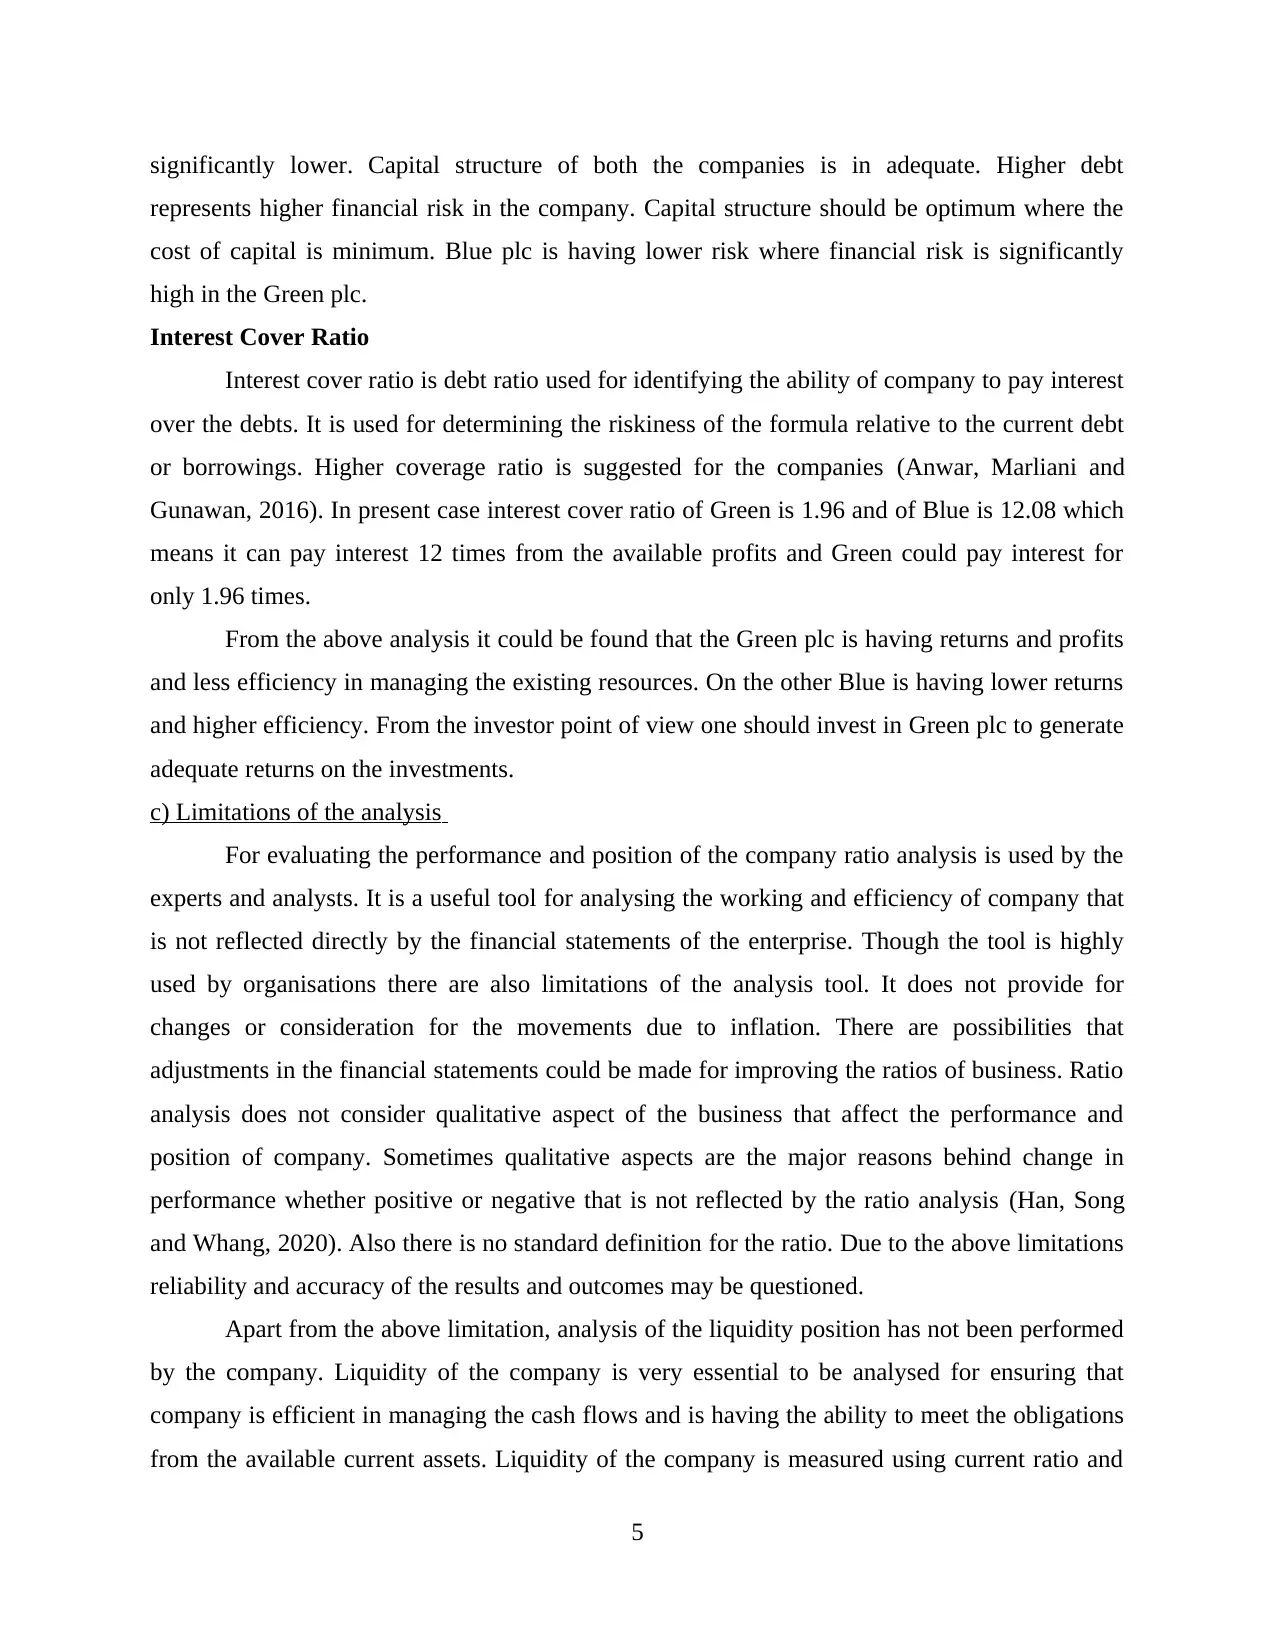
significantly lower. Capital structure of both the companies is in adequate. Higher debt
represents higher financial risk in the company. Capital structure should be optimum where the
cost of capital is minimum. Blue plc is having lower risk where financial risk is significantly
high in the Green plc.
Interest Cover Ratio
Interest cover ratio is debt ratio used for identifying the ability of company to pay interest
over the debts. It is used for determining the riskiness of the formula relative to the current debt
or borrowings. Higher coverage ratio is suggested for the companies (Anwar, Marliani and
Gunawan, 2016). In present case interest cover ratio of Green is 1.96 and of Blue is 12.08 which
means it can pay interest 12 times from the available profits and Green could pay interest for
only 1.96 times.
From the above analysis it could be found that the Green plc is having returns and profits
and less efficiency in managing the existing resources. On the other Blue is having lower returns
and higher efficiency. From the investor point of view one should invest in Green plc to generate
adequate returns on the investments.
c) Limitations of the analysis
For evaluating the performance and position of the company ratio analysis is used by the
experts and analysts. It is a useful tool for analysing the working and efficiency of company that
is not reflected directly by the financial statements of the enterprise. Though the tool is highly
used by organisations there are also limitations of the analysis tool. It does not provide for
changes or consideration for the movements due to inflation. There are possibilities that
adjustments in the financial statements could be made for improving the ratios of business. Ratio
analysis does not consider qualitative aspect of the business that affect the performance and
position of company. Sometimes qualitative aspects are the major reasons behind change in
performance whether positive or negative that is not reflected by the ratio analysis (Han, Song
and Whang, 2020). Also there is no standard definition for the ratio. Due to the above limitations
reliability and accuracy of the results and outcomes may be questioned.
Apart from the above limitation, analysis of the liquidity position has not been performed
by the company. Liquidity of the company is very essential to be analysed for ensuring that
company is efficient in managing the cash flows and is having the ability to meet the obligations
from the available current assets. Liquidity of the company is measured using current ratio and
5
Paraphrase This Document
Need a fresh take? Get an instant paraphrase of this document with our AI Paraphraser
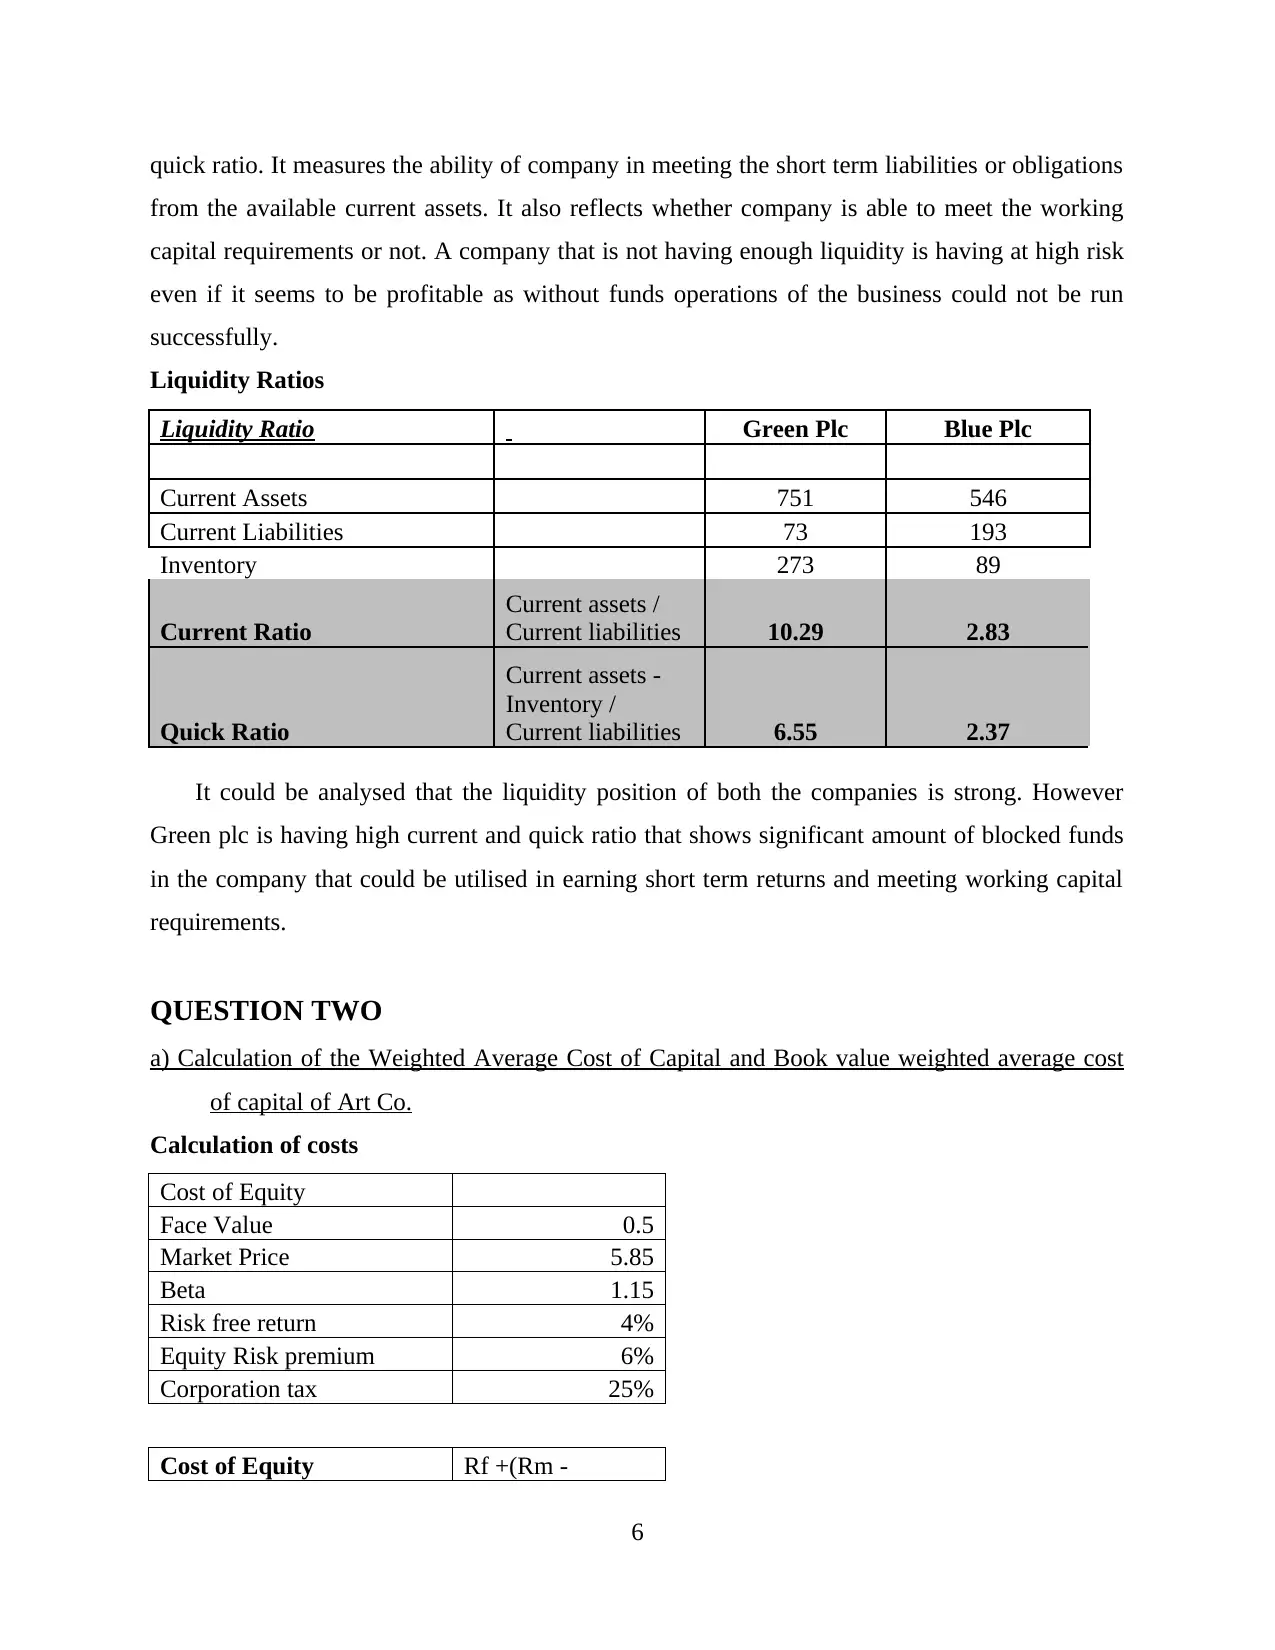
quick ratio. It measures the ability of company in meeting the short term liabilities or obligations
from the available current assets. It also reflects whether company is able to meet the working
capital requirements or not. A company that is not having enough liquidity is having at high risk
even if it seems to be profitable as without funds operations of the business could not be run
successfully.
Liquidity Ratios
Liquidity Ratio Green Plc Blue Plc
Current Assets 751 546
Current Liabilities 73 193
Inventory 273 89
Current Ratio
Current assets /
Current liabilities 10.29 2.83
Quick Ratio
Current assets -
Inventory /
Current liabilities 6.55 2.37
It could be analysed that the liquidity position of both the companies is strong. However
Green plc is having high current and quick ratio that shows significant amount of blocked funds
in the company that could be utilised in earning short term returns and meeting working capital
requirements.
QUESTION TWO
a) Calculation of the Weighted Average Cost of Capital and Book value weighted average cost
of capital of Art Co.
Calculation of costs
Cost of Equity
Face Value 0.5
Market Price 5.85
Beta 1.15
Risk free return 4%
Equity Risk premium 6%
Corporation tax 25%
Cost of Equity Rf +(Rm -
6
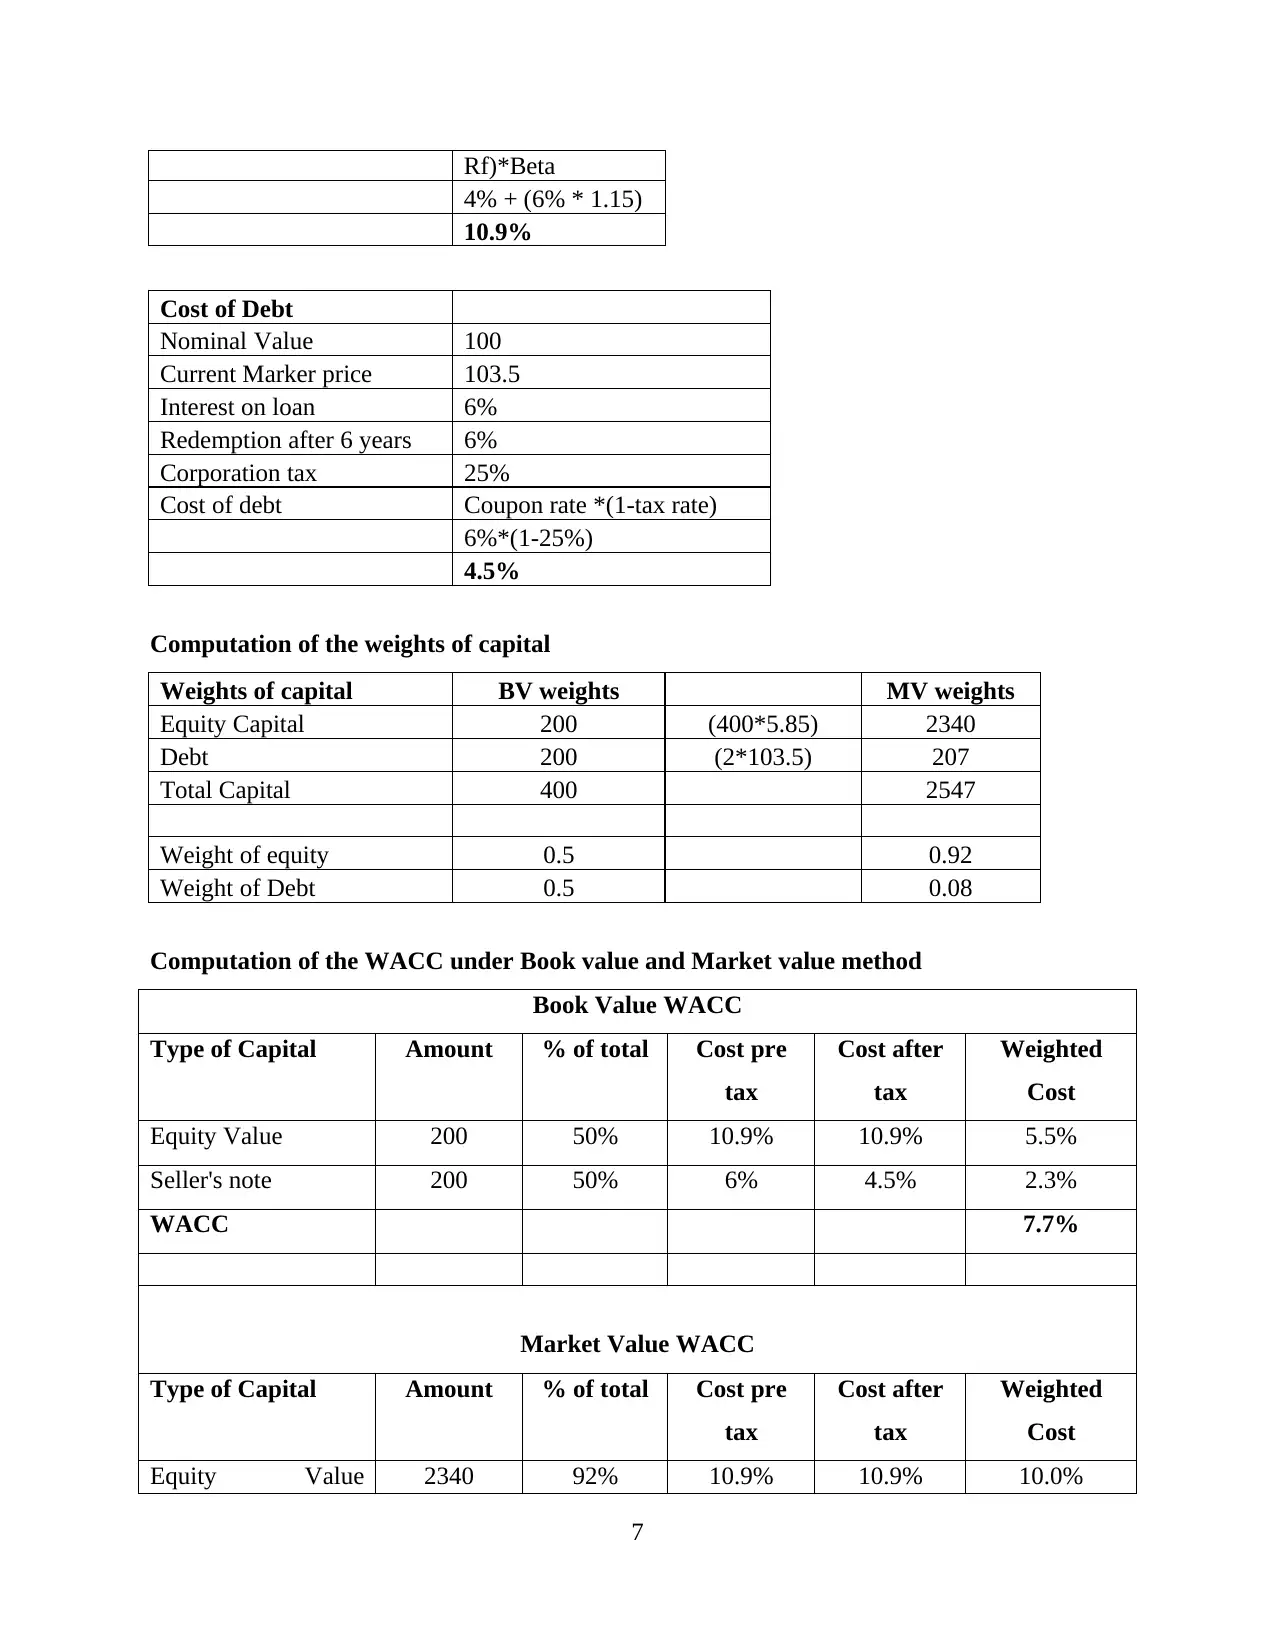
Rf)*Beta
4% + (6% * 1.15)
10.9%
Cost of Debt
Nominal Value 100
Current Marker price 103.5
Interest on loan 6%
Redemption after 6 years 6%
Corporation tax 25%
Cost of debt Coupon rate *(1-tax rate)
6%*(1-25%)
4.5%
Computation of the weights of capital
Weights of capital BV weights MV weights
Equity Capital 200 (400*5.85) 2340
Debt 200 (2*103.5) 207
Total Capital 400 2547
Weight of equity 0.5 0.92
Weight of Debt 0.5 0.08
Computation of the WACC under Book value and Market value method
Book Value WACC
Type of Capital Amount % of total Cost pre
tax
Cost after
tax
Weighted
Cost
Equity Value 200 50% 10.9% 10.9% 5.5%
Seller's note 200 50% 6% 4.5% 2.3%
WACC 7.7%
Market Value WACC
Type of Capital Amount % of total Cost pre
tax
Cost after
tax
Weighted
Cost
Equity Value 2340 92% 10.9% 10.9% 10.0%
7
⊘ This is a preview!⊘
Do you want full access?
Subscribe today to unlock all pages.
Trusted by 1+ million students worldwide

(400*5.85)
Seller's note
(2*103.5)
207 8% 6.0% 4.5% 0.4%
WACC 10.4%
It could be evaluated that the cost of capital is different in both the methods. Cost of
capital under book value weights is 7.7% and under market value is 10.4%. The difference
between the two is due to the weights of debt and equity under both the approaches. In book
value WACC weights are derived on the basis of nominal value of the equity and debt at which
they are booked in the financial statements of the company. On the other, in market value
WACC it could be seen that the weights are different as the value of equity and debt is
considered on the basis of market value. Market value are generally higher than the book values
that changes the proportion of debt and equity in terms of value thereby changing the whole cost
of capital. WACC of company under market value is considered as more appropriate and reliable
as it reflects the true cost of capital of company (Drobetz and et.al., 2018). Company is having
significant amount of equity capital as against the equity.
A company should have appropriate mix of the capital where cost of capital is least. As
per the book value capital structure is adequate whereas per market value it is having equity
capital.
b) Circumstances where the weighted average cost of capital of company could be used in the
investment appraisal techniques and limitations as discount rate.
Weighted average cost of capital is the weighted average debt, equity and preference
share cost and are weights are percentage of the capital sourced from every component in terms
of market value. WACC is mainly used by investors and management for prompt decision
making. Limitations of the method are its restricted scope of the application and rigid
assumptions to be taken for evaluating the projects.
The WACC could be used as discount rate in the investment appraisal if the risk of
investment project that is evaluated is equivalent or similar to current risk of investing firm.
WACC then will be reflecting and representing average rate of return as compensation for the
risks. It could be used for the investment appraisal if the business risks of proposed investments
8
Paraphrase This Document
Need a fresh take? Get an instant paraphrase of this document with our AI Paraphraser

are similar to business risks of the existing operations (Frank and Shen, 2016). It means that
WACC could be used for evaluating the expansion of the existing business.
If business risk of investment option is different from business risks of the existing
operations than the discount rates that are project specific reflecting business risks of investment
option are to be considered. Capital asset pricing model is also used by the analysts in the
investment appraisals where financial risks of proposed investment are same as financial risk of
the existing operations. It means that the financing for project to be raised in proportion that
could broadly preserve capital structure of investing company. If case is different than this the
investment appraisal technique known as adjusted present value is used. On the other CAPM
computed specific project cost of capital could be adjusted for reflecting financial risks of project
financing.
Third constraint over using the WACC in the investment appraisal is that proposed
investment option should be smaller as compared with size of company. If this was not case,
scale of investment project can cause changes to occur in perceived risk of investing company
making existing WACC inappropriate rate of discount.
Comparison with the other investments is based on time value of money linked to risk of
the future cash flows. WACC reflects risk to future cash flows that will be received by the
organisation from the operations. Company with lower WACC are seen as having lower risks
attached over the cash that will be generated in future. It is used as the discount rate as it is the
cost which company pays for capital that is used for investing in operations. a company is aimed
at achieving at least this much return from the proposed investments so that it could cover the
costs of raising the funds for project (El Ghou and et.al., 2018). If the company is not able to
achieve at least this return then the project is considered to be of high risk where company will
be suffering losses.
QUESTION THREE
Objectives of the working capital management and central role of working capital in financial
management
Working capital management refers to the business strategy which is designed for
ensuring that company is operating effectively by monitoring and by using the current assets and
liabilities in the best possible manner. Primary purpose of the working capital management is of
enabling company to have sufficient cash flows for meeting the short term operational costs and
9
the short term obligations (Afrifa and Padachi, 2016). Working capital of the company is derived
by deducting current liabilities from the current assets.
Primary objective of the working capital is to ensure that operating cycle of the business
is smooth. Secondary objective is of optimizing level of the working capital and minimising cost
of the funds. Major objective of the working capital in financial management is to help company
in wealth maximisation and it could be gained by the profit maximisation along with sustainable
development and growth of the business. Objectives of stakeholders should be aligned with
growth of organisation.
Objective of the working capital management is smooth flow of operating cycle. It
implies that operating cycle from acquisition of raw materials to conversion in cash is smooth. It
is a complex process. It requires that raw material is present on demand and does not lead to
interruptions in production. Sale of the finished goods should be made at the earliest.
Lowest working capital which refers current assets minus current liabilities. It aims at
having optimum working capital as higher capital will lead to increased interest cost and where
lower capital will lead to disturbance in the operating cycle.
Another objective if the working capital management is minimising cost of capital or the
interest costs. Costs that are used in the working capital are to be minimised for achieving higher
profitability. Sources where the cost is minimum should be used (Le, 2019). Costs are also
minimised using long term borrowings with proper mix.
Working capital management also involves monitoring the cash flows, current liabilities
and the current assets by ratio analysis. It is very essential for maintain smooth flow of the cash
conversion cycle. It ensures that company takes minimum time to convert the current assets and
liabilities to cash. It enables company to improve the profitability by efficient use of the
resources. It also includes inventory management ensuring that inventory is moving fast and
generating revenues for the business.
Role of working capital in financial management
Working capital is the part of total assets of company. It is difference between the current
assets as well as current liabilities. It is required for meeting day to day operations of the
business and it is essential that company is having enough funds for meeting the working capital
requirements. In financial management working capital refers to process of management of short
10
⊘ This is a preview!⊘
Do you want full access?
Subscribe today to unlock all pages.
Trusted by 1+ million students worldwide
1 out of 14
Related Documents


Your All-in-One AI-Powered Toolkit for Academic Success.
+13062052269
info@desklib.com
Available 24*7 on WhatsApp / Email
![[object Object]](/_next/static/media/star-bottom.7253800d.svg)
Unlock your academic potential
Copyright © 2020–2026 A2Z Services. All Rights Reserved. Developed and managed by ZUCOL.