International Financial Management (IFM) Assessment 2 Analysis
VerifiedAdded on 2022/12/15
|16
|3646
|434
Report
AI Summary
This report addresses key aspects of international financial management, focusing on investment decision-making processes. It begins by calculating the expected Net Present Value (NPV) and standard deviation of NPV for a project, evaluating potential returns and risks. The report then calculates and interprets NPV under optimistic, pessimistic, and base-case scenarios, incorporating probability analysis to assess the likelihood of different financial outcomes, including the risk of liquidation. Furthermore, the report delves into project appraisal, calculating the NPV for four distinct projects and ranking them based on their NPV. The report then provides a comparative analysis between the Net Present Value (NPV) and Internal Rate of Return (IRR) methods, highlighting the superiority of NPV in investment decision-making. The report concludes by providing a comparative analysis between the Net Present Value (NPV) and Internal Rate of Return (IRR) methods, highlighting the superiority of NPV in investment decision-making, and the allocation of funds for achieving optimum return.

INTERNATIONAL
FINANCIAL
MANAGEMENT(ASSESSM
ENT2)
FINANCIAL
MANAGEMENT(ASSESSM
ENT2)
Paraphrase This Document
Need a fresh take? Get an instant paraphrase of this document with our AI Paraphraser

Table of Contents
INTRODUCTION......................................................................................................................3
MAIN BODY.............................................................................................................................3
Question: 1.................................................................................................................................3
a) Expected NPV.................................................................................................................3
b) The standard deviation of NPV.........................................................................................4
Question: 2.................................................................................................................................6
Question: 3.................................................................................................................................8
a) Calculation of Net Present Value of four projects.............................................................8
b) Reasons regarding Net Present Value technique superior to internal rate of Return while
project appraisal...................................................................................................................10
c) Allocation of funds for achieving optimum return in terms of getting highest Net Present
Value....................................................................................................................................11
CONCLUSION........................................................................................................................14
REFERENCES.........................................................................................................................15
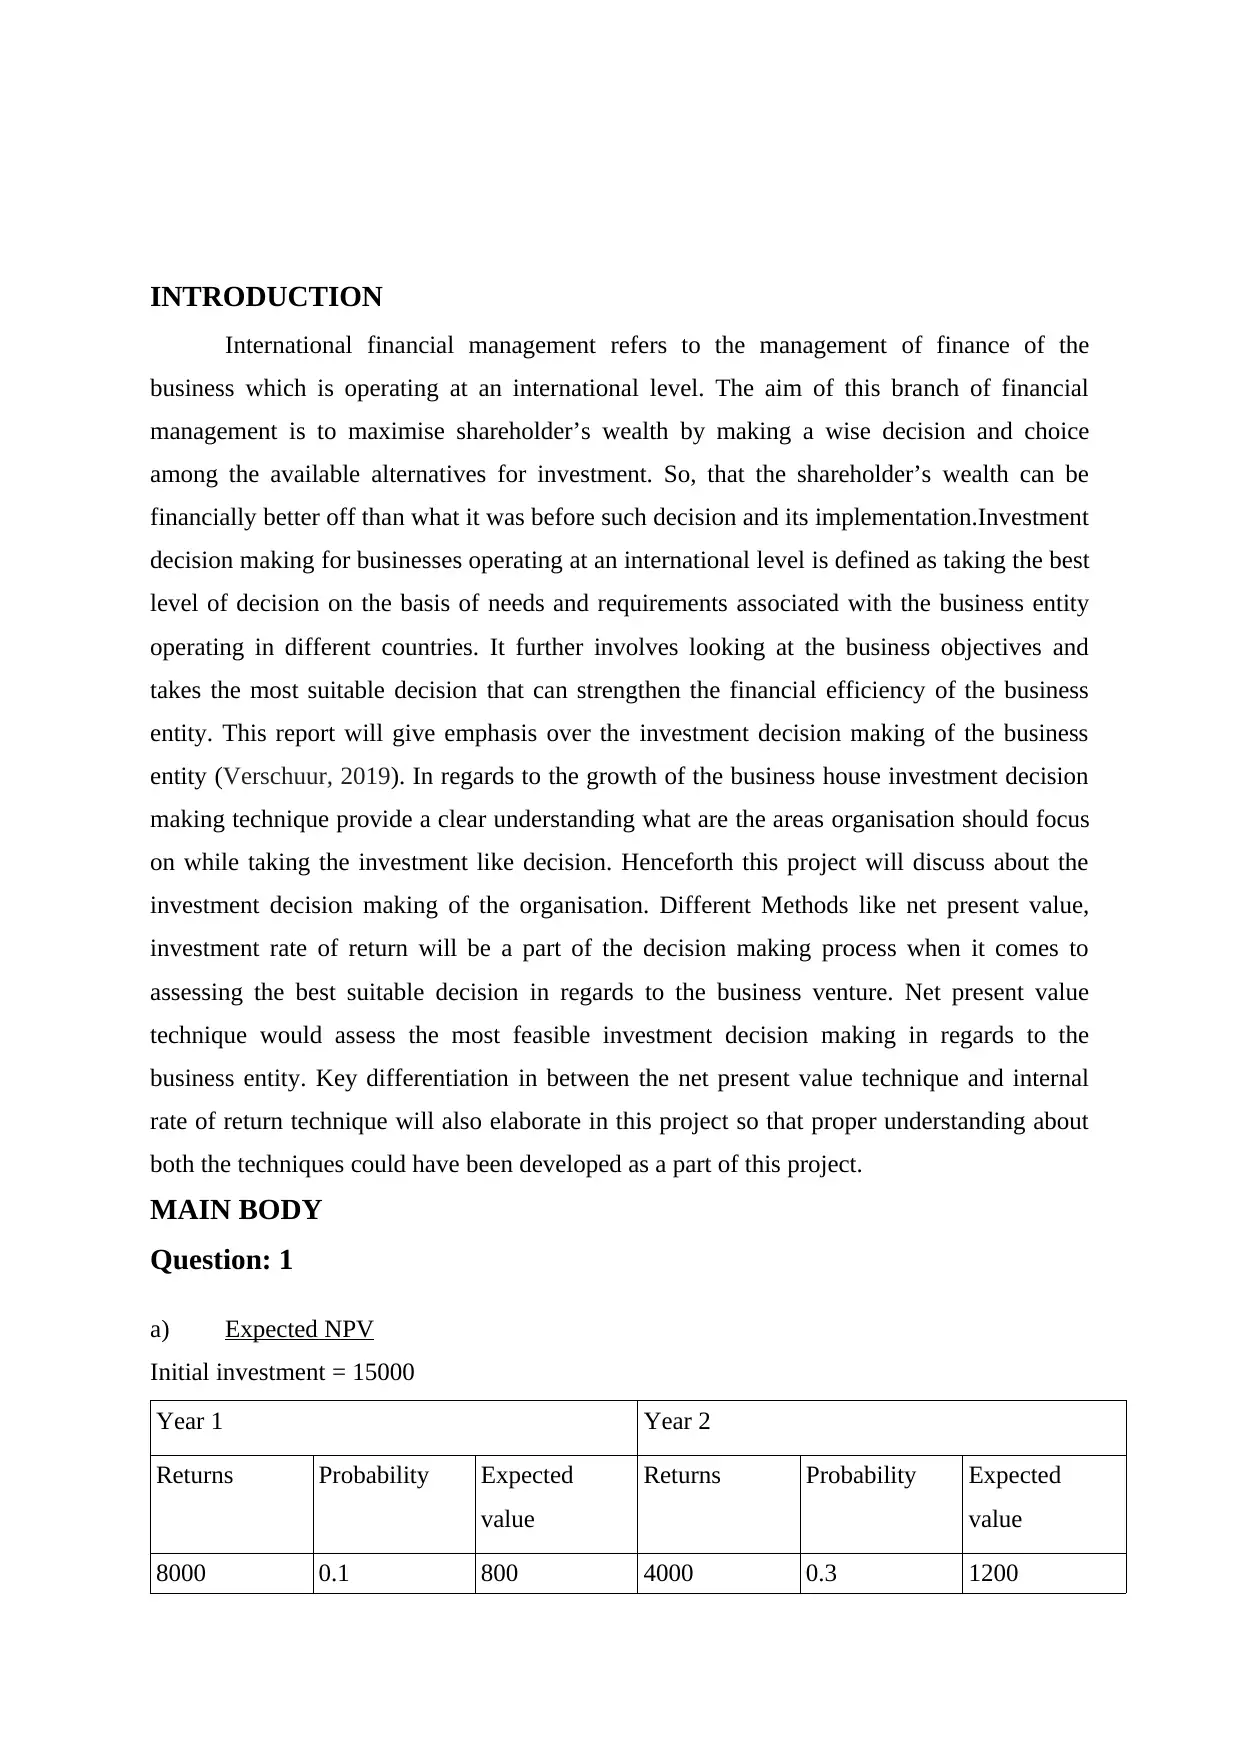
INTRODUCTION
International financial management refers to the management of finance of the
business which is operating at an international level. The aim of this branch of financial
management is to maximise shareholder’s wealth by making a wise decision and choice
among the available alternatives for investment. So, that the shareholder’s wealth can be
financially better off than what it was before such decision and its implementation.Investment
decision making for businesses operating at an international level is defined as taking the best
level of decision on the basis of needs and requirements associated with the business entity
operating in different countries. It further involves looking at the business objectives and
takes the most suitable decision that can strengthen the financial efficiency of the business
entity. This report will give emphasis over the investment decision making of the business
entity (Verschuur, 2019). In regards to the growth of the business house investment decision
making technique provide a clear understanding what are the areas organisation should focus
on while taking the investment like decision. Henceforth this project will discuss about the
investment decision making of the organisation. Different Methods like net present value,
investment rate of return will be a part of the decision making process when it comes to
assessing the best suitable decision in regards to the business venture. Net present value
technique would assess the most feasible investment decision making in regards to the
business entity. Key differentiation in between the net present value technique and internal
rate of return technique will also elaborate in this project so that proper understanding about
both the techniques could have been developed as a part of this project.
MAIN BODY
Question: 1
a) Expected NPV
Initial investment = 15000
Year 1 Year 2
Returns Probability Expected
value
Returns Probability Expected
value
8000 0.1 800 4000 0.3 1200
⊘ This is a preview!⊘
Do you want full access?
Subscribe today to unlock all pages.
Trusted by 1+ million students worldwide
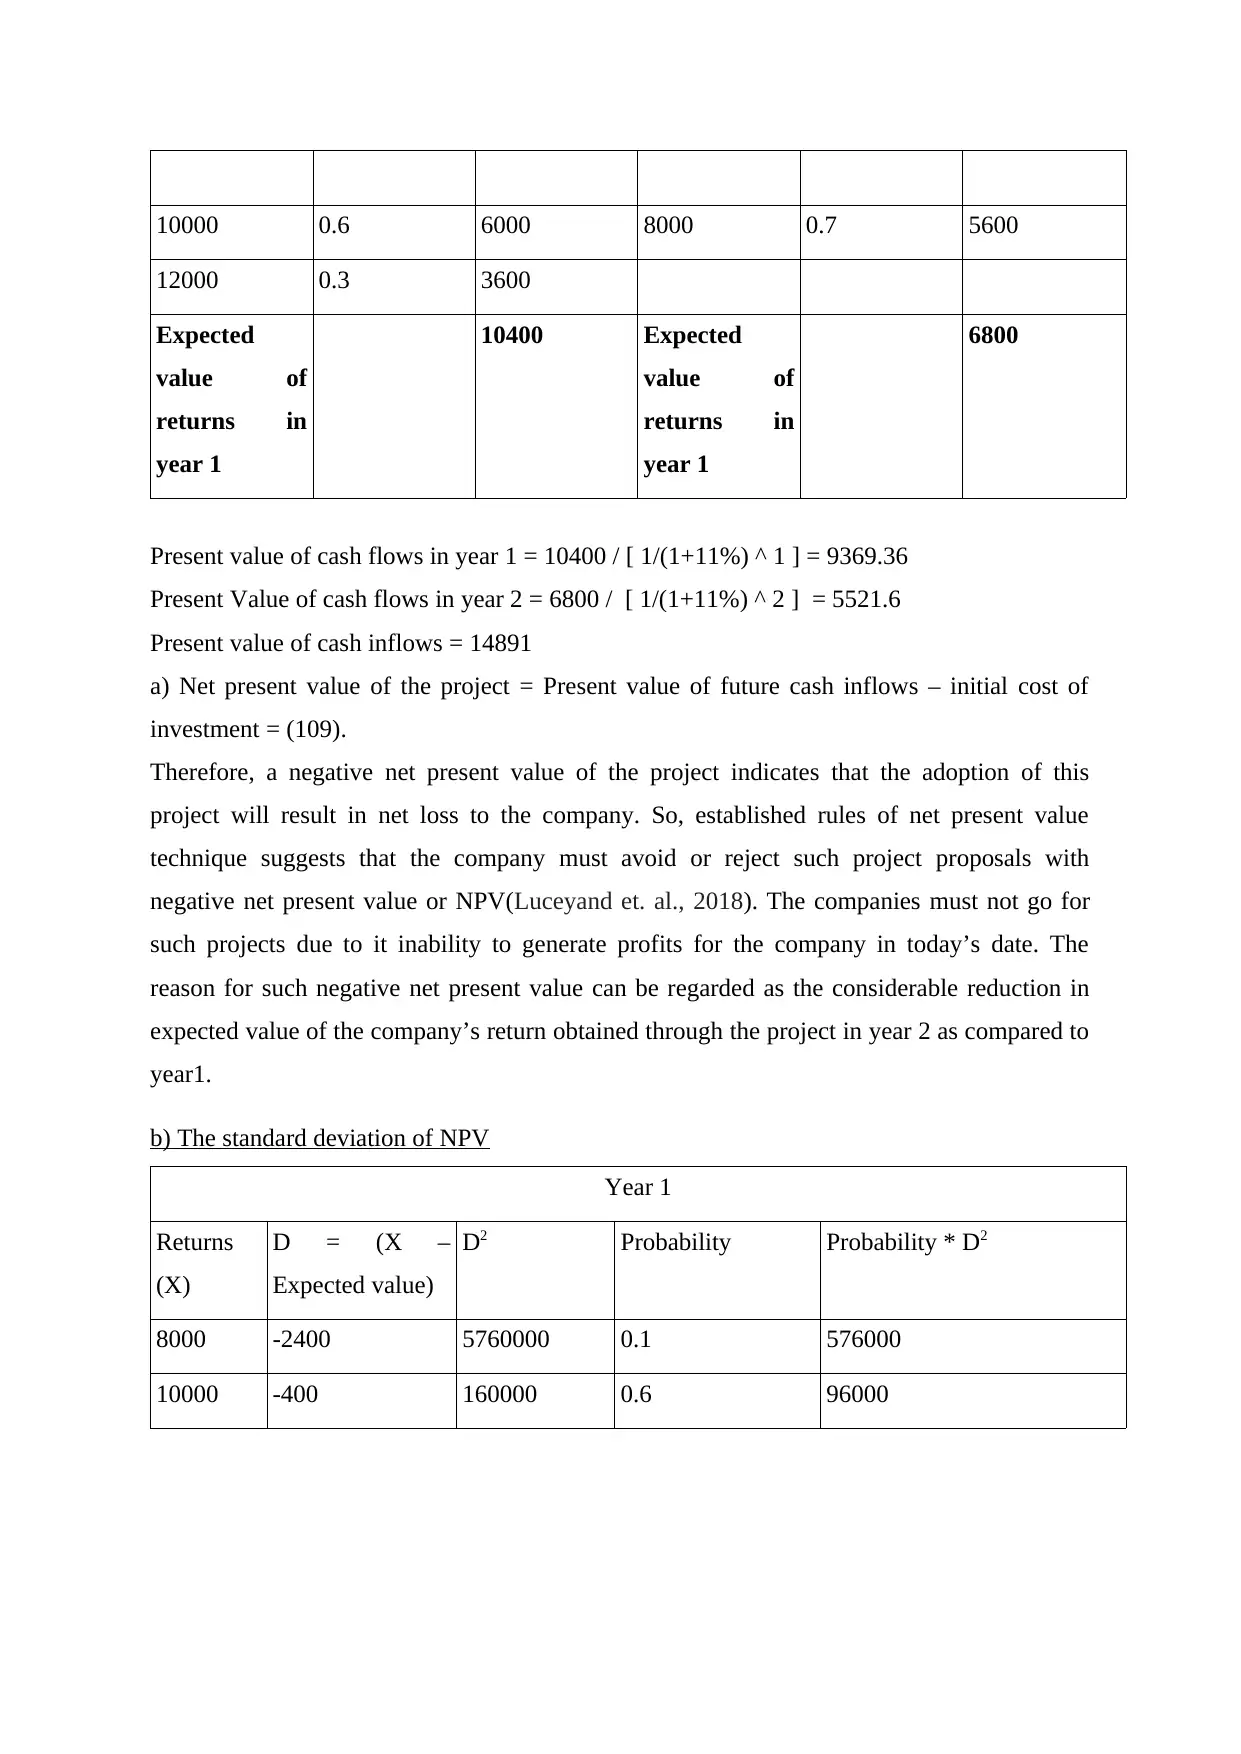
10000 0.6 6000 8000 0.7 5600
12000 0.3 3600
Expected
value of
returns in
year 1
10400 Expected
value of
returns in
year 1
6800
Present value of cash flows in year 1 = 10400 / [ 1/(1+11%) ^ 1 ] = 9369.36
Present Value of cash flows in year 2 = 6800 / [ 1/(1+11%) ^ 2 ] = 5521.6
Present value of cash inflows = 14891
a) Net present value of the project = Present value of future cash inflows – initial cost of
investment = (109).
Therefore, a negative net present value of the project indicates that the adoption of this
project will result in net loss to the company. So, established rules of net present value
technique suggests that the company must avoid or reject such project proposals with
negative net present value or NPV(Luceyand et. al., 2018). The companies must not go for
such projects due to it inability to generate profits for the company in today’s date. The
reason for such negative net present value can be regarded as the considerable reduction in
expected value of the company’s return obtained through the project in year 2 as compared to
year1.
b) The standard deviation of NPV
Year 1
Returns
(X)
D = (X –
Expected value)
D2 Probability Probability * D2
8000 -2400 5760000 0.1 576000
10000 -400 160000 0.6 96000
Paraphrase This Document
Need a fresh take? Get an instant paraphrase of this document with our AI Paraphraser

12000 1600 2560000 0.3 768000
Variance of returns in year 1 = σ2 1440000
Standard deviation of returns in year 1 = square root of variance σ2 = standard deviation σ =
1200.
By working upon different events of cash flows from the project in order to obtain deviation
between these cash flows in year 1, the value of standard deviation among the cash flows in
year 1 comes out to be 1200 (Lane and Milesi-Ferretti, 2017). This figure indicates that
different cash flows are deviating from the other by 1200 in year 1 of the project.
Year 2
Returns (X) D = (X –
Expected value)
D2 Probability Probability * D2
4000 -2800 7840000 0.3 2352000
8000 1200 1440000 0.7 1008000
Variance of returns in year 2 = σ2 3360000
Standard deviation of returns in year 2 = square root of σ2 = σ 1833
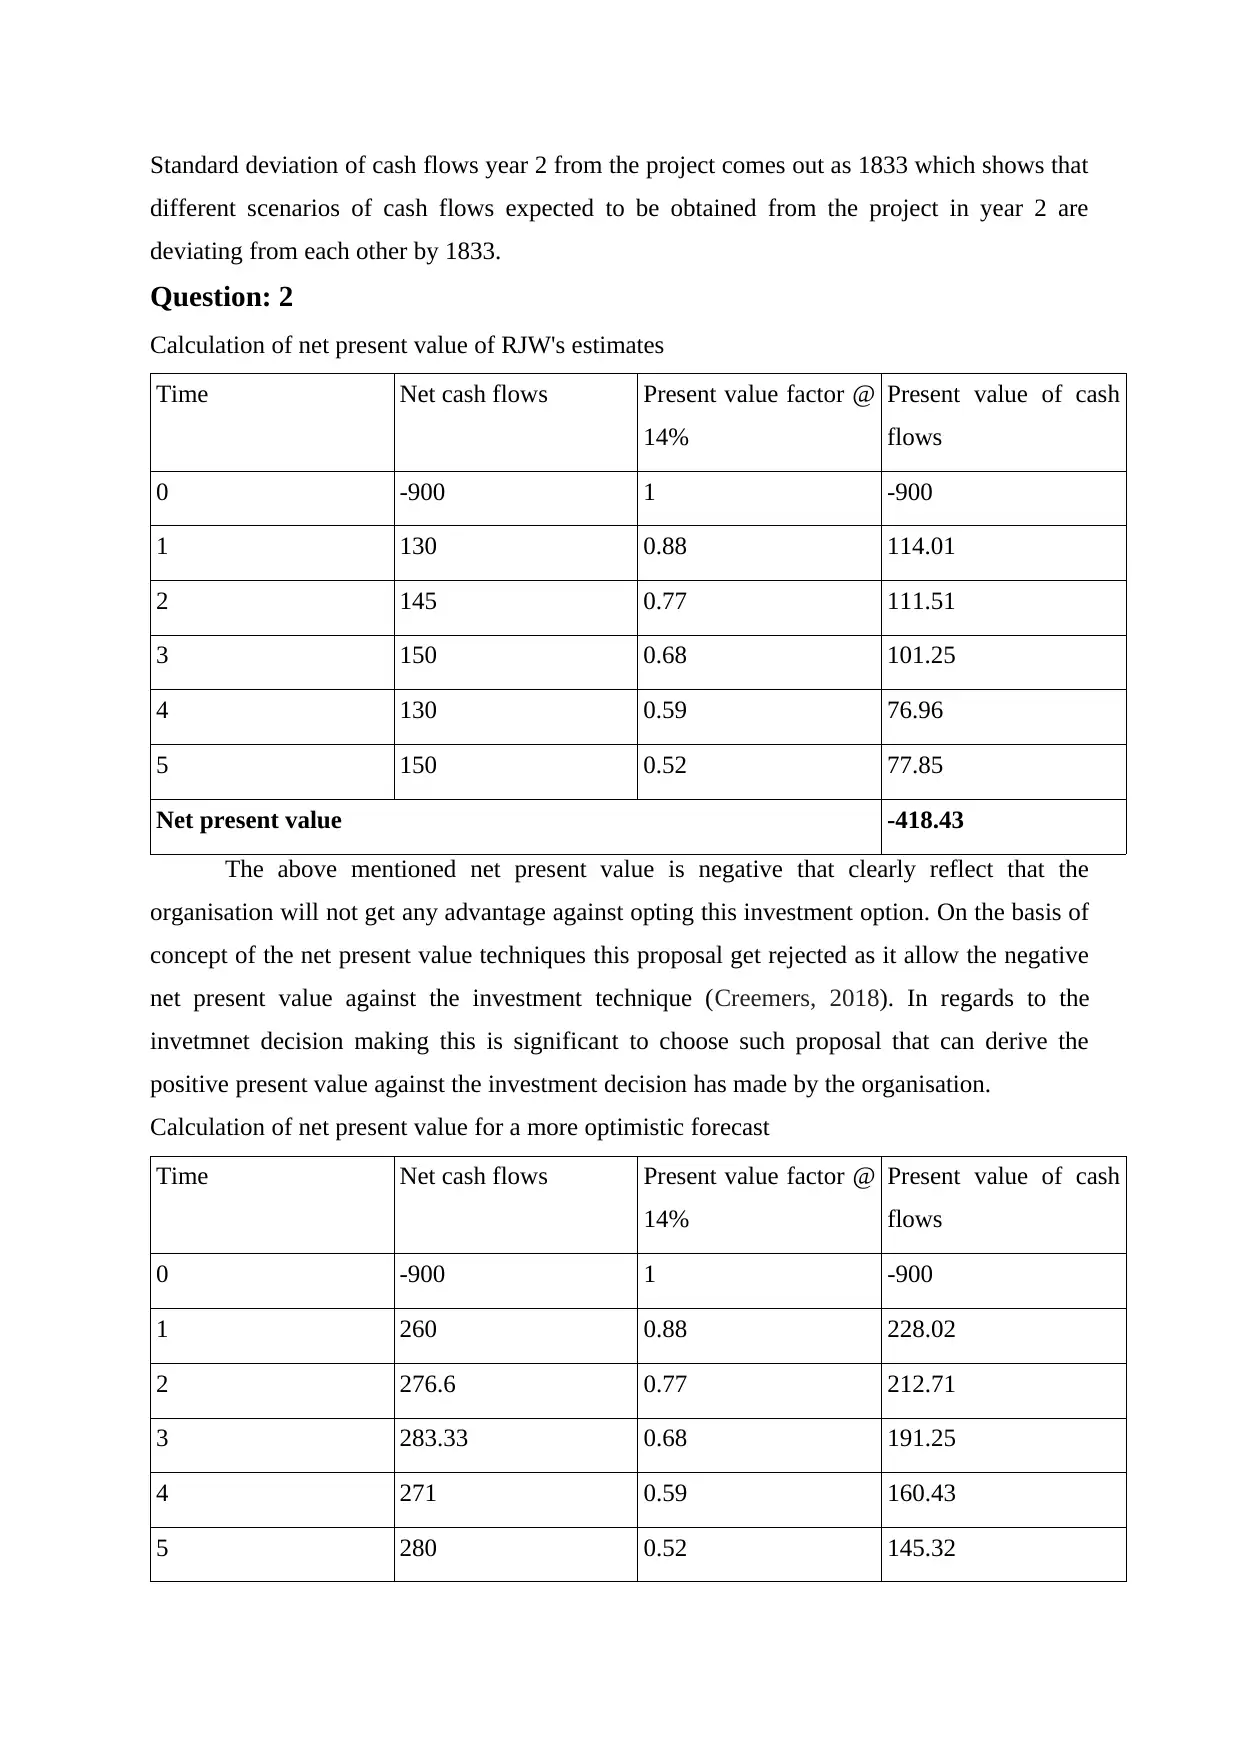
Standard deviation of cash flows year 2 from the project comes out as 1833 which shows that
different scenarios of cash flows expected to be obtained from the project in year 2 are
deviating from each other by 1833.
Question: 2
Calculation of net present value of RJW's estimates
Time Net cash flows Present value factor @
14%
Present value of cash
flows
0 -900 1 -900
1 130 0.88 114.01
2 145 0.77 111.51
3 150 0.68 101.25
4 130 0.59 76.96
5 150 0.52 77.85
Net present value -418.43
The above mentioned net present value is negative that clearly reflect that the
organisation will not get any advantage against opting this investment option. On the basis of
concept of the net present value techniques this proposal get rejected as it allow the negative
net present value against the investment technique (Creemers, 2018). In regards to the
invetmnet decision making this is significant to choose such proposal that can derive the
positive present value against the investment decision has made by the organisation.
Calculation of net present value for a more optimistic forecast
Time Net cash flows Present value factor @
14%
Present value of cash
flows
0 -900 1 -900
1 260 0.88 228.02
2 276.6 0.77 212.71
3 283.33 0.68 191.25
4 271 0.59 160.43
5 280 0.52 145.32
⊘ This is a preview!⊘
Do you want full access?
Subscribe today to unlock all pages.
Trusted by 1+ million students worldwide
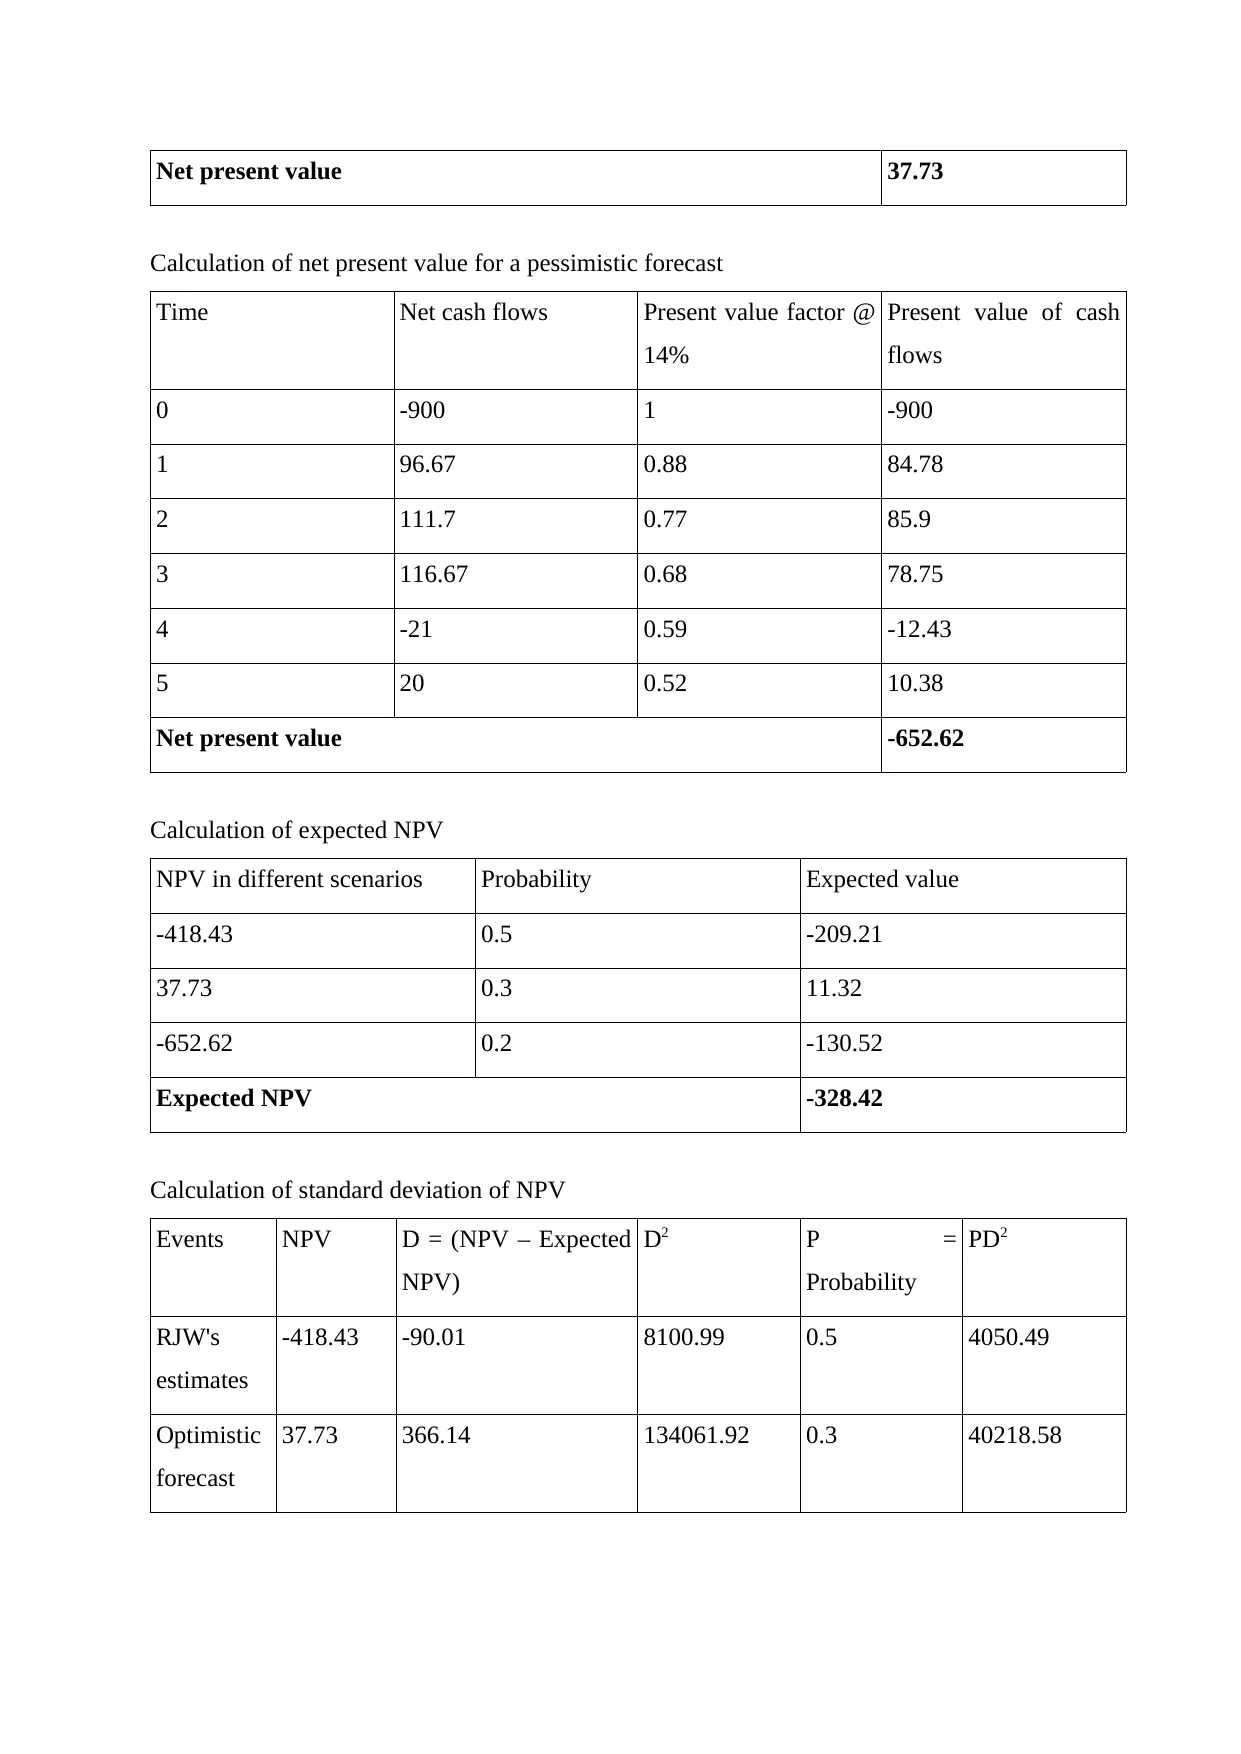
Net present value 37.73
Calculation of net present value for a pessimistic forecast
Time Net cash flows Present value factor @
14%
Present value of cash
flows
0 -900 1 -900
1 96.67 0.88 84.78
2 111.7 0.77 85.9
3 116.67 0.68 78.75
4 -21 0.59 -12.43
5 20 0.52 10.38
Net present value -652.62
Calculation of expected NPV
NPV in different scenarios Probability Expected value
-418.43 0.5 -209.21
37.73 0.3 11.32
-652.62 0.2 -130.52
Expected NPV -328.42
Calculation of standard deviation of NPV
Events NPV D = (NPV – Expected
NPV)
D2 P =
Probability
PD2
RJW's
estimates
-418.43 -90.01 8100.99 0.5 4050.49
Optimistic
forecast
37.73 366.14 134061.92 0.3 40218.58
Paraphrase This Document
Need a fresh take? Get an instant paraphrase of this document with our AI Paraphraser
Pessimistic
forecast
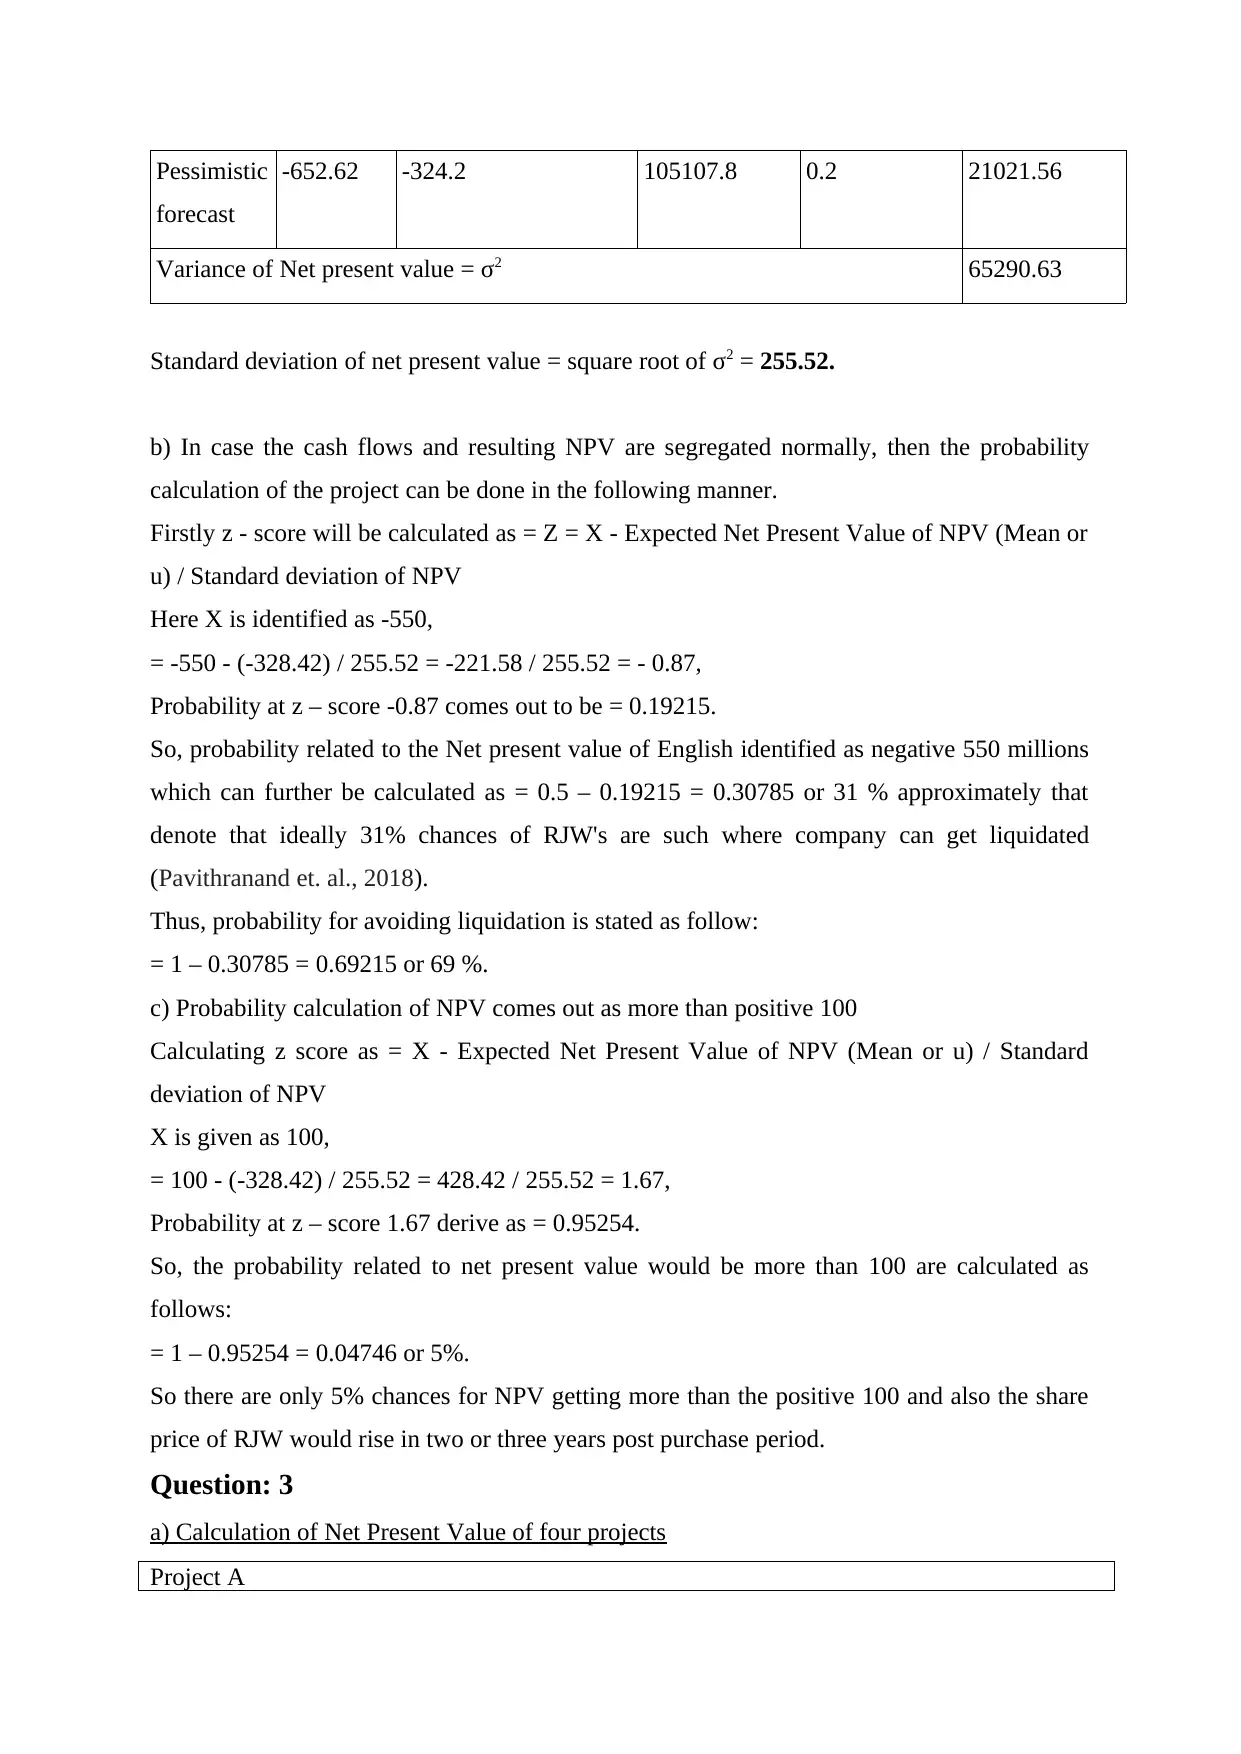
-652.62 -324.2 105107.8 0.2 21021.56
Variance of Net present value = σ2 65290.63
Standard deviation of net present value = square root of σ2 = 255.52.
b) In case the cash flows and resulting NPV are segregated normally, then the probability
calculation of the project can be done in the following manner.
Firstly z - score will be calculated as = Z = X - Expected Net Present Value of NPV (Mean or
u) / Standard deviation of NPV
Here X is identified as -550,
= -550 - (-328.42) / 255.52 = -221.58 / 255.52 = - 0.87,
Probability at z – score -0.87 comes out to be = 0.19215.
So, probability related to the Net present value of English identified as negative 550 millions
which can further be calculated as = 0.5 – 0.19215 = 0.30785 or 31 % approximately that
denote that ideally 31% chances of RJW's are such where company can get liquidated
(Pavithranand et. al., 2018).
Thus, probability for avoiding liquidation is stated as follow:
= 1 – 0.30785 = 0.69215 or 69 %.
c) Probability calculation of NPV comes out as more than positive 100
Calculating z score as = X - Expected Net Present Value of NPV (Mean or u) / Standard
deviation of NPV
X is given as 100,
= 100 - (-328.42) / 255.52 = 428.42 / 255.52 = 1.67,
Probability at z – score 1.67 derive as = 0.95254.
So, the probability related to net present value would be more than 100 are calculated as
follows:
= 1 – 0.95254 = 0.04746 or 5%.
So there are only 5% chances for NPV getting more than the positive 100 and also the share
price of RJW would rise in two or three years post purchase period.
Question: 3
a) Calculation of Net Present Value of four projects
Project A
forecast
-652.62 -324.2 105107.8 0.2 21021.56
Variance of Net present value = σ2 65290.63
Standard deviation of net present value = square root of σ2 = 255.52.
b) In case the cash flows and resulting NPV are segregated normally, then the probability
calculation of the project can be done in the following manner.
Firstly z - score will be calculated as = Z = X - Expected Net Present Value of NPV (Mean or
u) / Standard deviation of NPV
Here X is identified as -550,
= -550 - (-328.42) / 255.52 = -221.58 / 255.52 = - 0.87,
Probability at z – score -0.87 comes out to be = 0.19215.
So, probability related to the Net present value of English identified as negative 550 millions
which can further be calculated as = 0.5 – 0.19215 = 0.30785 or 31 % approximately that
denote that ideally 31% chances of RJW's are such where company can get liquidated
(Pavithranand et. al., 2018).
Thus, probability for avoiding liquidation is stated as follow:
= 1 – 0.30785 = 0.69215 or 69 %.
c) Probability calculation of NPV comes out as more than positive 100
Calculating z score as = X - Expected Net Present Value of NPV (Mean or u) / Standard
deviation of NPV
X is given as 100,
= 100 - (-328.42) / 255.52 = 428.42 / 255.52 = 1.67,
Probability at z – score 1.67 derive as = 0.95254.
So, the probability related to net present value would be more than 100 are calculated as
follows:
= 1 – 0.95254 = 0.04746 or 5%.
So there are only 5% chances for NPV getting more than the positive 100 and also the share
price of RJW would rise in two or three years post purchase period.
Question: 3
a) Calculation of Net Present Value of four projects
Project A

Time in year Cash flows Present value factor
@ 10%
Present value of cash
flows
0 -500000 1 -500000
1 600000 0.909 545400
Net present value of cash flows from project A 45400
Project B
0 -200000 1 -200000
1 200000 0.909 181800
2 150000 0.826 123900
Net present value of cash flows from project B 105700
Project C
0 -700000 1 -700000
1 0 0.909 0
2 1000000 0.826 826000
Net present value of cash flows from project C 126000
Project D
0 -150000 1 -150000
1 60000 0.909 54540
2 60000 0.826 49560
3 60000 0.751 45060
4 60000 0.683 40980
Net present value of cash flows from project D 40140
Ranking projects on the basis of calculated NPVs
Projects NPV Rank
A 45400 3
B 105700 2
C 126000 1
D 40140 4
⊘ This is a preview!⊘
Do you want full access?
Subscribe today to unlock all pages.
Trusted by 1+ million students worldwide
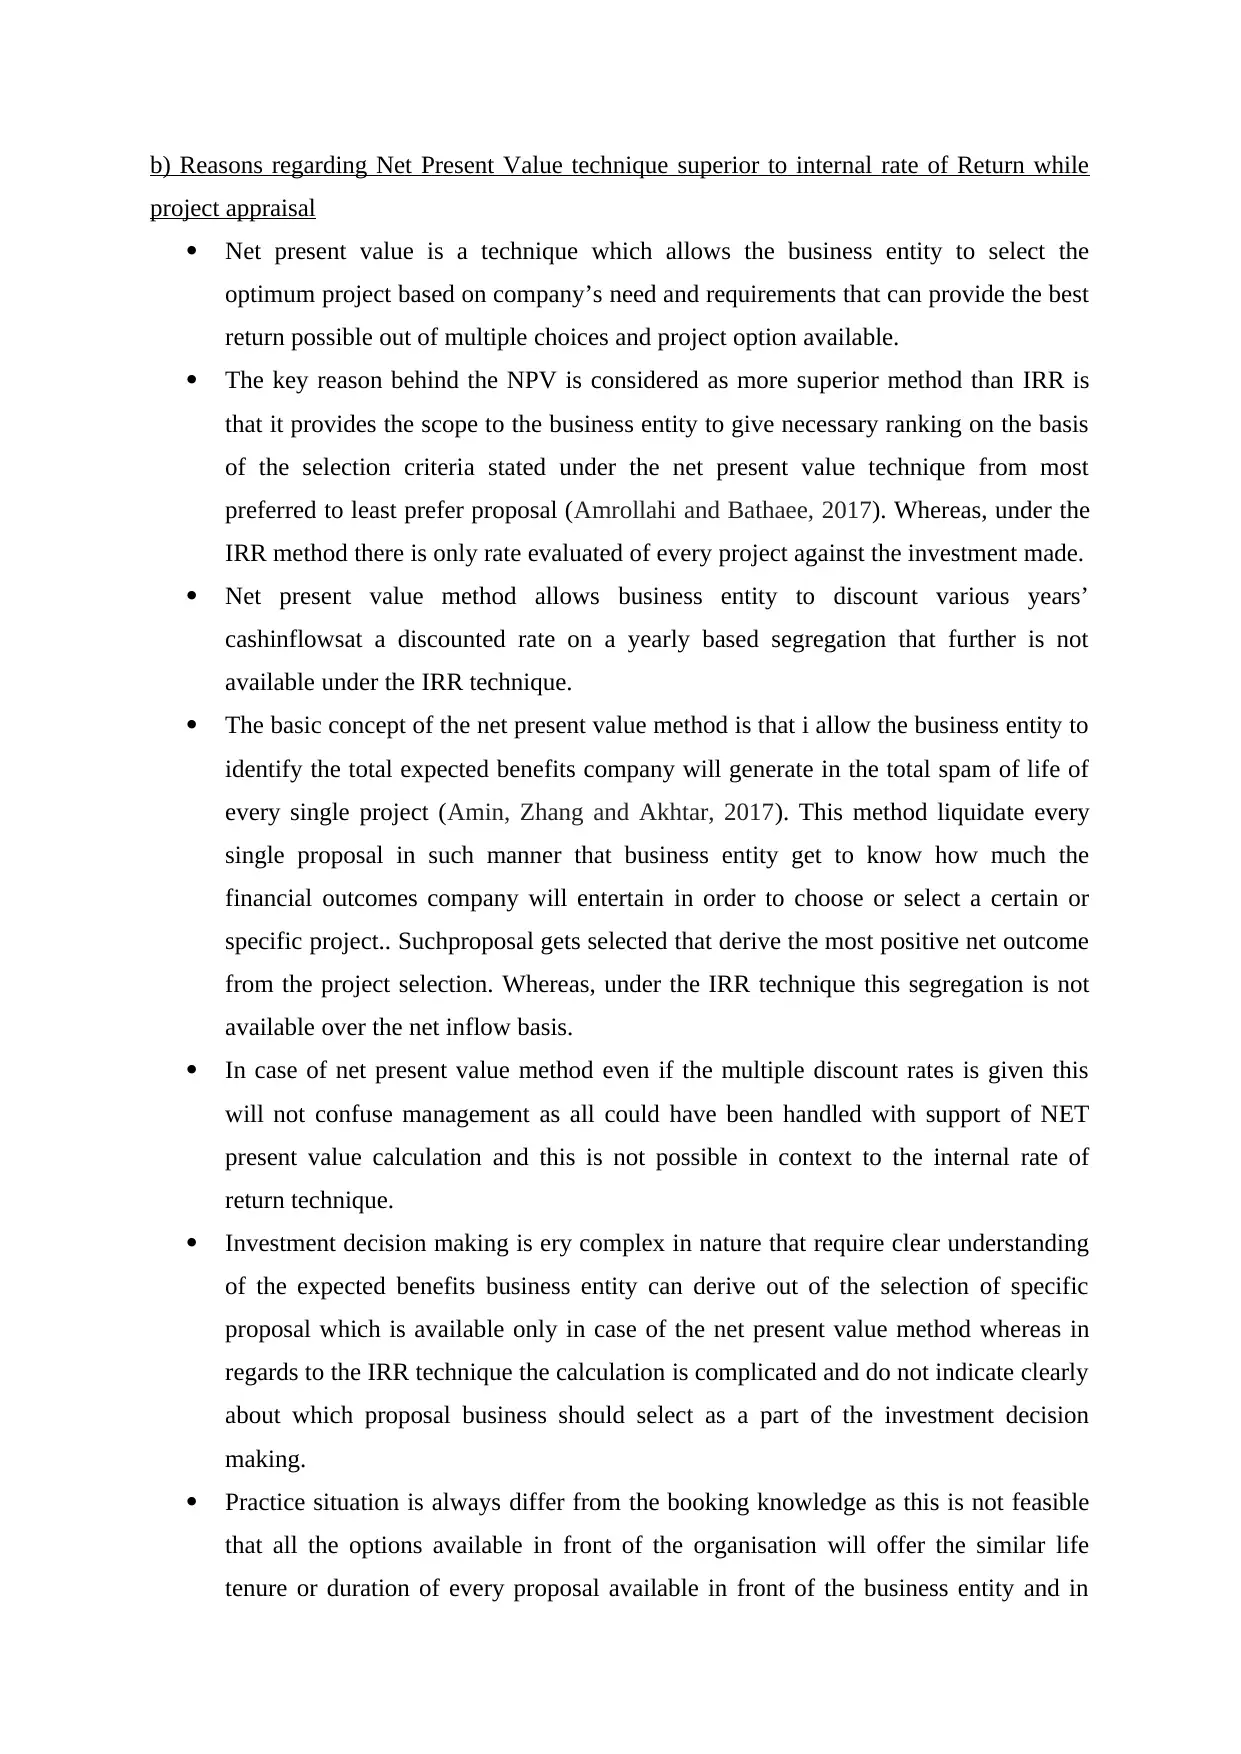
b) Reasons regarding Net Present Value technique superior to internal rate of Return while
project appraisal
Net present value is a technique which allows the business entity to select the
optimum project based on company’s need and requirements that can provide the best
return possible out of multiple choices and project option available.
The key reason behind the NPV is considered as more superior method than IRR is
that it provides the scope to the business entity to give necessary ranking on the basis
of the selection criteria stated under the net present value technique from most
preferred to least prefer proposal (Amrollahi and Bathaee, 2017). Whereas, under the
IRR method there is only rate evaluated of every project against the investment made.
Net present value method allows business entity to discount various years’
cashinflowsat a discounted rate on a yearly based segregation that further is not
available under the IRR technique.
The basic concept of the net present value method is that i allow the business entity to
identify the total expected benefits company will generate in the total spam of life of
every single project (Amin, Zhang and Akhtar, 2017). This method liquidate every
single proposal in such manner that business entity get to know how much the
financial outcomes company will entertain in order to choose or select a certain or
specific project.. Suchproposal gets selected that derive the most positive net outcome
from the project selection. Whereas, under the IRR technique this segregation is not
available over the net inflow basis.
In case of net present value method even if the multiple discount rates is given this
will not confuse management as all could have been handled with support of NET
present value calculation and this is not possible in context to the internal rate of
return technique.
Investment decision making is ery complex in nature that require clear understanding
of the expected benefits business entity can derive out of the selection of specific
proposal which is available only in case of the net present value method whereas in
regards to the IRR technique the calculation is complicated and do not indicate clearly
about which proposal business should select as a part of the investment decision
making.
Practice situation is always differ from the booking knowledge as this is not feasible
that all the options available in front of the organisation will offer the similar life
tenure or duration of every proposal available in front of the business entity and in
Paraphrase This Document
Need a fresh take? Get an instant paraphrase of this document with our AI Paraphraser
such a situation Net present value method look more feasible to make the investment
decision as compare to the IRR technique (Knoke, Gosling and Paul, 2020).
The preference of majority of investor banker is towards the net present value
technique is appreciated due to the end result of the technique. Net present value
method derive the total expected benefit out of the project selected in the life time of
the project whereas, in context to the IRR method breakeven point in relation to every
proposal is derived as a end result that do not allow the clear understanding in regards
to the profitability of every single proposal available (Egwunatum and Akpokodje,
2019).
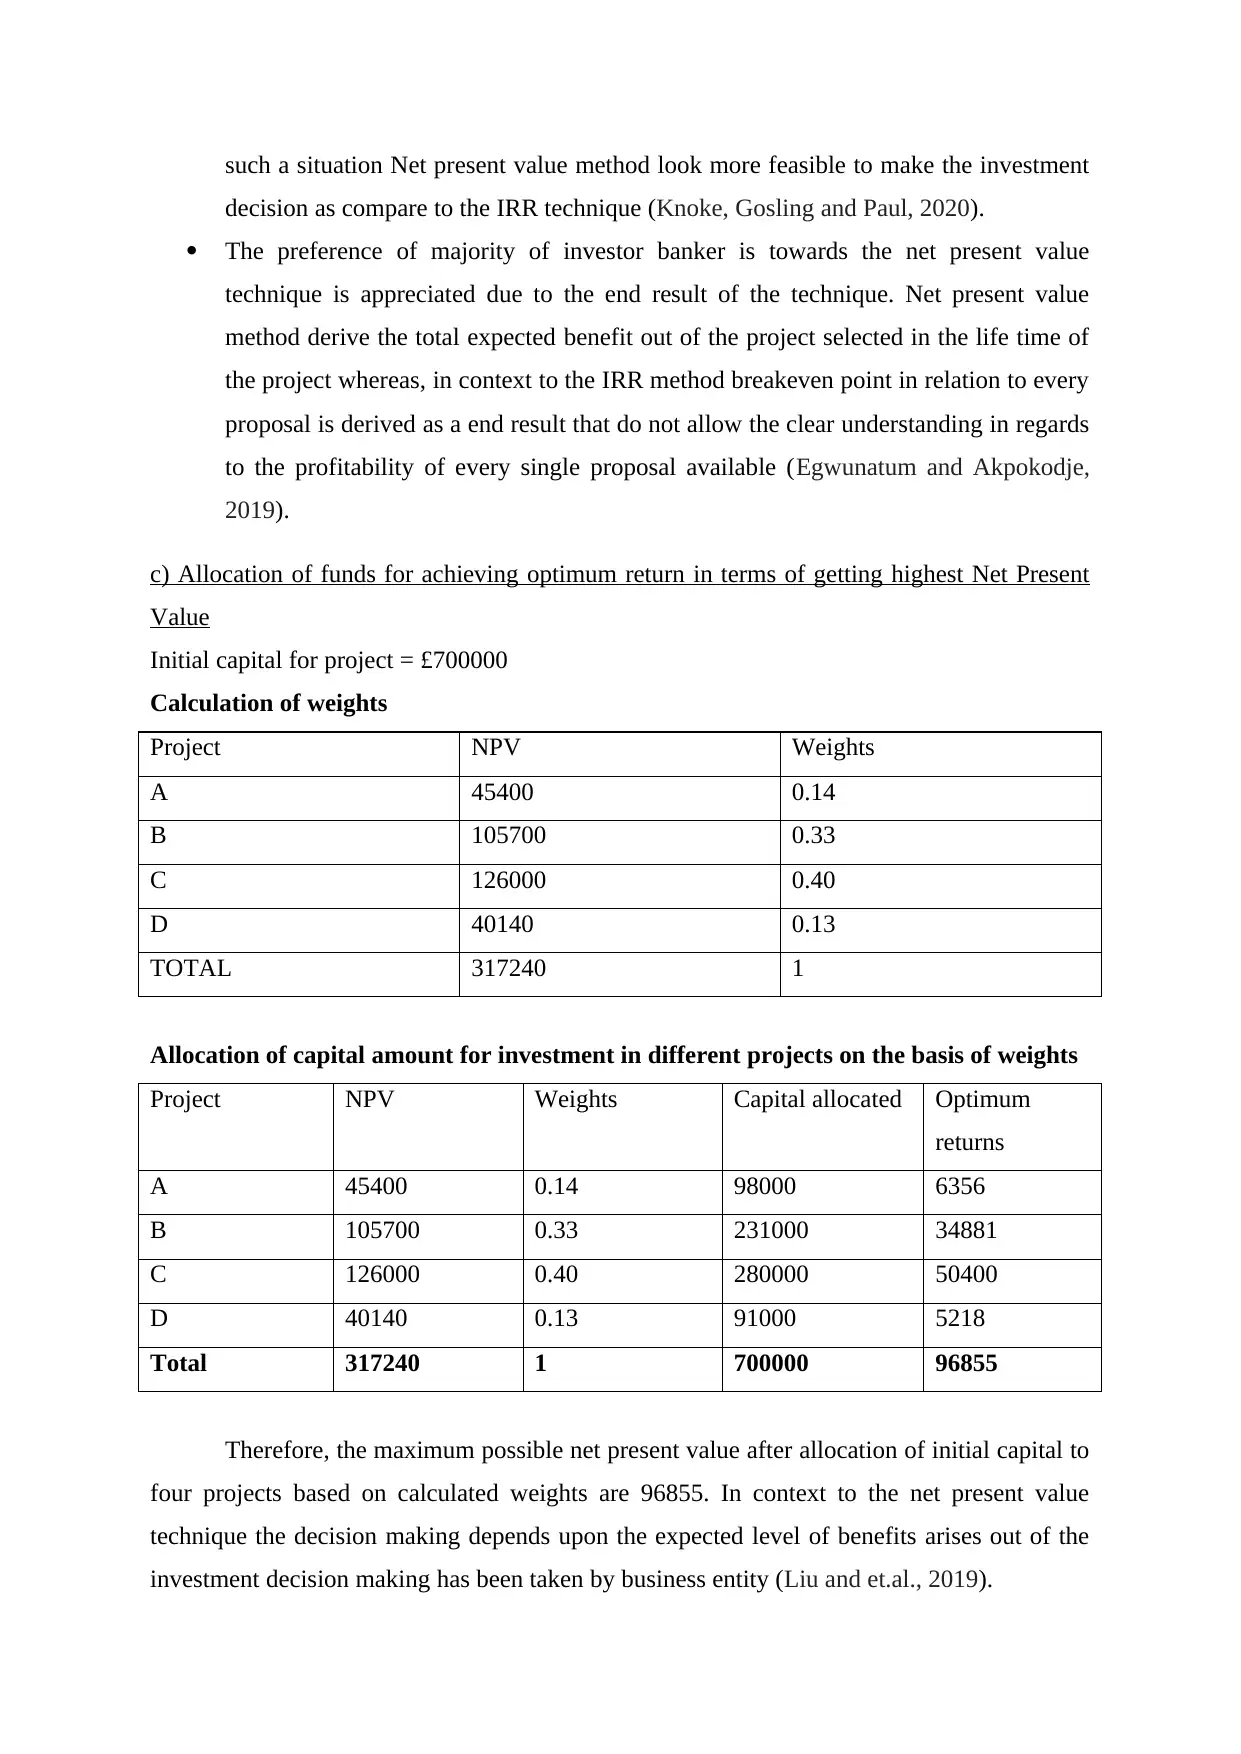
c) Allocation of funds for achieving optimum return in terms of getting highest Net Present
Value
Initial capital for project = £700000
Calculation of weights
Project NPV Weights
A 45400 0.14
B 105700 0.33
C 126000 0.40
D 40140 0.13
TOTAL 317240 1
Allocation of capital amount for investment in different projects on the basis of weights
Project NPV Weights Capital allocated Optimum
returns
A 45400 0.14 98000 6356
B 105700 0.33 231000 34881
C 126000 0.40 280000 50400
D 40140 0.13 91000 5218
Total 317240 1 700000 96855
Therefore, the maximum possible net present value after allocation of initial capital to
four projects based on calculated weights are 96855. In context to the net present value
technique the decision making depends upon the expected level of benefits arises out of the
investment decision making has been taken by business entity (Liu and et.al., 2019).
decision as compare to the IRR technique (Knoke, Gosling and Paul, 2020).
The preference of majority of investor banker is towards the net present value
technique is appreciated due to the end result of the technique. Net present value
method derive the total expected benefit out of the project selected in the life time of
the project whereas, in context to the IRR method breakeven point in relation to every
proposal is derived as a end result that do not allow the clear understanding in regards
to the profitability of every single proposal available (Egwunatum and Akpokodje,
2019).
c) Allocation of funds for achieving optimum return in terms of getting highest Net Present
Value
Initial capital for project = £700000
Calculation of weights
Project NPV Weights
A 45400 0.14
B 105700 0.33
C 126000 0.40
D 40140 0.13
TOTAL 317240 1
Allocation of capital amount for investment in different projects on the basis of weights
Project NPV Weights Capital allocated Optimum
returns
A 45400 0.14 98000 6356
B 105700 0.33 231000 34881
C 126000 0.40 280000 50400
D 40140 0.13 91000 5218
Total 317240 1 700000 96855
Therefore, the maximum possible net present value after allocation of initial capital to
four projects based on calculated weights are 96855. In context to the net present value
technique the decision making depends upon the expected level of benefits arises out of the
investment decision making has been taken by business entity (Liu and et.al., 2019).
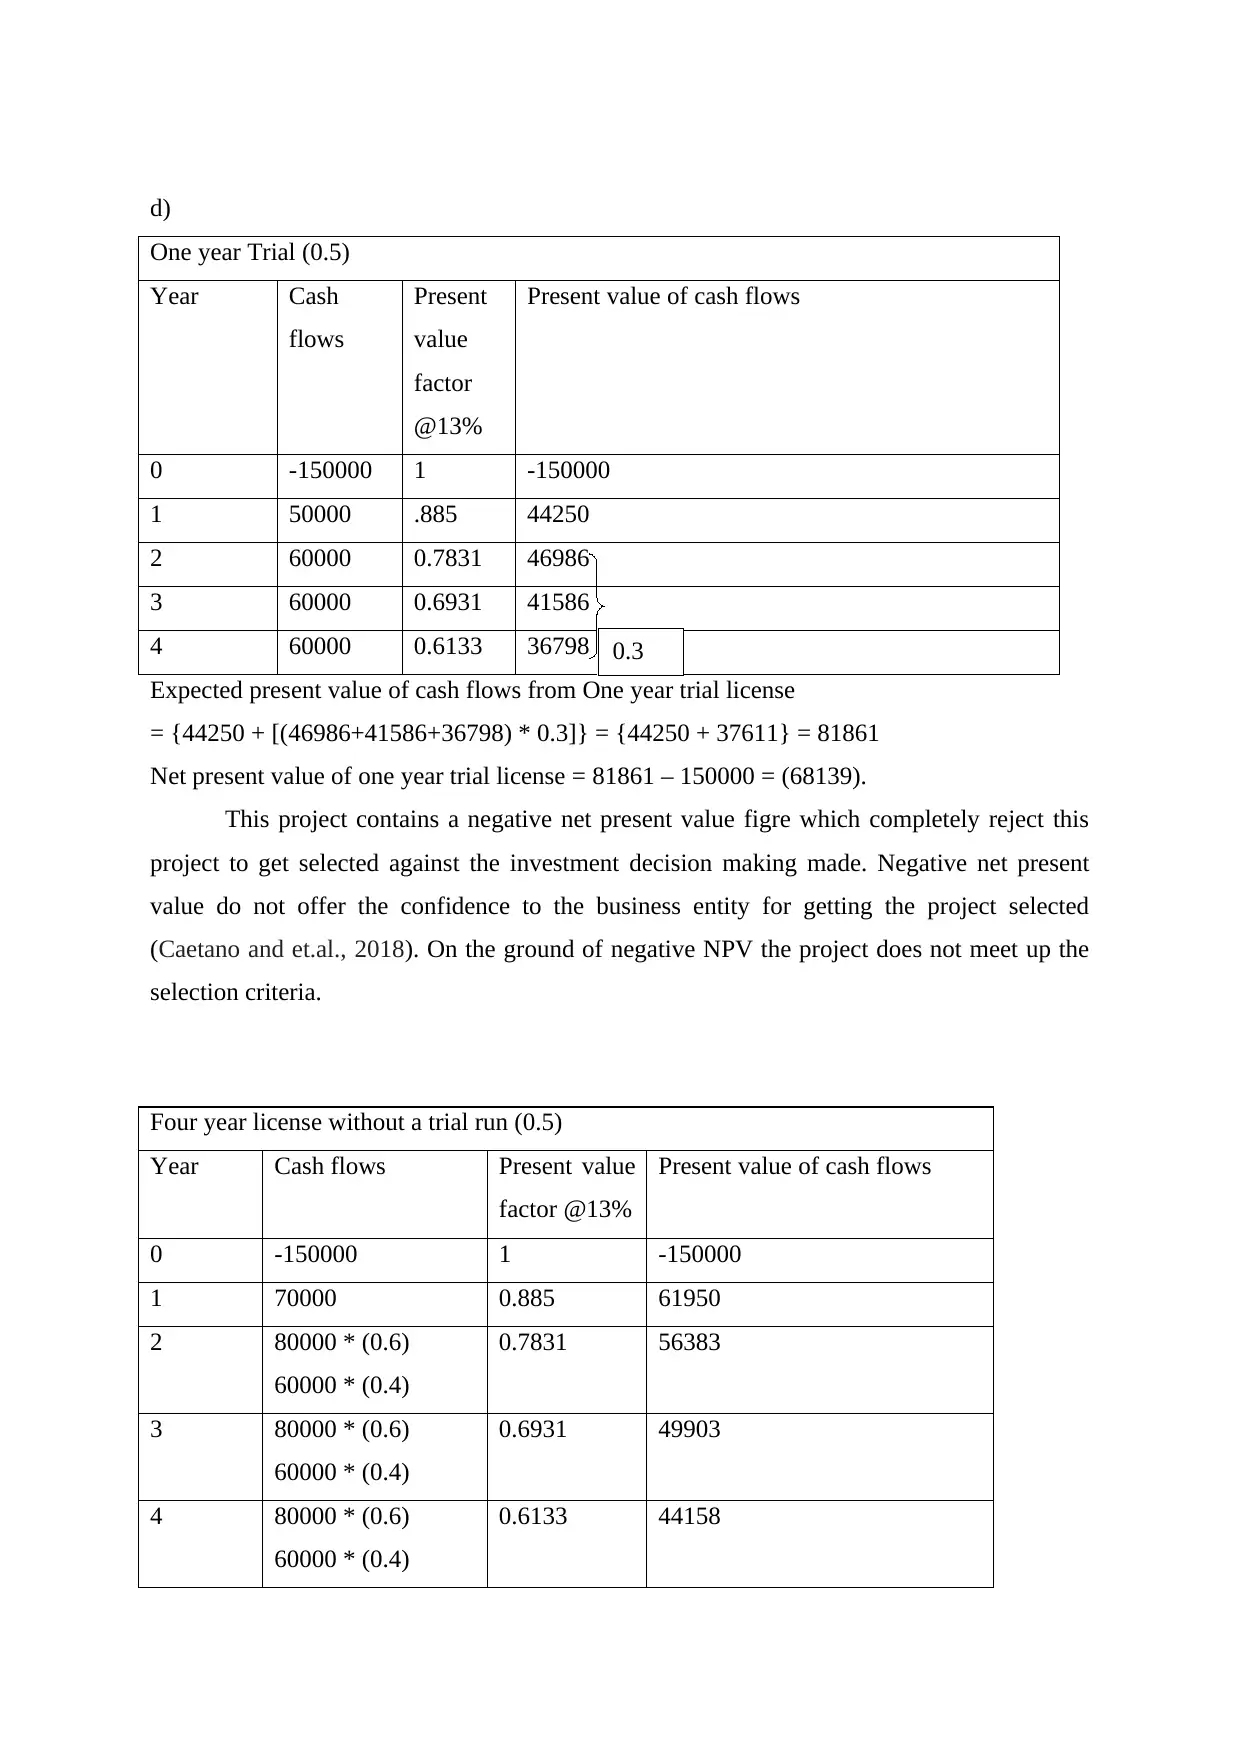
d)
One year Trial (0.5)
Year Cash
flows
Present
value
factor
@13%
Present value of cash flows
0 -150000 1 -150000
1 50000 .885 44250
2 60000 0.7831 46986
3 60000 0.6931 41586
4 60000 0.6133 36798
Expected present value of cash flows from One year trial license
= {44250 + [(46986+41586+36798) * 0.3]} = {44250 + 37611} = 81861
Net present value of one year trial license = 81861 – 150000 = (68139).
This project contains a negative net present value figre which completely reject this
project to get selected against the investment decision making made. Negative net present
value do not offer the confidence to the business entity for getting the project selected
(Caetano and et.al., 2018). On the ground of negative NPV the project does not meet up the
selection criteria.
Four year license without a trial run (0.5)
Year Cash flows Present value
factor @13%
Present value of cash flows
0 -150000 1 -150000
1 70000 0.885 61950
2 80000 * (0.6)
60000 * (0.4)
0.7831 56383
3 80000 * (0.6)
60000 * (0.4)
0.6931 49903
4 80000 * (0.6)
60000 * (0.4)
0.6133 44158
0.3
⊘ This is a preview!⊘
Do you want full access?
Subscribe today to unlock all pages.
Trusted by 1+ million students worldwide
1 out of 16
Related Documents


![International Finance Management Assignment - Finance [Course Code]](/_next/image/?url=https%3A%2F%2Fdesklib.com%2Fmedia%2Fimages%2Ffd%2F69271dad5c5f4f2c8ab93e7e6daf77ee.jpg&w=256&q=75)

Your All-in-One AI-Powered Toolkit for Academic Success.
+13062052269
info@desklib.com
Available 24*7 on WhatsApp / Email
![[object Object]](/_next/static/media/star-bottom.7253800d.svg)
Unlock your academic potential
Copyright © 2020–2026 A2Z Services. All Rights Reserved. Developed and managed by ZUCOL.