Marketing Analysis: Sherwin-Williams Hypothesis and Data Report
VerifiedAdded on  2020/05/08
|6
|1564
|131
Report
AI Summary
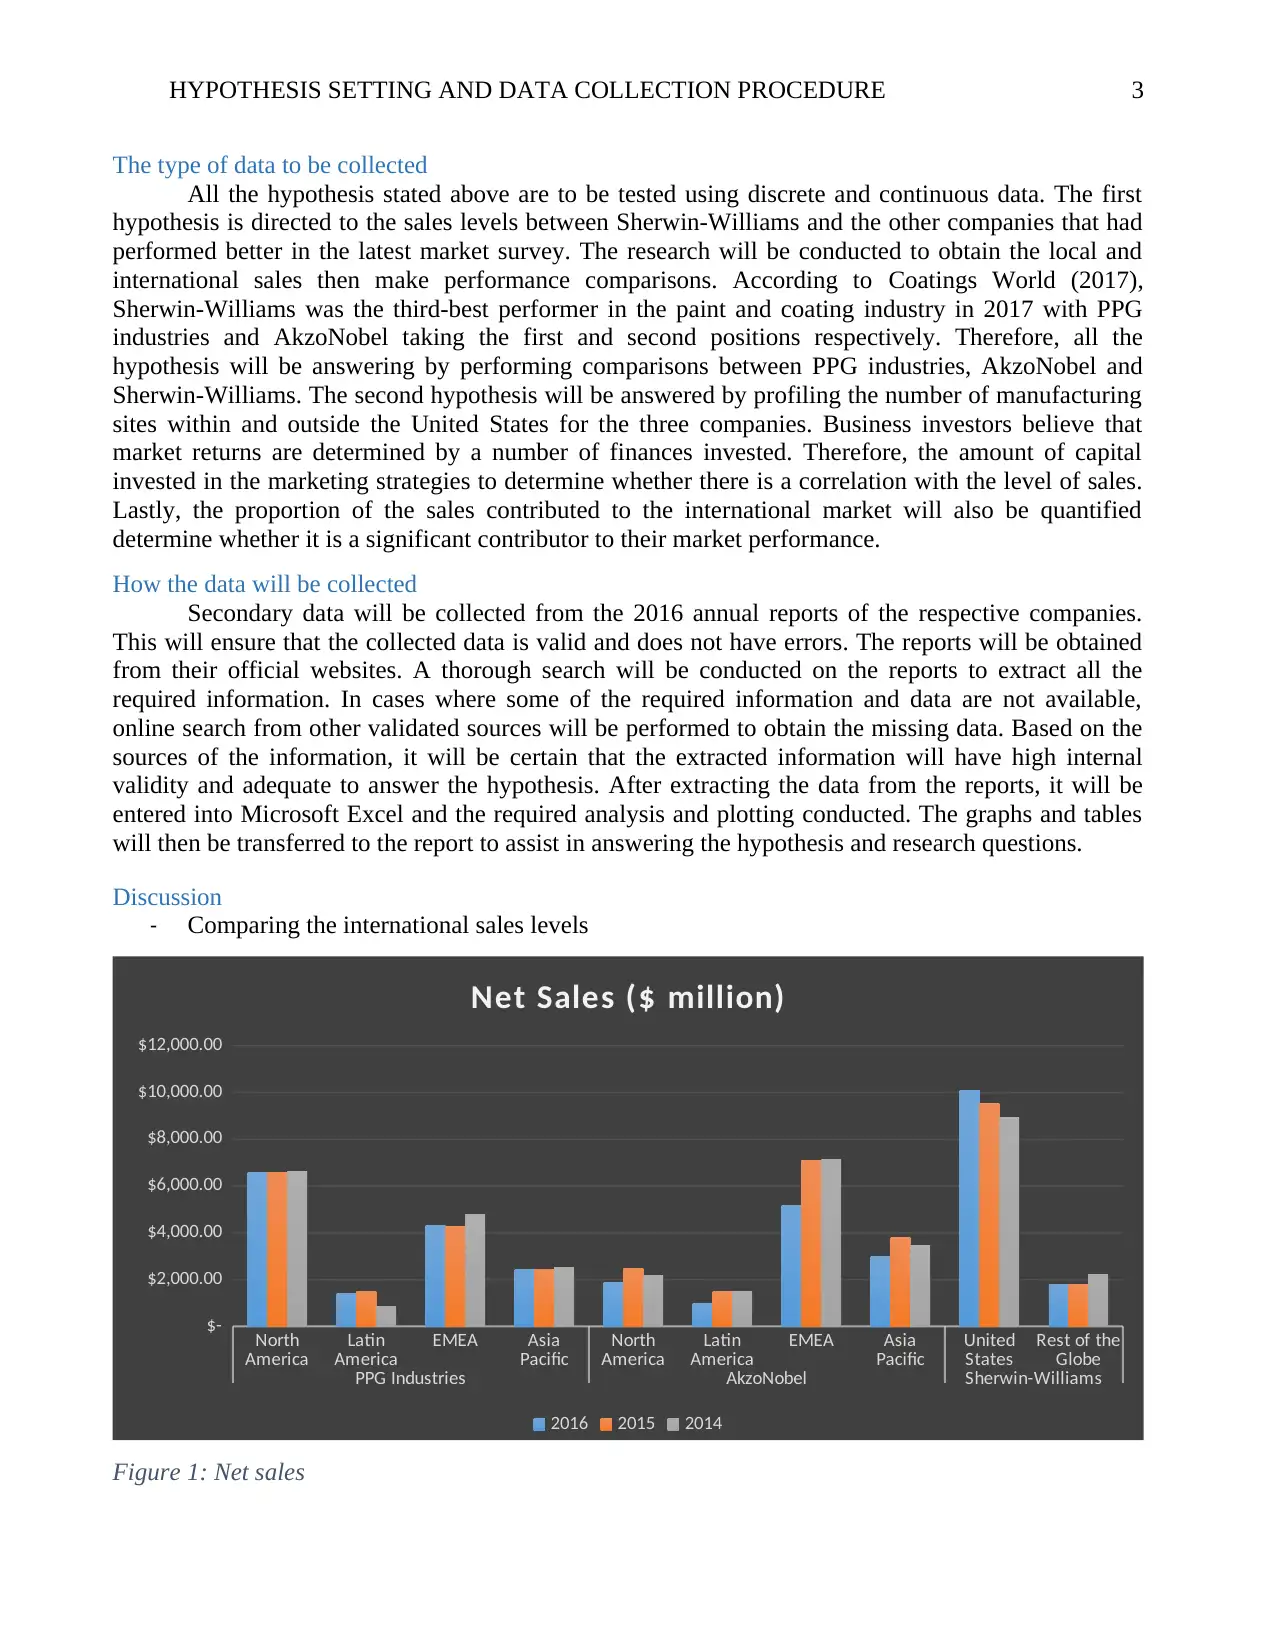
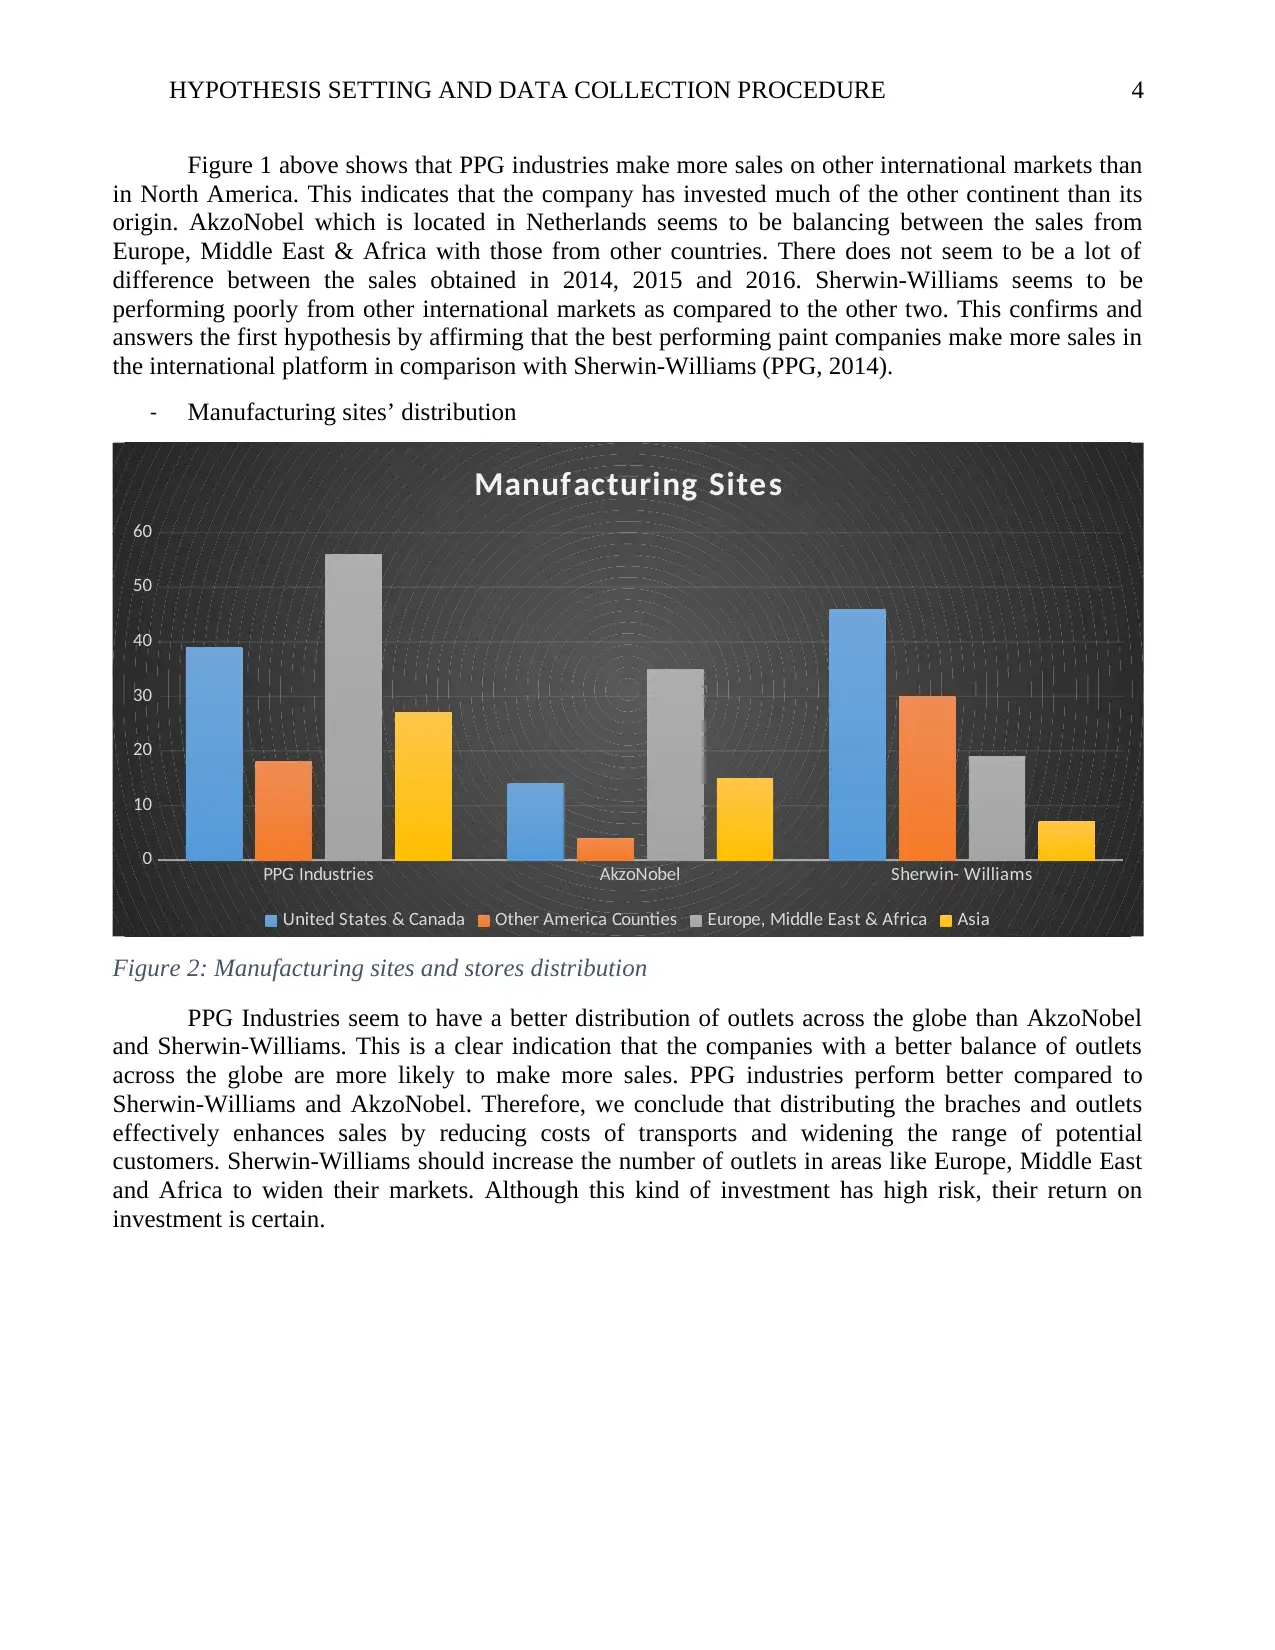
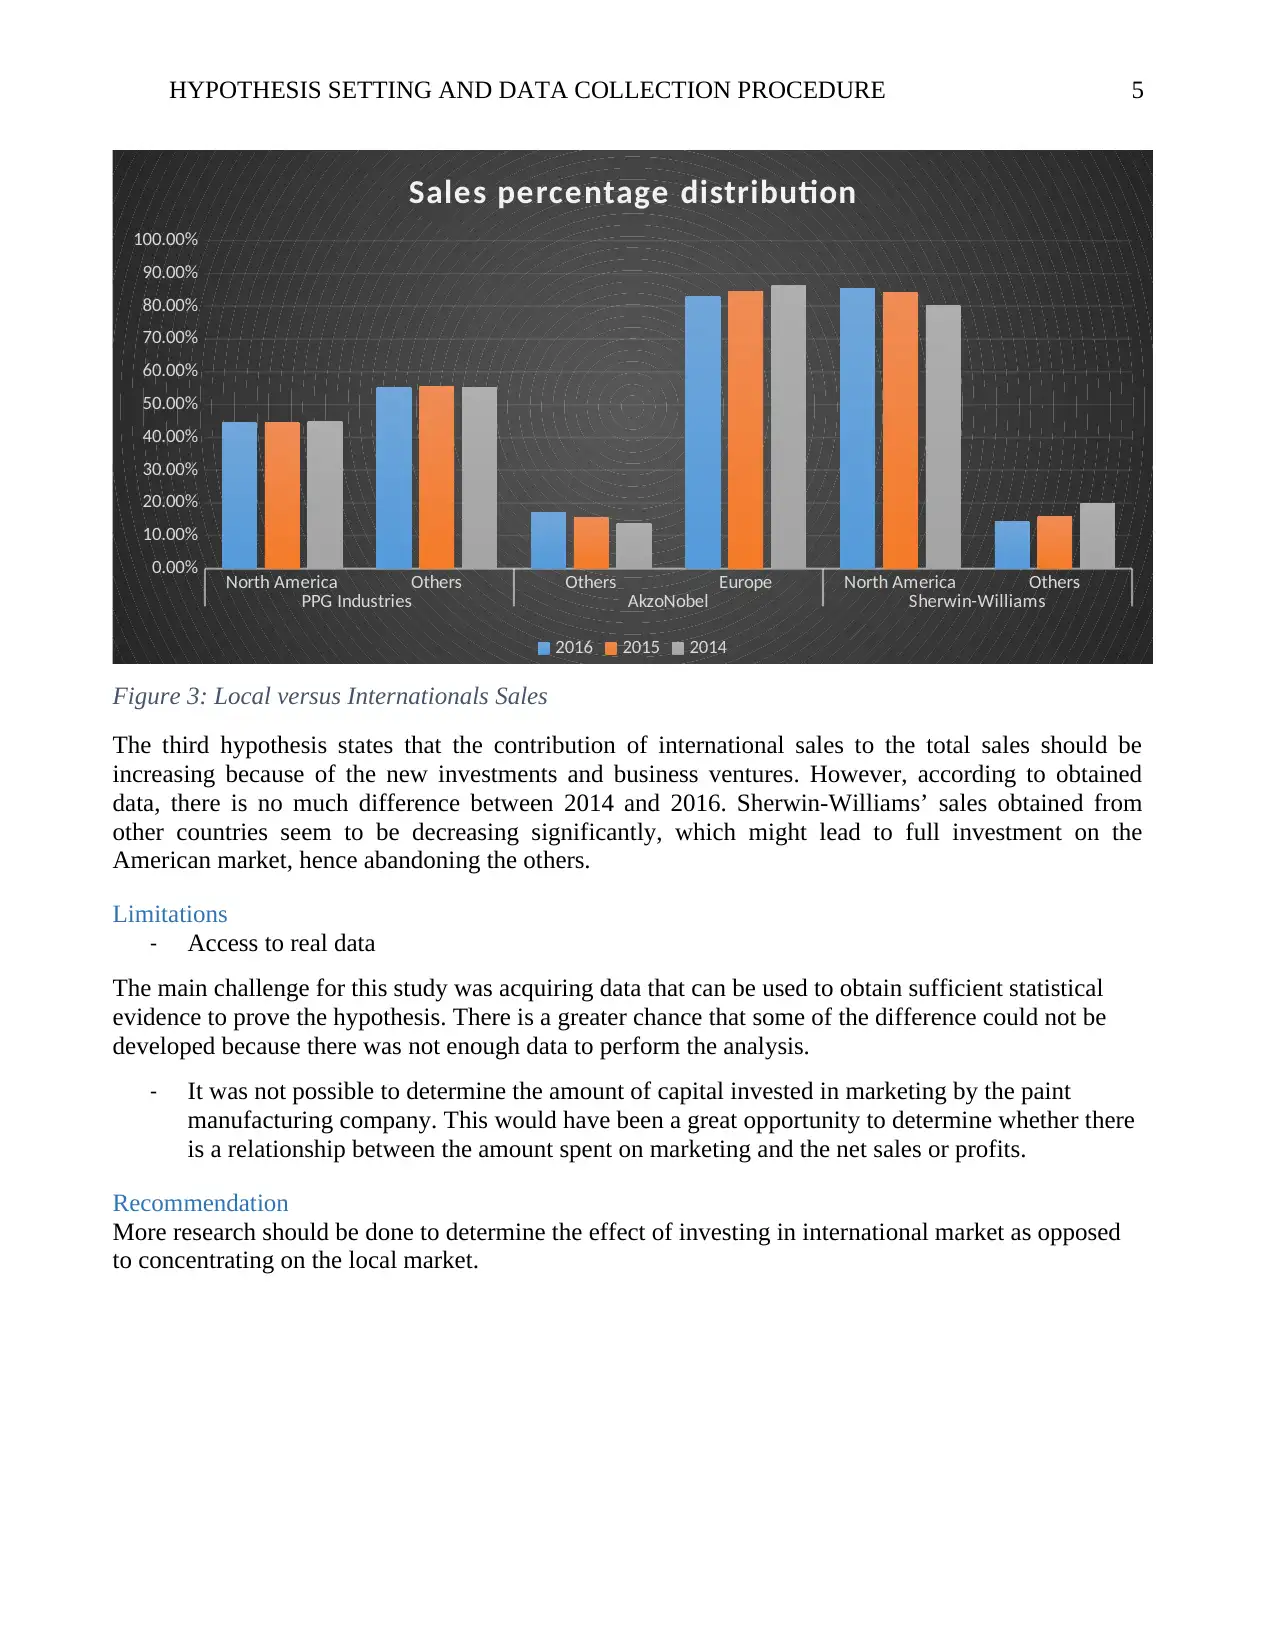
This report analyzes the international marketing performance of Sherwin-Williams, a US-based paint manufacturer. The study sets hypotheses regarding the company's declining international sales and compares its performance with competitors like PPG Industries and AkzoNobel. The report explores the type of data to be collected, including sales figures and manufacturing site distributions, using secondary data from annual reports. The data collection procedure involves extracting information from company websites and online sources, followed by analysis in Microsoft Excel. The findings indicate that Sherwin-Williams lags behind its competitors in international sales and distribution, confirming the initial hypotheses. The report discusses limitations, such as data availability and the inability to determine marketing investment, and recommends further research on the effects of international market investment.
Contribute Materials
Your contribution can guide someone’s learning journey. Share your
documents today.

Running head: HYPOTHESIS SETTING AND DATA COLLECTION PROCEDURE
Hypothesis Setting and Data Collection Procedure
Name
Course Number
Date
Faculty Name
Hypothesis Setting and Data Collection Procedure
Name
Course Number
Date
Faculty Name
Secure Best Marks with AI Grader
Need help grading? Try our AI Grader for instant feedback on your assignments.

HYPOTHESIS SETTING AND DATA COLLECTION PROCEDURE 2
Hypothesis Setting and Data Collection Procedure
Background Information
Sherwin-Williams is a US-based company focused on the manufacture and supplies of painting
products within the United States and the rest of the world. According to their sales statistics in 2016,
more than 85% are from the United States. This percentage has been increased from 78.5% in 2012,
leading to the declining focus on marketing and sales of the painting product to the rest of the world.
The local focus on the sales and marketing of Sherwin-Williams might have been propelled by the
high costs of marketing and distribution. The widening gap between the local and international sales of
Sherwin-Williams products is a marketing issue that should be solved before the company is out of
controlled to the global market.
Globalization of the painting products would is a perfect marketing strategy that can ease the
force used to sensitize the local customers. Case studies can be used to compare the company with
other companies that have focused on international marketing and have successfully succeeded in their
business. Therefore, Sherwin-Williams should target on improving the sales made on international
markets. Opening branches in different areas across the globe can be among the strategies of the
relieving the company from distributional costs. Comparing the sales distribution of PPG Industries
and Sherwin-Williams, the former has a better global marketing and sales distribution. PPG’s success
on the international market has been enhanced by its strategic distribution of outlets in different parts
of the globe. For instance, PPG Industries have 156 manufacturing sites with 45 of them in the United
States and distributed over 19 states. There are other 14 sites located across other 10 countries within
America, 64 in Europe, Middle East and Africa and 33 in Asia Pacific. This perfect marketing strategy
eases the distribution process of the products and reduces their costs (PPG, 2014).
The distribution of Sherwin-Williams’ manufacturing sites has been centred within United
Stated with few stretched in Canada. This limits the ability of the company to sell and market its
products in other potential markets like Europe, Asia, Middle East and Africa. This pulldown to
Sherwin-Williams has given other companies such as PPG industries the opportunity to dominate the
international markets. One of the main disadvantage that Sherwin-Williams have in the market is the
fact the US painting products market is highly competitive. Failure to explore other potential market
reduces the chances of making more profits for the benefit of the company. We can assume that the
painting companies originating from the United States and are performing better that Sherwin-
Williams make more sales internationally. Also, it can be tested and proved whether such companies
have more outlets and distributional centres outside the US compare to Sherwin-Williams (Pci, 2017).
Hypothesis
The hypothesis is based on the facts that Sherwin-Williams’ international sales performance is
shrinking, hence endangering the future of their products on the global market.
1. Paint manufacturing industries performing better than Sherwin-Williams have higher
international sales.
2. Paint manufacturing industries performing better than Sherwin-Williams have more
international outlets compared to Sherwin-Williams
3. The percentage of sales contributed by the international markets for competitors of Sherwin-
Williams is has an increasing trend.

HYPOTHESIS SETTING AND DATA COLLECTION PROCEDURE 3
The type of data to be collected
All the hypothesis stated above are to be tested using discrete and continuous data. The first
hypothesis is directed to the sales levels between Sherwin-Williams and the other companies that had
performed better in the latest market survey. The research will be conducted to obtain the local and
international sales then make performance comparisons. According to Coatings World (2017),
Sherwin-Williams was the third-best performer in the paint and coating industry in 2017 with PPG
industries and AkzoNobel taking the first and second positions respectively. Therefore, all the
hypothesis will be answering by performing comparisons between PPG industries, AkzoNobel and
Sherwin-Williams. The second hypothesis will be answered by profiling the number of manufacturing
sites within and outside the United States for the three companies. Business investors believe that
market returns are determined by a number of finances invested. Therefore, the amount of capital
invested in the marketing strategies to determine whether there is a correlation with the level of sales.
Lastly, the proportion of the sales contributed to the international market will also be quantified
determine whether it is a significant contributor to their market performance.
How the data will be collected
Secondary data will be collected from the 2016 annual reports of the respective companies.
This will ensure that the collected data is valid and does not have errors. The reports will be obtained
from their official websites. A thorough search will be conducted on the reports to extract all the
required information. In cases where some of the required information and data are not available,
online search from other validated sources will be performed to obtain the missing data. Based on the
sources of the information, it will be certain that the extracted information will have high internal
validity and adequate to answer the hypothesis. After extracting the data from the reports, it will be
entered into Microsoft Excel and the required analysis and plotting conducted. The graphs and tables
will then be transferred to the report to assist in answering the hypothesis and research questions.
Discussion
- Comparing the international sales levels
North
America Latin
America EMEA Asia
Pacific North
America Latin
America EMEA Asia
Pacific United
States Rest of the
Globe
PPG Industries AkzoNobel Sherwin-Williams
$-
$2,000.00
$4,000.00
$6,000.00
$8,000.00
$10,000.00
$12,000.00
Net Sales ($ million)
2016 2015 2014
Figure 1: Net sales

HYPOTHESIS SETTING AND DATA COLLECTION PROCEDURE 4
Figure 1 above shows that PPG industries make more sales on other international markets than
in North America. This indicates that the company has invested much of the other continent than its
origin. AkzoNobel which is located in Netherlands seems to be balancing between the sales from
Europe, Middle East & Africa with those from other countries. There does not seem to be a lot of
difference between the sales obtained in 2014, 2015 and 2016. Sherwin-Williams seems to be
performing poorly from other international markets as compared to the other two. This confirms and
answers the first hypothesis by affirming that the best performing paint companies make more sales in
the international platform in comparison with Sherwin-Williams (PPG, 2014).
- Manufacturing sites’ distribution
PPG Industries AkzoNobel Sherwin- Williams
0
10
20
30
40
50
60
Manufacturing Sites
United States & Canada Other America Counties Europe, Middle East & Africa Asia
Figure 2: Manufacturing sites and stores distribution
PPG Industries seem to have a better distribution of outlets across the globe than AkzoNobel
and Sherwin-Williams. This is a clear indication that the companies with a better balance of outlets
across the globe are more likely to make more sales. PPG industries perform better compared to
Sherwin-Williams and AkzoNobel. Therefore, we conclude that distributing the braches and outlets
effectively enhances sales by reducing costs of transports and widening the range of potential
customers. Sherwin-Williams should increase the number of outlets in areas like Europe, Middle East
and Africa to widen their markets. Although this kind of investment has high risk, their return on
investment is certain.
Secure Best Marks with AI Grader
Need help grading? Try our AI Grader for instant feedback on your assignments.

HYPOTHESIS SETTING AND DATA COLLECTION PROCEDURE 5
North America Others Others Europe North America Others
PPG Industries AkzoNobel Sherwin-Williams
0.00%
10.00%
20.00%
30.00%
40.00%
50.00%
60.00%
70.00%
80.00%
90.00%
100.00%
Sales percentage distribution
2016 2015 2014
Figure 3: Local versus Internationals Sales
The third hypothesis states that the contribution of international sales to the total sales should be
increasing because of the new investments and business ventures. However, according to obtained
data, there is no much difference between 2014 and 2016. Sherwin-Williams’ sales obtained from
other countries seem to be decreasing significantly, which might lead to full investment on the
American market, hence abandoning the others.
Limitations
- Access to real data
The main challenge for this study was acquiring data that can be used to obtain sufficient statistical
evidence to prove the hypothesis. There is a greater chance that some of the difference could not be
developed because there was not enough data to perform the analysis.
- It was not possible to determine the amount of capital invested in marketing by the paint
manufacturing company. This would have been a great opportunity to determine whether there
is a relationship between the amount spent on marketing and the net sales or profits.
Recommendation
More research should be done to determine the effect of investing in international market as opposed
to concentrating on the local market.

HYPOTHESIS SETTING AND DATA COLLECTION PROCEDURE 6
References
AkzoNobel. (2017). Annual Report 2015 | AkzoNobel. Akzonobel.com. Retrieved
16 October 2017, from https://www.akzonobel.com/for-investors/all-
reports/annual-report-2015
Coatings World. (2017). 2017 Global Rankings of the TOP manufacturers of paints
and coatings.. Coatings World. Retrieved 15 October 2017, from
https://www.coatingsworld.com/issues/2017-07-01/view_features/2017-
global-rankings-of-the-top-manufacturers-of-paints-coatings-adhesives-and-
sealants
Pci. (2017). 2016 Global Top 10 and PCI 25: Top Paint and Coatings Companies.
Pcimag.com. Retrieved 16 October 2017, from
https://www.pcimag.com/articles/102264-global-top-10-and-pci-25-top-
paint-and-coatings-companies
PPG. (2014). PPG PAINTS, COATINGS AND MATERIALS: OUR COMPANY - PPG -
Paints, Coatings and Materials. Corporate.ppg.com. Retrieved 15 October
2017, from http://corporate.ppg.com/Our-Company/Facts-About-PPG.aspx
1 out of 6
Related Documents

Your All-in-One AI-Powered Toolkit for Academic Success.
 +13062052269
info@desklib.com
Available 24*7 on WhatsApp / Email
Unlock your academic potential
© 2024  |  Zucol Services PVT LTD  |  All rights reserved.