International Passenger Survey Data and Business Strategies
VerifiedAdded on 2020/12/26
|18
|3140
|55
Report
AI Summary
This report explores the use of data, specifically the International Passenger Survey (IPS), to build effective business strategies, focusing on the travel and tourism sector. The study analyzes IPS data, collected by the Office for National Statistics, to understand travel patterns of UK residents, including destinations, travel purposes, and demographic breakdowns. The report employs descriptive statistics such as mean, mode, median, standard deviation, and correlation coefficient to interpret the data. Key findings include insights into traveler demographics, travel frequency, and spending habits. The report then provides actionable recommendations for a travel company, TopDeck, including targeting specific age groups, offering competitive pricing and promotions, leveraging digital communication, enhancing hospitality services, and expanding service offerings. The conclusion emphasizes the importance of data-driven decision-making for customer acquisition and sustainable business growth in the tourism industry, highlighting the potential of personalized offers and technological advancements.
Using data to build
business
business
Paraphrase This Document
Need a fresh take? Get an instant paraphrase of this document with our AI Paraphraser
Table of Contents
INTRODUCTION...........................................................................................................................1
MAIN BODY...................................................................................................................................1
Analysing the data........................................................................................................................1
Defining level of knowledge........................................................................................................2
Method.........................................................................................................................................3
Outcomes.....................................................................................................................................4
Recommendations .......................................................................................................................9
CONCLUSION..............................................................................................................................10
REFERENCES..............................................................................................................................11
APPENDIX....................................................................................................................................13
INTRODUCTION
Using data to build business helps in lower customer acquisition cost with higher customer expectations. It also helps in
validating business decision which leads to higher sustainable growth and development of the business. It helps in identifying idea
customers and eliminate wastage. It helps in effectively managing the task which leads to higher sustainable growth of the business.
This study will highlight, International Passenger Survey (IPS) which collects information about passengers who are entering
and leaving UK. This study will examine patterns of travel by UK residents with specific interpretation. This study will also include
recommendations for potential target segment.
TopDeck is a tour and travel company headquartered in Hannover, Germany which provide various services like related with
tourism. It focus on providing services like holiday packages, resort, hotel, and various other travelling services which attract more
customers.
MAIN BODY
Analysing the data
International Passenger Survey (IPS) is a detailed estimation of data which is effectively carried out by Office for National
Statistics (ONS). The data of TravelPac involves the holiday tours mainly during the period of July, August and September. The data
also includes the destinations where the residents went such as Italy, France, Spain. These places were the most visited places by the
UK residents in the Q3, 2017. Other visited countries by UK residents that the data shows are UAE, Netherlands, Hungary, Czech
Republic.
The metadata also includes the purpose for which the residents travelled across and outside the country. As per the data of
TravelPac, it has seen that people travelled for various purposes such as holidays, business meetings, meeting friends, family and for
the purpose of studies. It was learned from the analysis report that holiday and meeting with friends and family were the major reasons
for travelling. Moreover, by looking at the IPS survey, it was found out that majority of the residents travelled without any holiday
package. The age group in the survey is divided into 0-15, 16-24, 25-34, 35-44 and so on. It was observed that residents belong to
1
⊘ This is a preview!⊘
Do you want full access?
Subscribe today to unlock all pages.
Trusted by 1+ million students worldwide
each age group has travelled during Q3. The metadata was also segregated on the gender in which the data was collected such as
number of females that travelled within and outside the country. It covers mode of transport like air, sea, land, tunnel ports and give
detailed information of the people traveling to from the Unites Kingdom (Derudder and Witlox, 2016).
Defining level of knowledge
Business decision making is a process of where the managers of a business concern are expected to form rational decisions for
the company which takes the organisation towards its goals and objectives. The growth and success largely depends upon the kinds of
decisions, management takes. This is the reason why business decision making is considered as one of the critical aspect of
management as wrong decisions could lead to the failure of the organisation. There are different tools and techniques that managers
use for taking rational and effective decisions which are discussed below :
SWOT analysis : This is a model which helps in assessing the internal strengths and weaknesses of a subject matter. Managers
commonly use this technique while forming a decision by evaluating company's strengths that can be leveraged upon and
weaknesses which needs to be overcome. This technique also helps in determining the opportunities and threats in the external
environment which could potentially affect the business in positive/negative manner respectively. The marketing manager in
TopDeck can employ this tool for assessing company's internal strengths and weakness and can accordingly formulate
strategies.
Feasibility studies : This tool helps managers in ascertaining the viability and feasibility of a project or any other subject
matter. Before undertaking of any project, the feasibility in terms of cost and time is assessed. Such an evaluation and analysis
assist the managers in taking more effective decisions for the company (Decision-Making Tools & Techniques for Strategic
Planning, 2019). The management of the TopDeck must assess the vaibility and reliability of any project they intend to take,
by preparing budgets and investment analysis tools.
Market research : Thorough market research is required before any deciding any policy or strategy for an organisation. Such
a research helps a manager in identifying the position of company in market, the position of its competitors and other valuable
2
Paraphrase This Document
Need a fresh take? Get an instant paraphrase of this document with our AI Paraphraser
insights of the market scenario that would make the decision making more rational. The marketing manager could conduct
theorough market reseacrh for assessing the market situations that could have potential impact on the business of TopDeck.
Method
Descriptive statistics: This refers to the numerical terms which are used for summarising and describing the data. It is the
description of data in brief which represents the whole or a sample of a data set. Broadly, there are four kinds of descriptive statistics
that are; measures of central tendency such as mean, mode, median; measures of dispersion such as standard deviation, variance,
range; frequency measures such as count, percent and position measures such as Quartiles, percentiles etc (Descriptive
Statistics,2019).
Descriptive statistics/analysis is used for calculation and interpreting the data related to the TravelPac. This analysis will assist
in ascertaining the pattern of travel. The motive behind undertaking this calculations and analysis is to facilitate the TravelPac in its
decision making.
Mean: It is a mathematical average where the sum of various series is calculated to take out average. It helps in deriving to the
central tendency (Mertler and Reinhart, 2016). Mode: It is referred to as the number which has most frequently occurred in particular series of data (Luo and et.al., 2018). The
highest count of the number is termed as modal value (Karatoprak and Seker, 2019). Range: It is the difference between the maximum value and minimum value. It helps in measuring the variability of the data or
spread of data (Mean, Median, Mode, and Range, 2019). Standard deviation: It helps in effectively identifying the variation or deviation in particular set of data. It can never be
negative (George and Mallery, 2016).
3
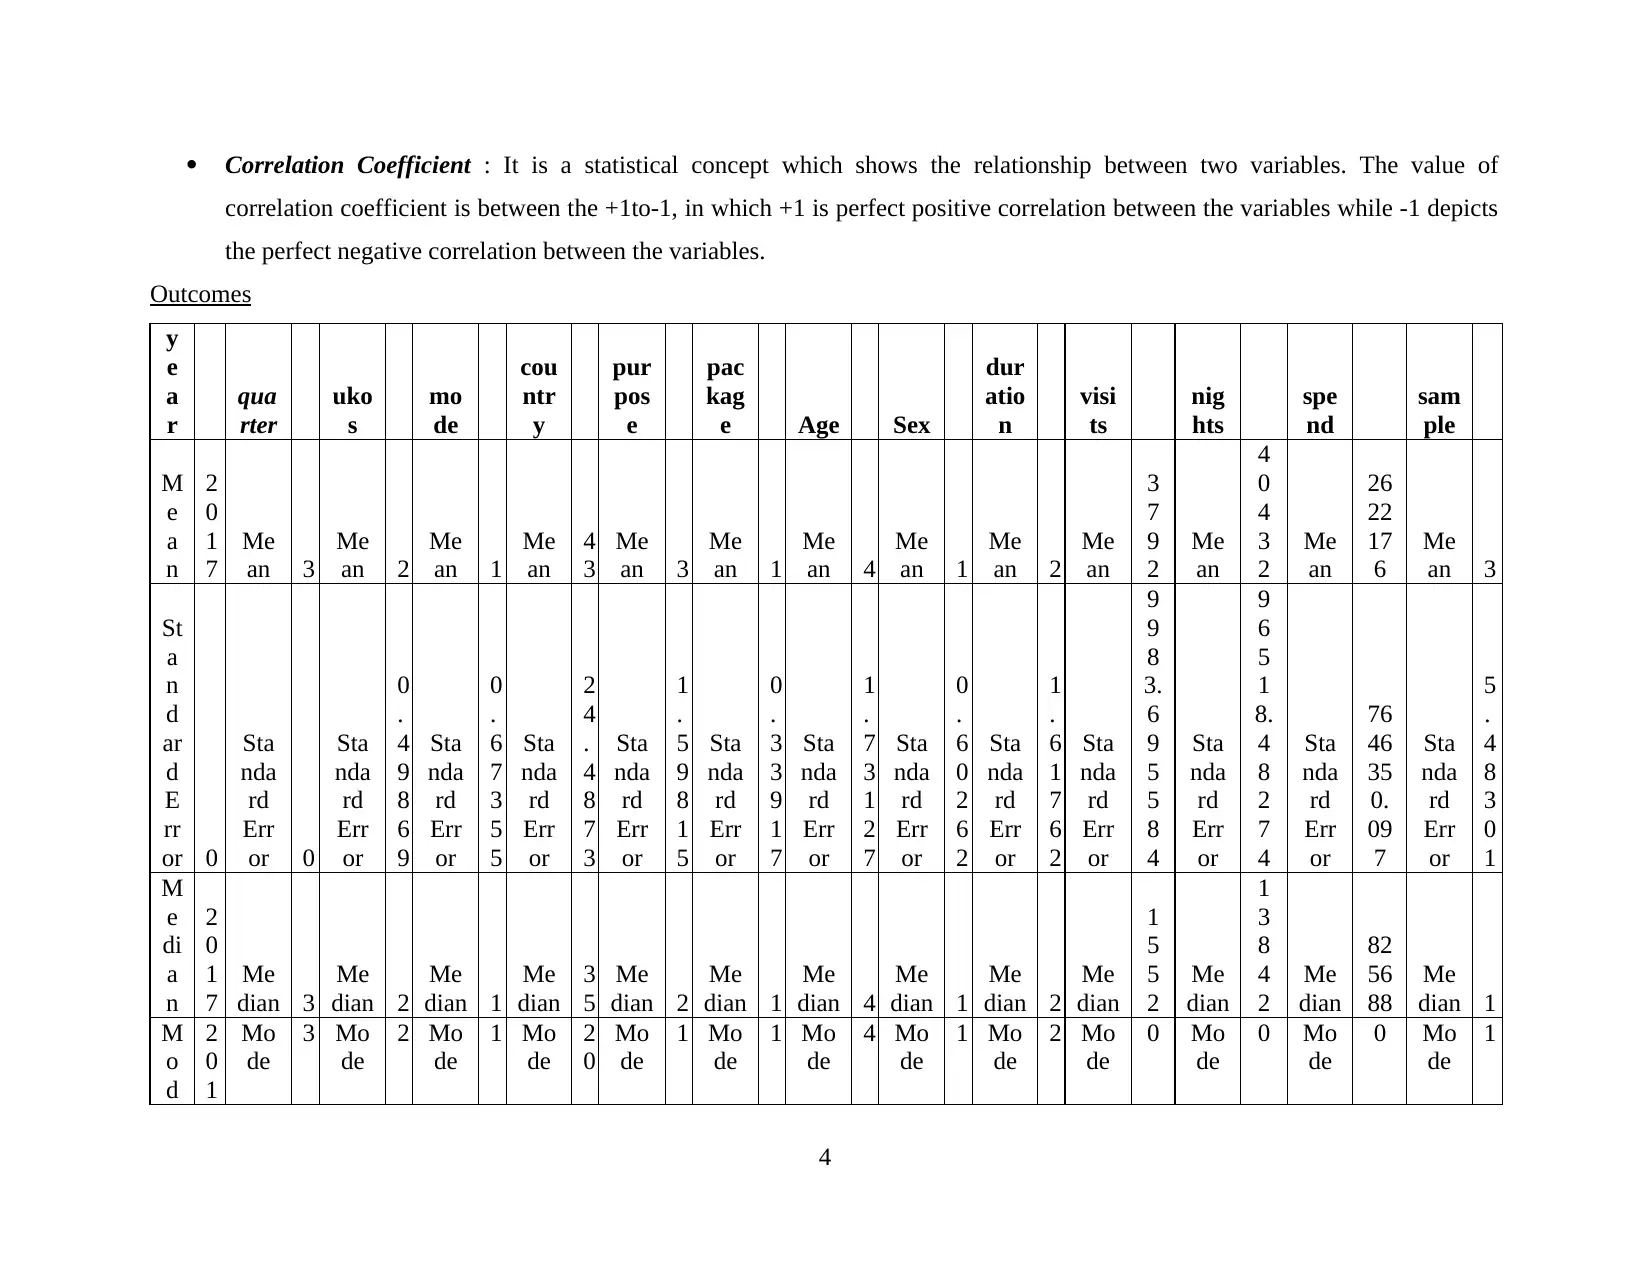
Correlation Coefficient : It is a statistical concept which shows the relationship between two variables. The value of
correlation coefficient is between the +1to-1, in which +1 is perfect positive correlation between the variables while -1 depicts
the perfect negative correlation between the variables.
Outcomes
y
e
a
r
qua
rter
uko
s
mo
de
cou
ntr
y
pur
pos
e
pac
kag
e Age Sex
dur
atio
n
visi
ts
nig
hts
spe
nd
sam
ple
M
e
a
n
2
0
1
7
Me
an 3
Me
an 2
Me
an 1
Me
an
4
3
Me
an 3
Me
an 1
Me
an 4
Me
an 1
Me
an 2
Me
an
3
7
9
2
Me
an
4
0
4
3
2
Me
an
26
22
17
6
Me
an 3
St
a
n
d
ar
d
E
rr
or 0
Sta
nda
rd
Err
or 0
Sta
nda
rd
Err
or
0
.
4
9
8
6
9
Sta
nda
rd
Err
or
0
.
6
7
3
5
5
Sta
nda
rd
Err
or
2
4
.
4
8
7
3
Sta
nda
rd
Err
or
1
.
5
9
8
1
5
Sta
nda
rd
Err
or
0
.
3
3
9
1
7
Sta
nda
rd
Err
or
1
.
7
3
1
2
7
Sta
nda
rd
Err
or
0
.
6
0
2
6
2
Sta
nda
rd
Err
or
1
.
6
1
7
6
2
Sta
nda
rd
Err
or
9
9
8
3.
6
9
5
5
8
4
Sta
nda
rd
Err
or
9
6
5
1
8.
4
8
2
7
4
Sta
nda
rd
Err
or
76
46
35
0.
09
7
Sta
nda
rd
Err
or
5
.
4
8
3
0
1
M
e
di
a
n
2
0
1
7
Me
dian 3
Me
dian 2
Me
dian 1
Me
dian
3
5
Me
dian 2
Me
dian 1
Me
dian 4
Me
dian 1
Me
dian 2
Me
dian
1
5
5
2
Me
dian
1
3
8
4
2
Me
dian
82
56
88
Me
dian 1
M
o
d
2
0
1
Mo
de
3 Mo
de
2 Mo
de
1 Mo
de
2
0
Mo
de
1 Mo
de
1 Mo
de
4 Mo
de
1 Mo
de
2 Mo
de
0 Mo
de
0 Mo
de
0 Mo
de
1
4
⊘ This is a preview!⊘
Do you want full access?
Subscribe today to unlock all pages.
Trusted by 1+ million students worldwide

e 7
St
a
n
d
ar
d
D
e
vi
at
io
n 0
Sta
nda
rd
Dev
iati
on 0
Sta
nda
rd
Dev
iati
on
0
.
4
9
8
6
9
Sta
nda
rd
Dev
iati
on
0
.
6
7
3
5
5
Sta
nda
rd
Dev
iati
on
2
4
.
4
8
7
3
Sta
nda
rd
Dev
iati
on
1
.
5
9
8
1
5
Sta
nda
rd
Dev
iati
on
0
.
3
3
9
1
7
Sta
nda
rd
Dev
iati
on
1
.
7
3
1
2
7
Sta
nda
rd
Dev
iati
on
0
.
6
0
2
6
2
Sta
nda
rd
Dev
iati
on
1
.
6
1
7
6
2
Sta
nda
rd
Dev
iati
on
9
9
8
3.
6
9
5
5
8
4
Sta
nda
rd
Dev
iati
on
9
6
5
1
8.
4
8
2
7
4
Sta
nda
rd
Dev
iati
on
76
46
35
0.
09
7
Sta
nda
rd
Dev
iati
on
5
.
4
8
3
0
1
S
a
m
pl
e
V
ar
ia
n
c
e 0
Sa
mpl
e
Var
ianc
e 0
Sa
mpl
e
Var
ianc
e
0
.
2
4
8
6
9
Sa
mpl
e
Var
ianc
e
0
.
4
5
3
6
7
Sa
mpl
e
Var
ianc
e
5
9
9
.
6
2
8
Sa
mpl
e
Var
ianc
e
2
.
5
5
4
0
8
Sa
mpl
e
Var
ianc
e
0
.
1
1
5
0
4
Sa
mpl
e
Var
ianc
e
2
.
9
9
7
2
9
Sa
mpl
e
Var
ianc
e
0
.
3
6
3
1
5
Sa
mpl
e
Var
ianc
e
2
.
6
1
6
6
9
Sa
mpl
e
Var
ianc
e
9
9
6
7
4
1
7
7.
5
1
Sa
mpl
e
Var
ianc
e
9
3
1
5
8
1
7
5
1
0
Sa
mpl
e
Var
ianc
e
5.
84
66
7E
+1
3
Sa
mpl
e
Var
ianc
e
3
0
.
0
6
3
4
K
ur
to
si
s
#
D
I
V
/
0
!
Kur
tosi
s
#
D
I
V
/
0
!
Kur
tosi
s
-
1
.
9
7
9
Kur
tosi
s
0
.
8
3
4
3
3
Kur
tosi
s
-
1
.
0
5
8
8
Kur
tosi
s
-
1
.
2
5
4
1
Kur
tosi
s
2
.
6
9
5
9
1
Kur
tosi
s
-
0
.
8
1
9
9
Kur
tosi
s
4
5
.
0
7
3
Kur
tosi
s
6
.
6
8
3
2
Kur
tosi
s
2
0
5.
7
4
6
1
4
1
Kur
tosi
s
9
4.
5
8
9
3
8
2
4
Kur
tosi
s
20
8.
83
59
22
Kur
tosi
s
1
7
0
.
2
6
2
5
Paraphrase This Document
Need a fresh take? Get an instant paraphrase of this document with our AI Paraphraser
8 2
S
k
e
w
n
es
s
#
D
I
V
/
0
!
Ske
wne
ss
#
D
I
V
/
0
!
Ske
wne
ss
-
0
.
1
4
6
5
Ske
wne
ss
1
.
5
1
0
3
1
Ske
wne
ss
0
.
5
7
9
2
Ske
wne
ss
0
.
4
5
2
5
6
Ske
wne
ss
2
.
1
6
6
8
7
Ske
wne
ss
0
.
0
3
6
6
1
Ske
wne
ss
3
.
8
1
5
4
7
Ske
wne
ss
2
.
1
6
1
2
Ske
wne
ss
1
2.
3
1
8
1
9
4
9
8
Ske
wne
ss
8.
0
1
1
7
6
1
6
4
8
Ske
wne
ss
11
.8
32
68
45
4
Ske
wne
ss
1
0
.
9
2
6
4
R
a
n
g
e 0
Ran
ge 0
Ran
ge 1
Ran
ge 2
Ran
ge
8
2
Ran
ge 8
Ran
ge 1
Ran
ge 8
Ran
ge 9
Ran
ge 9
Ran
ge
2
2
7
2
9
9
Ran
ge
1
9
2
8
2
0
8
Ran
ge
21
58
72
95
4
Ran
ge
1
2
5
M
in
i
m
u
m
2
0
1
7
Min
imu
m 3
Min
imu
m 1
Min
imu
m 1
Min
imu
m
1
0
Min
imu
m 1
Min
imu
m 1
Min
imu
m 1
Min
imu
m 0
Min
imu
m 0
Min
imu
m 0
Min
imu
m 0
Min
imu
m 0
Min
imu
m 0
M
a
xi
m
u
m
2
0
1
7
Ma
xim
um
3 Ma
xim
um
2 Ma
xim
um
3 Ma
xim
um
9
2
Ma
xim
um
9 Ma
xim
um
2 Ma
xim
um
9 Ma
xim
um
9 Ma
xim
um
9 Ma
xim
um
2
2
7
2
9
8.
5
8
4
Ma
xim
um
1
9
2
8
2
0
7.
9
1
Ma
xim
um
21
58
72
95
4
Ma
xim
um
1
2
5
6
8
S
u
m
1
8
5
8
6
6
5
5
Su
m
2
7
,
6
4
5
Su
m
1
4
,
1
5
9
Su
m
1
2
,
7
2
1
Su
m
3
9
2
,
9
5
5
Su
m
2
3
,
2
8
1
Su
m
1
0
,
4
3
7
Su
m
3
7
,
9
7
1
Su
m
1
3
,
5
9
4
Su
m
2
2
,
0
7
0
Su
m
3
4,
9
3
8,
9
4
0.
1
1
4
Su
m
3
7
2,
5
7
7,
2
6
4.
7
0
9
Su
m
24
,1
63
,3
47
,9
37
.9
66
Su
m
2
5
,
1
7
9
C
o
u
nt
9
2
1
5
Cou
nt
9
2
1
5
Cou
nt
9
2
1
5
Cou
nt
9
2
1
5
Cou
nt
9
2
1
5
Cou
nt
9
2
1
5
Cou
nt
9
2
1
5
Cou
nt
9
2
1
5
Cou
nt
9
2
1
5
Cou
nt
9
2
1
5
Cou
nt
9
2
1
5
Cou
nt
9
2
1
5
Cou
nt
92
15
Cou
nt
9
2
1
5
C
o
nf
id
e
n
c
e
L
e
v
el
(9
5.
0
%
#
N
U
M
!
Con
fide
nce
Lev
el(9
5.0
%)
#
N
U
M
!
Con
fide
nce
Lev
el(9
5.0
%)
#
N
U
M
!
Con
fide
nce
Lev
el(9
5.0
%)
#
N
U
M
!
Con
fide
nce
Lev
el(9
5.0
%)
#
N
U
M
!
Con
fide
nce
Lev
el(9
5.0
%)
#
N
U
M
!
Con
fide
nce
Lev
el(9
5.0
%)
#
N
U
M
!
Con
fide
nce
Lev
el(9
5.0
%)
#
N
U
M
!
Con
fide
nce
Lev
el(9
5.0
%)
#
N
U
M
!
Con
fide
nce
Lev
el(9
5.0
%)
#
N
U
M
!
Con
fide
nce
Lev
el(9
5.0
%)
#
N
U
M
!
Con
fide
nce
Lev
el(9
5.0
%)
#
N
U
M
!
Con
fide
nce
Lev
el(9
5.0
%)
#N
U
M!
Con
fide
nce
Lev
el(9
5.0
%)
#
N
U
M
!
7
⊘ This is a preview!⊘
Do you want full access?
Subscribe today to unlock all pages.
Trusted by 1+ million students worldwide
)
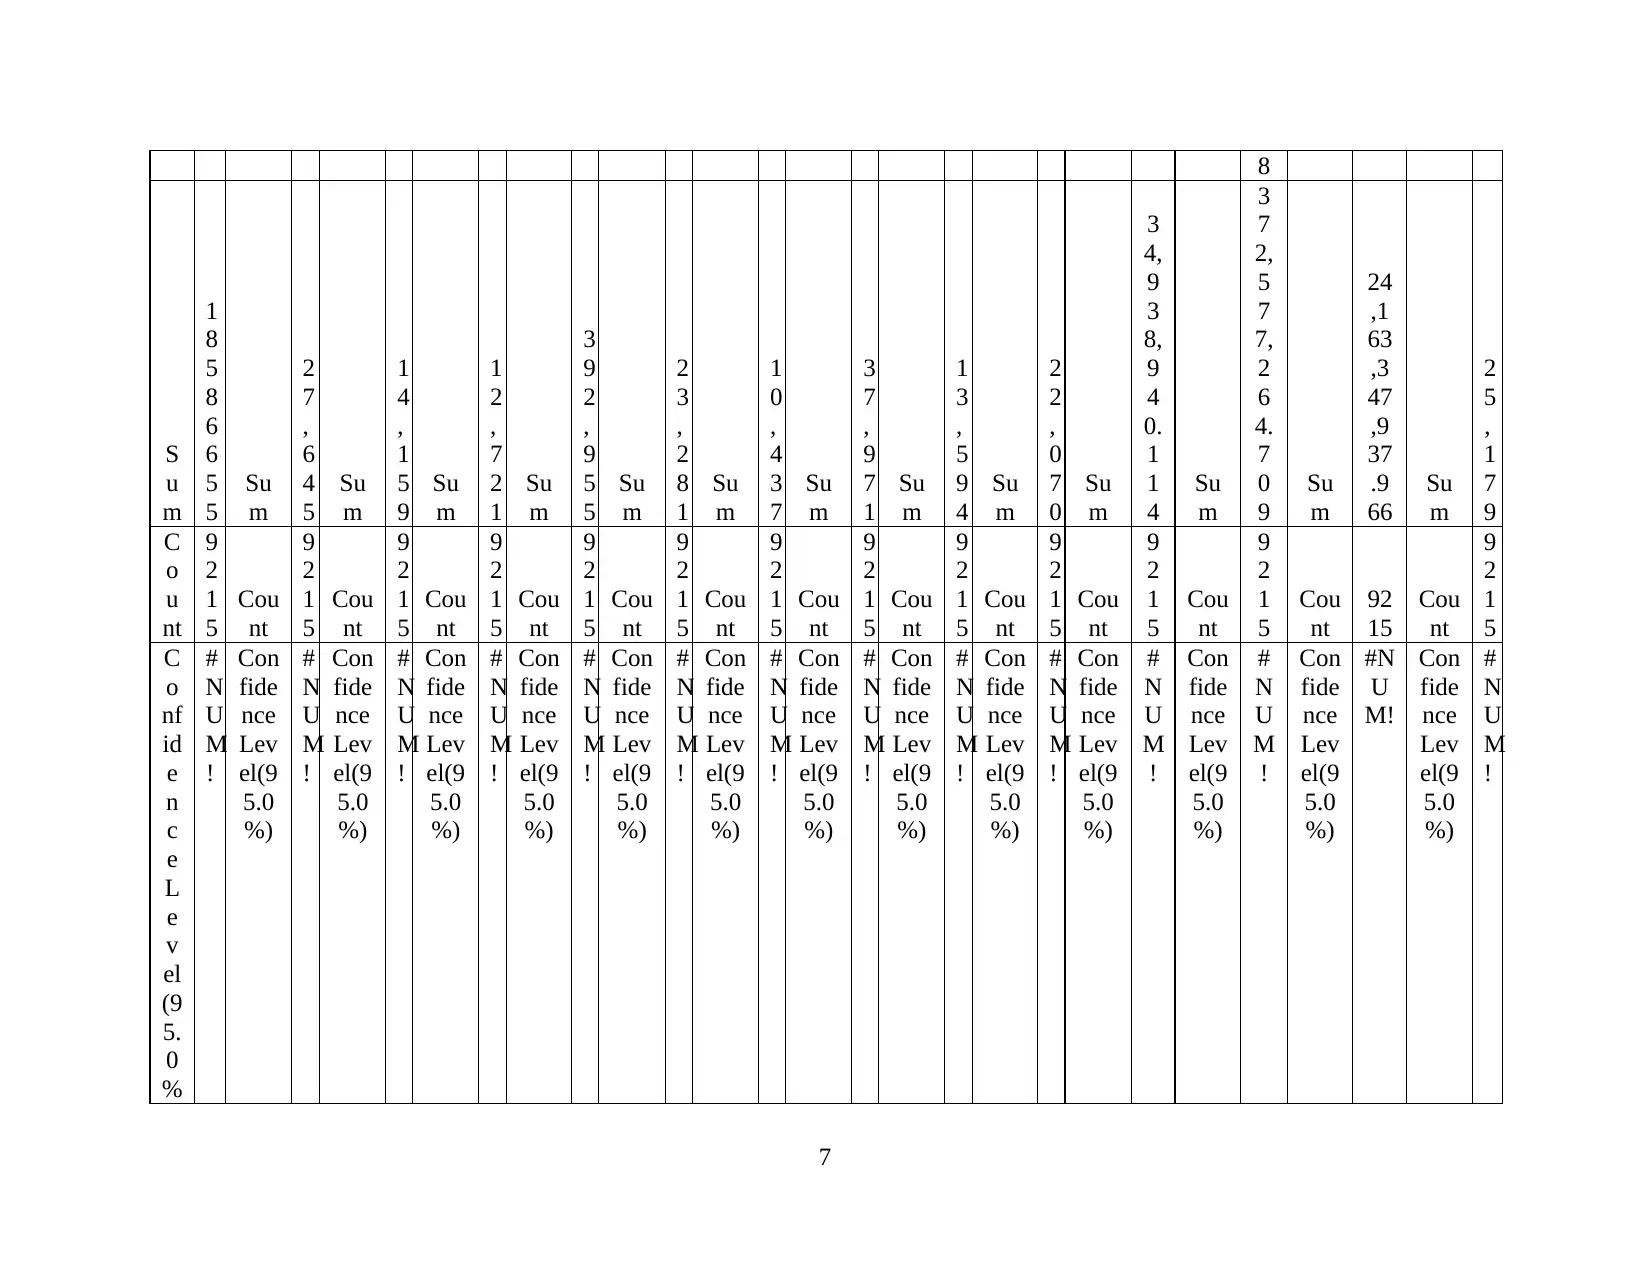
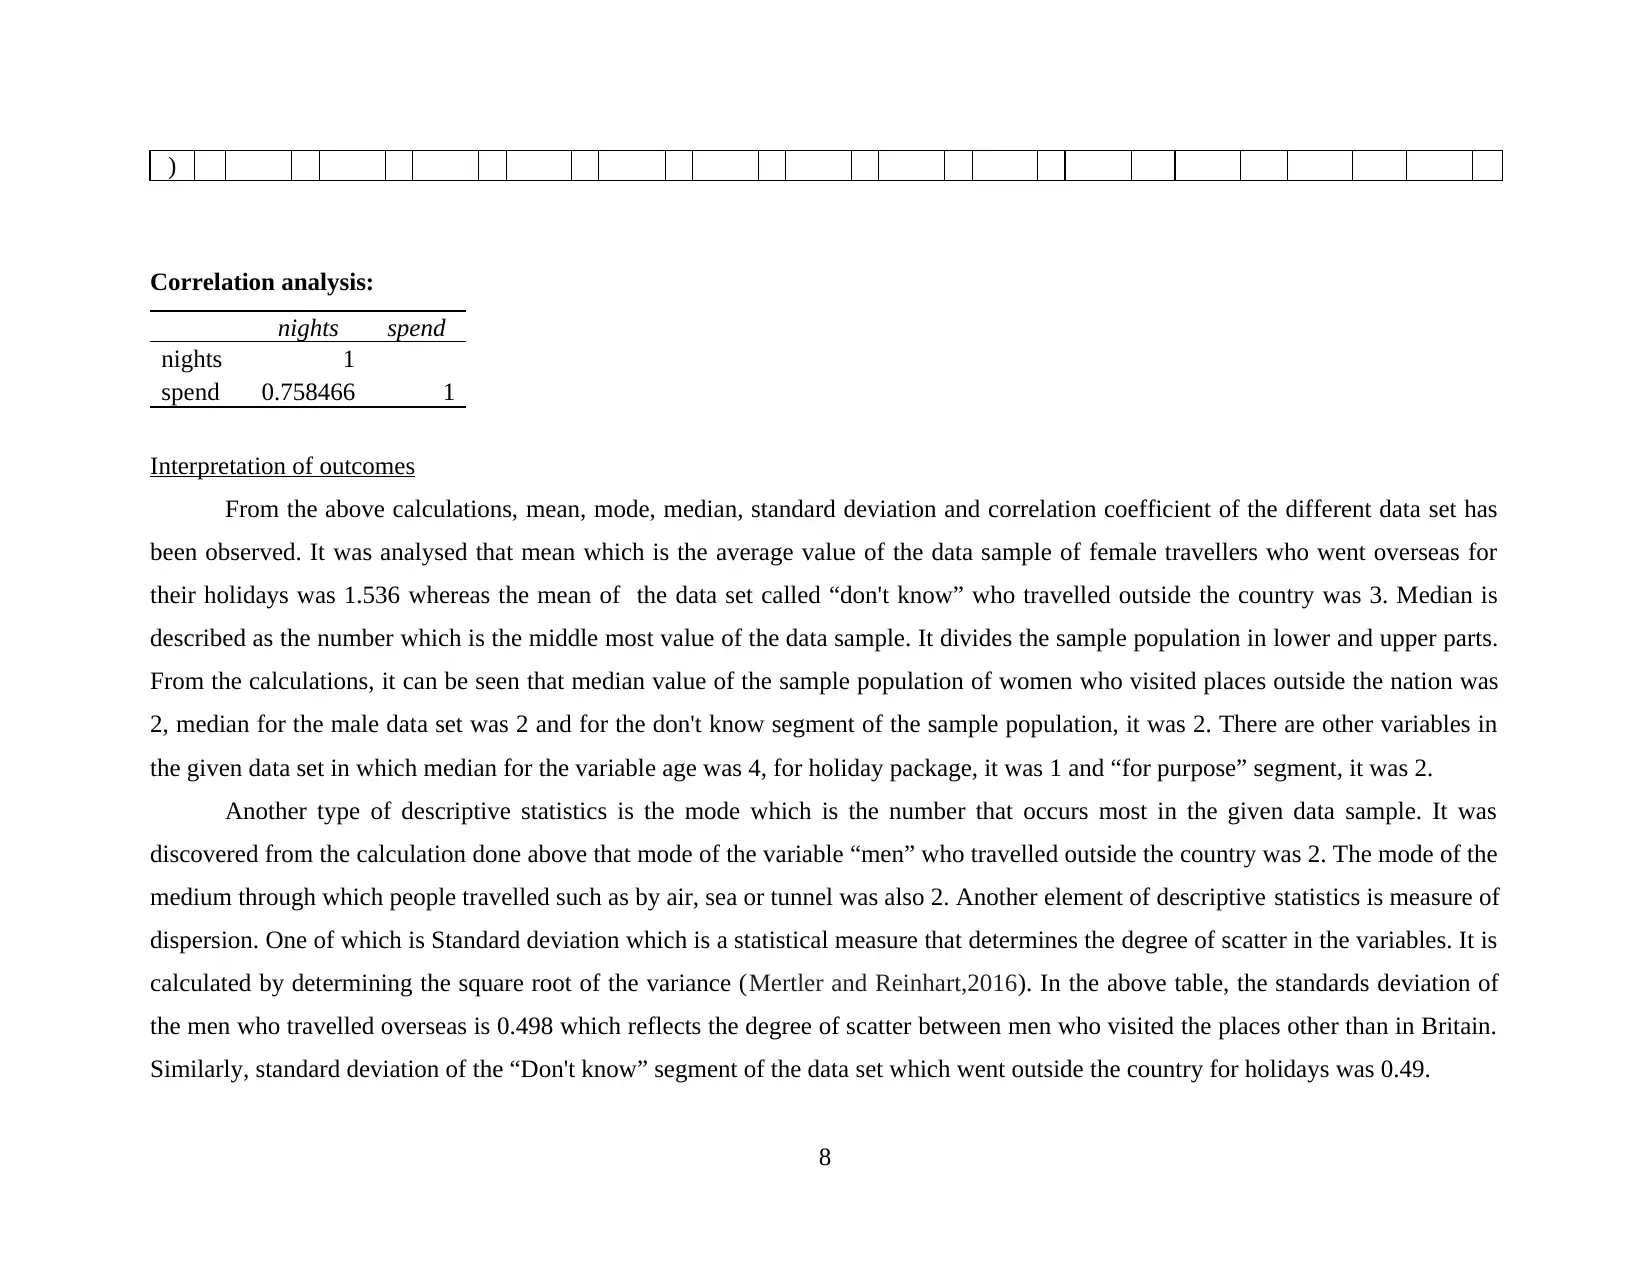
Correlation analysis:
nights spend
nights 1
spend 0.758466 1
Interpretation of outcomes
From the above calculations, mean, mode, median, standard deviation and correlation coefficient of the different data set has
been observed. It was analysed that mean which is the average value of the data sample of female travellers who went overseas for
their holidays was 1.536 whereas the mean of the data set called “don't know” who travelled outside the country was 3. Median is
described as the number which is the middle most value of the data sample. It divides the sample population in lower and upper parts.
From the calculations, it can be seen that median value of the sample population of women who visited places outside the nation was
2, median for the male data set was 2 and for the don't know segment of the sample population, it was 2. There are other variables in
the given data set in which median for the variable age was 4, for holiday package, it was 1 and “for purpose” segment, it was 2.
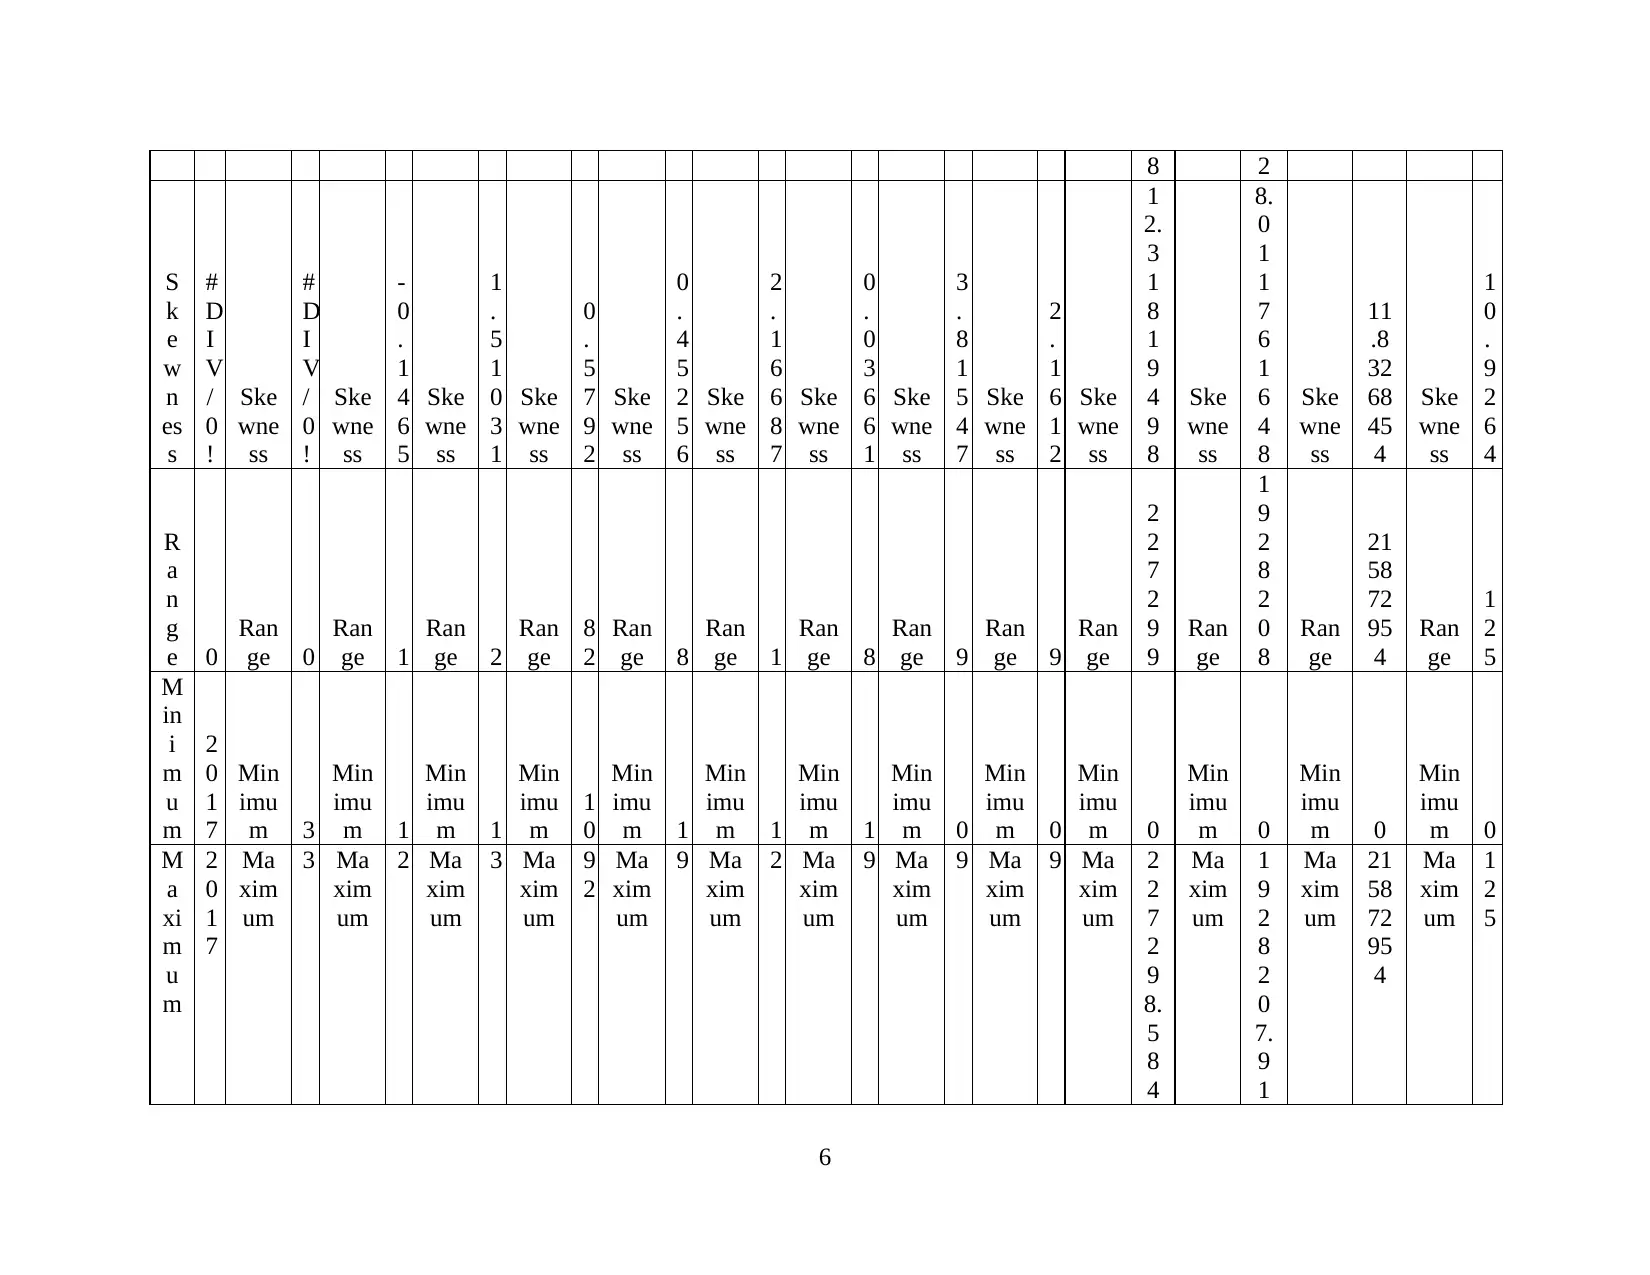
Another type of descriptive statistics is the mode which is the number that occurs most in the given data sample. It was
discovered from the calculation done above that mode of the variable “men” who travelled outside the country was 2. The mode of the
medium through which people travelled such as by air, sea or tunnel was also 2. Another element of descriptive statistics is measure of
dispersion. One of which is Standard deviation which is a statistical measure that determines the degree of scatter in the variables. It is
calculated by determining the square root of the variance (Mertler and Reinhart,2016). In the above table, the standards deviation of
the men who travelled overseas is 0.498 which reflects the degree of scatter between men who visited the places other than in Britain.
Similarly, standard deviation of the “Don't know” segment of the data set which went outside the country for holidays was 0.49.
8
Correlation analysis:
nights spend
nights 1
spend 0.758466 1
Interpretation of outcomes
From the above calculations, mean, mode, median, standard deviation and correlation coefficient of the different data set has
been observed. It was analysed that mean which is the average value of the data sample of female travellers who went overseas for
their holidays was 1.536 whereas the mean of the data set called “don't know” who travelled outside the country was 3. Median is
described as the number which is the middle most value of the data sample. It divides the sample population in lower and upper parts.
From the calculations, it can be seen that median value of the sample population of women who visited places outside the nation was
2, median for the male data set was 2 and for the don't know segment of the sample population, it was 2. There are other variables in
the given data set in which median for the variable age was 4, for holiday package, it was 1 and “for purpose” segment, it was 2.
Another type of descriptive statistics is the mode which is the number that occurs most in the given data sample. It was
discovered from the calculation done above that mode of the variable “men” who travelled outside the country was 2. The mode of the
medium through which people travelled such as by air, sea or tunnel was also 2. Another element of descriptive statistics is measure of
dispersion. One of which is Standard deviation which is a statistical measure that determines the degree of scatter in the variables. It is
calculated by determining the square root of the variance (Mertler and Reinhart,2016). In the above table, the standards deviation of
the men who travelled overseas is 0.498 which reflects the degree of scatter between men who visited the places other than in Britain.
Similarly, standard deviation of the “Don't know” segment of the data set which went outside the country for holidays was 0.49.
8
Paraphrase This Document
Need a fresh take? Get an instant paraphrase of this document with our AI Paraphraser
The correlation of the variables nights and expenditure was also calculated with the help of cost benefit analysis. It was seen
from the analysis that correlation between night and expenditure was 0.758. The range of the correlation coefficient is + 1 to – 1
(Karatoprak and Seker, 2019). The result is positive 0.758 which is near the perfect correlation that is 1. Positive correlation means
that variables in the data move in the same direction and shows a positive linear relationship between them. Thus, it can be said that as
the number of night stays increases, the expenditure also increases. This reflects the positive direction. This is good for TravelPac and
this analysis would help the holiday package company in formulating better strategies for attracting their customers.
Recommendations
From the calculations it was observed that people of the age group 16-35 traveled more often for the holiday and meeting
purpose. Thus, it is advisable for the TopDeck to target this segment for enhancing its customer base and market share. For this
purpose, the company employ some strategies for turining the potential customers into actual customers. TopDeck must focus on
lowering their price and must offer effective and attractive coupons and discounts so that large number of customers will get attracted.
This will eventually lead to higher customer base and profit margins for the company (Xiong and Liu, 2015, October). Effective
digital communication network leads to higher operational efficiency and better communication network which helps in reducing
language barrier and helps maintain strong relationship between customers and TopDeck company. Use of high tech technology like
information and communication technology, automated technology, artificial intelligence, personal website, online services helps in
attracting large number of customers by delivering more convenient and easy services. Effective hospitality services by giving
effective travel experience. This helps in higher satisfied customers and large number of customer retention (Forte and Portes, 2017).
Wide range of services provided by the company with more filtered choice offerings helps in attracting large number of
customers which leads to higher sustainable growth of the business and profitability. Availability of wide range of tour guides with
skilled knowledge and experience helps in proper guiding and make travelling more experienced and rejoice. Wide availability of
service like tour and travelling packages, hotels, resorts, motels, online services, transportation, etc. makes travelling more convenient
9
(Morris, Murray and Murphy, 2016). This offering of something extra than the standard services is known as up selling of the
products. This strategy is every effective and could help TopDeck in a tremendous way.
CONCLUSION
From the above conducted survey it has been examined that, maximum number of individual tend to travel every month to and
from UK for leisure time. They mainly use Airways as a means of transportation. It has been concluded that, TopDeck company will
focus on implementing high tech technology by offering wide range of personalized offers at economic price to increase high
customer base and profit (Alderighi, Nicolini and Piga, 2016). These conclusions were drawn from the calculations that were done by
the use of statistical measures such as descriptive measures that helped the managers in the TopDeck in their decision making
regarding how could they attract more customers, what additional services such as online services, etc., could be provided to the
people for enchaining their experience.
10
⊘ This is a preview!⊘
Do you want full access?
Subscribe today to unlock all pages.
Trusted by 1+ million students worldwide
1 out of 18
Related Documents


Your All-in-One AI-Powered Toolkit for Academic Success.
+13062052269
info@desklib.com
Available 24*7 on WhatsApp / Email
![[object Object]](/_next/static/media/star-bottom.7253800d.svg)
Unlock your academic potential
Copyright © 2020–2026 A2Z Services. All Rights Reserved. Developed and managed by ZUCOL.