BAO5747: International Portfolio Management - CBA Stock Analysis

Verified

Added on  2023/06/04

|5
|777
|148
Report
AI Summary
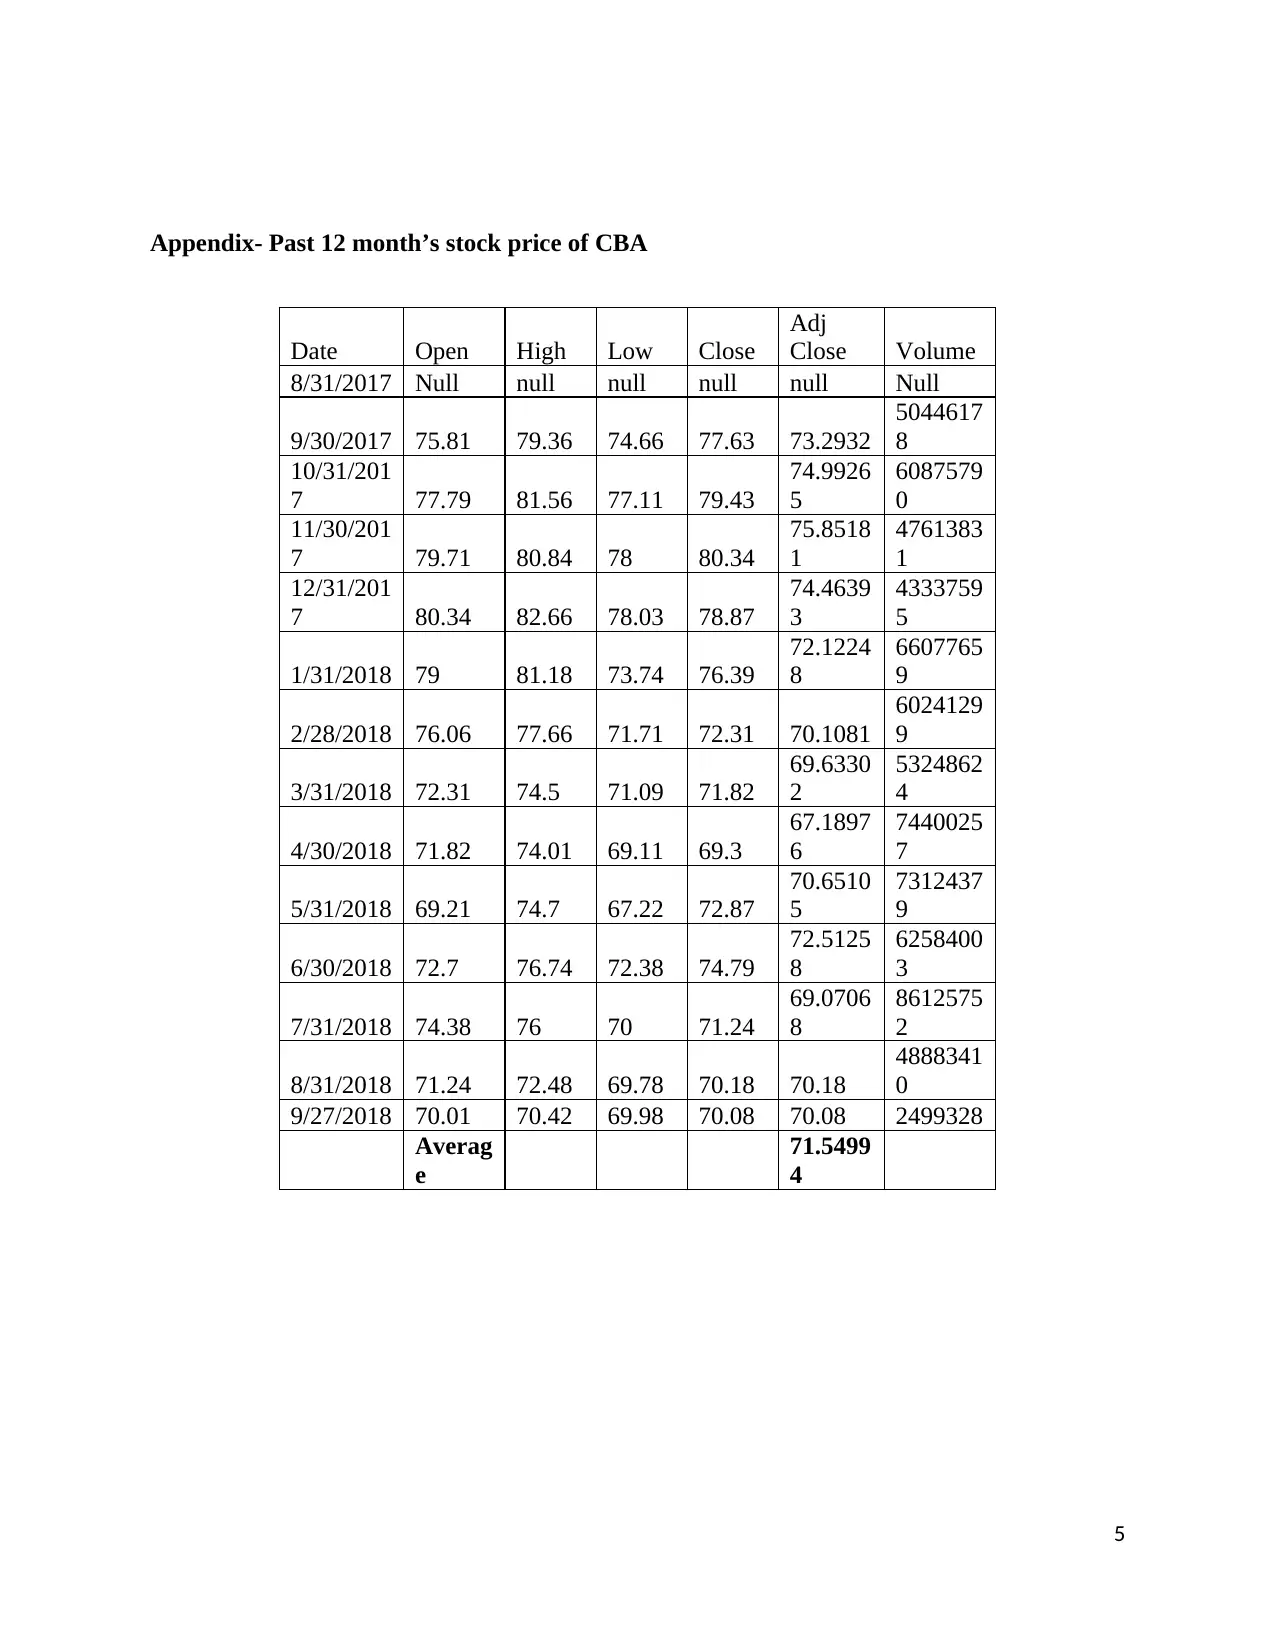
This report applies the dividend discount model to evaluate the stock price of CBA (Commonwealth Bank of Australia) and compares the theoretical price with the actual market price on the Australian Stock Exchange. The analysis reveals that the stock might be overvalued, suggesting a potential selling opportunity for investors. The report also discusses the efficient market hypothesis and its relevance to the findings, noting that market sentiments and information gaps can influence stock prices, potentially contradicting the hypothesis. It references prior research and includes historical stock price data in the appendix to support its analysis. Desklib provides a platform for students to access similar solved assignments and study resources.
tabler-icon-diamond-filled.svg

Contribute Materials

Your contribution can guide someone’s learning journey. Share your documents today.
Document Page
Finance
1
tabler-icon-diamond-filled.svg

Secure Best Marks with AI Grader

Need help grading? Try our AI Grader for instant feedback on your assignments.
Document Page
Question-5 (a)
The price computed applying the dividend discount model is AUD 46.27 while the average of
stock’s price of CBA prevailing on the Australian Stock Exchange is AUD 71.55 (Appendix).
Thus, it could be observed that the theoretical price computed under dividend discount model is
lower than the actual price of the stock. This implies that the stock is overvalued in the market
and hence the investor could go for selling the holdings in market (Lazzati and Menichini, 2015).
Question-5 (b)
The valuation done applying dividend discount model clearly depicts that the stock is overvalued
and it indicates that the investor should sell the stock. The investor has an opportunity to book
profits by selling the stocks in the market. The results of dividend discount model implies that
the true worth of the stock is AUD 46.27 however it’s been sold in the market at AUD 71.55.
This indicates the chances that the stock might decline in future so the investor should think of
selling the stock and exit the market by booking the profit.
However, it is notable that the theoretical price computed under the dividend discount model is
purely based on the fundamental figures; it ignores the impact of market sentiments on the stock
price movements. Further, the valuation models like dividend discount model or PE Multiple
Model also suffers from their own limitations. Thus, the results arrived at under these models
might not present true picture (Ivanovski, Ivanovska and Narasanov, 2015).
Question-5 (c)
The efficient capital market hypothesis entails that the price of stocks in the efficient market
imbibe the impact of new information. This implies that the price of stock prevailing on the stock
2
Document Page
exchange is always equal to its true worth and hence investors can not make gains by exploiting
the situation (Hamid, Suleman, Ali Shah, Akash, and Shahid, 2017).
According to efficient market hypothesis, there is no as such situation of undervaluation or
overvaluation of the stock. The price of stock on the exchange would always be equal to the
price computed applying technical or fundamental valuation models.
However, looking at the results of dividend discount model and actual price of CBA stock on
exchange, it appears that efficient market hypothesis does not hold true. The actual price of CBA
is AUD 71.55 while the price arrived at under dividend discount model is AUD 46.27. This
proves that the principle laid down in efficient market hypothesis are not holding true. Here, the
price of stock is changing due to change in market sentiments and market sentiments change
based on the new information. In practicality, an investor would always have that opportunity to
earn profit by exploiting the information gap (Hamid, Suleman, Ali Shah, Akash, and Shahid,
2017).
3
Document Page
Reference
Hamid, K., Suleman, M.T., Ali Shah, S.Z., Akash, I. and Shahid, R., 2017. Testing the weak
form of efficient market hypothesis: Empirical evidence from Asia-Pacific markets.
Ivanovski, Z., Ivanovska, N. and Narasanov, Z., 2015. Application of dividend discount model
valuation at Macedonian Stock Exchange. UTMS Journal of Economics, 6(1), pp.147-154.
Lazzati, N. and Menichini, A.A., 2015. A dynamic approach to the dividend discount
model. Review of Pacific Basin Financial Markets and Policies, 18(03), p.1550018.
4
tabler-icon-diamond-filled.svg

Secure Best Marks with AI Grader

Need help grading? Try our AI Grader for instant feedback on your assignments.
Document Page
Appendix- Past 12 month’s stock price of CBA
Date Open High Low Close
Adj
Close Volume
8/31/2017 Null null null null null Null
9/30/2017 75.81 79.36 74.66 77.63 73.2932
5044617
8
10/31/201
7 77.79 81.56 77.11 79.43
74.9926
5
6087579
0
11/30/201
7 79.71 80.84 78 80.34
75.8518
1
4761383
1
12/31/201
7 80.34 82.66 78.03 78.87
74.4639
3
4333759
5
1/31/2018 79 81.18 73.74 76.39
72.1224
8
6607765
9
2/28/2018 76.06 77.66 71.71 72.31 70.1081
6024129
9
3/31/2018 72.31 74.5 71.09 71.82
69.6330
2
5324862
4
4/30/2018 71.82 74.01 69.11 69.3
67.1897
6
7440025
7
5/31/2018 69.21 74.7 67.22 72.87
70.6510
5
7312437
9
6/30/2018 72.7 76.74 72.38 74.79
72.5125
8
6258400
3
7/31/2018 74.38 76 70 71.24
69.0706
8
8612575
2
8/31/2018 71.24 72.48 69.78 70.18 70.18
4888341
0
9/27/2018 70.01 70.42 69.98 70.08 70.08 2499328
Averag
e
71.5499
4
5
chevron_up_icon
1 out of 5
circle_padding
hide_on_mobile
zoom_out_icon
logo.png

Your All-in-One AI-Powered Toolkit for Academic Success.

Available 24*7 on WhatsApp / Email

[object Object]