Real Estate Investment International: Market Analysis and Strategies
VerifiedAdded on 2023/06/05
|32
|12912
|382
Report
AI Summary
This report provides a comprehensive analysis of international real estate investment, starting with an examination of the law of demand and supply in real estate markets and how they influence property pricing. It explores the identification of profitable markets, explains market characteristics based on demand curves, and analyzes the net absorption method used in rental markets. The report also investigates the impact of income levels, credit availability, and interest rates on net absorption, providing insights into market dynamics. Furthermore, it delves into the real estate market cycle using the stock flow model, the influence of tenant heterogeneity and geographic dispersion on vacancy rates, and how life stages affect property demand. Finally, the report discusses the impact of interest rate increases and inflation on the real estate market, analyzing supply and demand imbalances and their implications for the future.

REAL ESTATE
INVESTMENT
INTERNATIONAL
INVESTMENT
INTERNATIONAL
Paraphrase This Document
Need a fresh take? Get an instant paraphrase of this document with our AI Paraphraser
Table of Contents
QUESTION-1..................................................................................................................................4
a) Law of demand and law of supply in markets of real estate....................................................4
b) profitable market for real estate investments...........................................................................5
c) explanation of market characteristics on the basis of demand curve.......................................6
D).................................................................................................................................................7
e) Changes to the income level, credit availability, cost of credit, effect on the Net Absorption
......................................................................................................................................................8
F)..................................................................................................................................................9
a)................................................................................................................................................11
b)................................................................................................................................................12
c)................................................................................................................................................13
d)................................................................................................................................................15
e)................................................................................................................................................16
QUESTION-3................................................................................................................................17
A) Cycle of the real estate market based on stock flow model..................................................17
B) Degree of heterogeneity of tenants and degree of geographic dispersion of existing stock
affects the vacancy rate which is available in the market..........................................................18
C) Discussing the demand on the type and size of properties that an adult person creates to the
several stages of life...................................................................................................................19
D) Commenting on the upcoming increase of the interest rates from the European central bank
the third semester of 2022 and discussing how inflation impacts the interest rate and what are
the consequences on the real estate market................................................................................20
QUESTION-4................................................................................................................................21
A)...............................................................................................................................................21
B)................................................................................................................................................23
(c) Analysis of excess demand or excess supply of residential stock in the end of year 2024..24
(d)...............................................................................................................................................25
(e)...............................................................................................................................................27
(f)................................................................................................................................................28

REFERENCES..............................................................................................................................30
⊘ This is a preview!⊘
Do you want full access?
Subscribe today to unlock all pages.
Trusted by 1+ million students worldwide
QUESTION-1
a) Law of demand and law of supply in markets of real estate
Law of demand refers to the process which states due to higher price buyer will demand
less. On the other hand law of demand depicts due to higher pricing, sellers would supply more.
In the context of real estate law of demand and supply reflect to the point which shows
equilibrium price of property. In significant term demand and supply work as one another in the
case until and unless the property equilibrium is reached (Ji, Marfatia and Gupta, 2018). The
lower supply might lead towards pricing which could be happen in bidding wars. Such conflict
issues ends when seller accept to offer and remove unit from supply availability. Although,
higher demand for properties in country aligned with lack of quality property supply. Whereby
price of house tend to hike accordingly. Apart from this weaker economy as well as oversupply
of properties direct towards decreased or no demand for housing in which price factors are tend
to fall at that point.
Real estate is the tangible asset which is made up of land and property, it is unmovable which is
also subject towards demand and supply. It can be said that price of houses as relevant to stocks
as well as bonds are dependent over law of demand and supply. It can be described effectively in
terms such as:
Higher the demand, tend to rise high price
More supply tend to decrease
Thus, real estate market is an appropriate example for the law and demand that also reflects to
how good these aspects can favour in relevant industry. The theory in this stage can termed as
one of the most basic principle in study of economics. Demand and supply is most significant
term that work against each other to reach up to the point at which equilibrium price is achieved.
In that case price remains equal for demand in market.
Moreover, there are some factors which impact real estate demand and supply. The fine value
attributed to demand and supply in marketplace is not easy aspect in terms of real estate markets.
It consumes more time for constructing new houses or for fixing up existing one to place into
market. In similar terms, real estate is very different from other industries which covers more
time for buying and selling procedures. The transactional activities will differ in such case and
would require time to consummate as such making real estate illiquid. Some factors immensely
influence housing demand consisted with lower borrowing cost and interest rates as well.
Paraphrase This Document
Need a fresh take? Get an instant paraphrase of this document with our AI Paraphraser
Whereas, if rate of interest is reduced, individual willingly access over debt as they can afford
such aspects on the basis of monthly outlay. Thus, it can be said that real estates markets are rely
over supply and demand through which it is seemed as preferable indicator in relevant industry.
b) profitable market for real estate investments
From the above diagram it has been figured out that P2 is the component in which price
of product increases which impact over decreased demand and increased supply aspects.
Furthermore, P1 indicates the price factor is higher which impact in increased demand and
shortage of supply. On the other hand, P* is the core point which denotes demand and supply are
equal which makes the perfect pair. It is known as equilibrium in which these two points
whereby demand for product equivalent with quantity supplied. It means there is no surplus as
well as shortage of good. Shortage appears in situations when demand surpass supply or when
price is in lower extent (Liow and Huang, 2018). For real estate investments P* level is accurate
which can provide profits for business to keep running on smooth basis. Supply and demand are
the relevant frameworks that can be utilized to justify and prediction of equilibrium quantity and
price of services being offered in housing market. The point over supply curve depict quantity
which suppliers fain to sell for specific price. On the other hand point on demanding curve
reflect quantity which individual is willing to buy at particular price. These interactions of
demand supply shows that equilibrium price as well quantity would prevail in marketplaces.
Moreover, in such competitive market supply and demand framework usually applied which
exhibits competition varying in two major conditions such as:
Having two or more buyers and sellers who might be small relative to markets
The product which is produced by sellers can be perfect substitutes.
In such competitive environment buyer and sellers access over given price as their actions does
not impact over price in industry. Thus, it can be concluded from the above graph that P*
indicates the equilibrium price which is the core point. It is beneficial to understand market work
criteria. Similarly, through such pricing methodology if price makes differentiation from
equilibrium pricing then it would imbalance among supply and demand which may provide
buyer and supplier with incentive to act differently. There is immense support for market
predictions as evidence from experimental marketplaces. This framework of supply and demand
support with relevant predictions regarding movement of pricing.
In the context of housing market business it can be stated on the basis of graph if both buyers and
sellers are inclined for exchange of quantity at price. At that single point demand and supply are
into balanced terms, the determination of price is highly depended on these factors.
c) explanation of market characteristics on the basis of demand curve
Demand curve in the context of economics is graphical representation of relationship
among price of product and quantity of product demand. From the graph it shows that elastic
demand is the one whereby changes in quantity demanded occurs due to change in price. On the
other hand inelastic demand refers to the process in which change for quantity demand appears
because of small change in price (Sadayuki, Harano and Yamazaki, 2019). Price is the most
essential factor in terms of identifying elasticity. It can be said that demand remains inelastic as
demand for product or service remains unchanged even if the price changes. The sensitive term
of price change are crucial while selecting markets for investments in real estate. For instance, in
market where real estate demand is sensitive in lower terms and more preferred with investment
point of view even the price rise in that case there would be decrease in demand. Thus,
sensitivity to real estate demand towards change in price is measured through price elasticity of
demand.
In the context of real estate business inelastic demand is more suitable as it does not
affect the demand in the cases when change in price takes place. The inelastic aspects drive the
purpose for business in better equipped terms towards profit maximization, also it is protected in
efficient terms for economic downturns. It is beneficial for the markets of real estates as price
factors increase but the consumer buying habits remains same which might provide various
benefit to business. The demand curve of perfectly inelastic goods are stated as vertical line
presented in graph as quantity demanded is similar with price changing factors. Also, supply is
also inelastic in that situation of unique product. It does not matter how customers are willing to
pay but there cannot be more than one primary version of it.
On the other hand elastic demand is riskier for real estate markets, these places includes
houses available for sale and numerous of buyer looking for one to purchase. While there are
some basic economic factors which impact to level of elasticity in housing markets. For instance,
if most of the people look further to buy home, the price will rise. While of these homes are
listed for sale which relates to amount of interested buyers in which price remains decreased.
Buying of house tend to have higher elasticity of demand. The elasticity is riskier for business as
⊘ This is a preview!⊘
Do you want full access?
Subscribe today to unlock all pages.
Trusted by 1+ million students worldwide
loan interest rates and borrowing cost is in higher terms. Hence, it can be determined through
availability of substitute in particular market and segment. For instance, property having low
substitutes might have decreased elastic demand than segment having more substitutes. Hence,
investor should pay more interest towards project and markets with inelastic demand price as
price factor increase it would increase revenue as well (Joghee, Alzoubi and Dubey, 2020). It
would cause due to reduce in demand which would be not enough for eliminating gains from
increased price and rent as well. Moreover, if the price will goes up the quantity demand will fall
down but in that case revenue will be uplift due to decrease in Q is smaller than hike in P.
D)
In rental market it is seen that generally Net absorption method is being used. Since under
this method just supply and demand dynamics are taken into consideration. It is very essential
since if only one side is being undertaken then will impact the performance and quality of final
outcomes.
It can also be summarized as the difference between both commercial space which is
vacated in certain phase of time, by organizations, companies, tenants etc. this is highly useful
due to deeper insights it gives and paves the way forward (Jawad and et.al., 2018)
The gross absorption is also being used but due to some perilous notions it have, the
method is not given preference. It just measures the total square feet which are leased or
absorbed for sort of vacated space during a certain phase of time. This does not perceive both
dynamics but rely on a singe set of notions.
It would not be unfair to elaborate that it takes just one side of the picture into focus, total
space which is occupied, is definitely an important thing yet on the basis of the single set of
knowledge the entire decision can not be made. Just occupied area gives information about
possessions but the balance can not be deciphered which is salient thing for making decision
pertaining to rental market.
Keeping the shortcomings of the gross method the Net absorption method comes with
some advantageous points. It helps in installation of deeper understanding. The real estate market
is quite dynamic and in absence of both market supply and demand it is not handy to make
decisions (Kjeld and et.al., 2021)
It is supposed to be more handy and lucrative since it discloses to the investors that
should they make investment or not. It gives deeper insights of demand and supply. Weather the
Paraphrase This Document
Need a fresh take? Get an instant paraphrase of this document with our AI Paraphraser
demand is supposed to be higher or would be going down. These ideas pertaining to changes in
the occupied space offers greater understanding to the investor. This is the most significant
reason behind its preference when it comes to measurement of real estate.
The modern market of real estate is quit rigid and does not give that much resilience
while making decision. The extraneous forces are also impacting these decisions to the fullest
extent so in such predicaments an organization can not rely on just single side of a game, there is
inevitable need to perceive all the relevant areas in attempt to make rational decisions.
For example- If Net Absorption method is being used then-
Net absorption= Square feet which is physically occupied- Square feet which is physically
vacant during a certain period (Yadav and et.al., 2021)
By applying this formula the outcomes can be perceived and better judgement can be
driven. It may be negative or positive since the difference between occupied and vacant real
estate do not follow any pre intended trend. So it would be fair enough to decipher that net
absorption method is relatively better.
e) Changes to the income level, credit availability, cost of credit, effect on the Net Absorption
Changes in different economic factor creates issues and challenges for businesses in the
overall real estate industry in order to grow. These aspects are beneficial for fluctuating the
overall performance of the business in the industry.
Income Level
There is a significant influence on the income levels of the people due top increase in the
interest rates which is a difficult factor for the real estate businesses to face. There are changes in
the spending capacity of the people which has a major effect their overall sustainability in the
industry. The income decreases for the people which is not suitable for the retail industry to
prosper as more people will not be able to achieve a significant amount of success that has a
direct impact on the success of the business (Aalbers, 2019). Due to these aspects the business
may decrease their overall opportunities to grow and prosper.
Credit availability
Availability of the credit decreases in the real estate industry due to these factors which
has a significant influence on the overall performance of the companies in the business
environment. Due this factor people are not able to make an investment in fulfilling their
purchase decisions and but their desired properties and buildings. This is inappropriate for the
businesses to gain a better competitive advantage in the industry and increase their overall
success and development in the industry. These factors may lead towards the decrease in the
demand for the properties in the industry which is not suitable for enhancing the overall
sustainability of the business in the industry.
Cost of credit
The cost of borrowing money from the market increases due to an increase in the interest
in the real estate business. These aspects may have a negative influence on the overall
development of the company that are essential for enhancing the availability of the results. The
credit rates will significantly increases due to these problems which may not be crucial for the
companies to grow and achieve effectiveness in the overall business environment (Gopy-
Ramdhany and Seetanah, 2022). These changes in the interest rates are not suitable to manage
the rate of the credit which is a crucial element of the real estate industry. Disinterest of people
can be experienced due to these factors which is not suitable for the overall growth and
sustainability of the business in the industry.
Effect on Net Absorption
This initiates changes in the net absorption rates in the industry which have a major effect
on the overall performance of the business in the industry. These aspects are considered to be
effective that are crucial for the overall development of the company which plays a specific part
in the enhancement of the competitive business environment. These aspects are considered to be
creating difficulties for the business to manage their quality of output and gain benefit in the
business environment. Due to these aspects the business is able to perform specifically which has
a negative influence on the overall development of the industry.
F)
There are two instances are given, where the prices are changing with same rate. The
both areas are experiencing same surge in term of prices which is 10% but the locations are
different. Limassol is one of the most costly city, which is highly famous for its real estate prices
which are quite dynamic and it is next to the apex level of luxury.
The elasticity concept of real estate tells that if there is boost up in the prices of real estate
then to which extent it would impact the real estate demand. This relationship can not be cited
⊘ This is a preview!⊘
Do you want full access?
Subscribe today to unlock all pages.
Trusted by 1+ million students worldwide
normal since the real estate sector is also hugely impacted by range of elements which decides its
prices and demand, supply etc (Kianfar, 2019)
Keeping the above raised notions in mind it can be articulated that both the locations
which are given in the case would not be having the same level or degree of elasticity. There will
be difference between them. The prices at lpsonas in Limassol and centre of Limassol are
changing with the same pace. But the final outcomes would be same.
As it is known that the central area of Limassol would be highly inelastic in nature. Since
it is located at centre of the city and having its great prominence for the people who are looking
to occupy land in any form. This form may be lease, ownership, rental etc. but the fact is very
much clear that if they are looking for the land then it would somehow increase the demand
factor and it would lead it be highly inelastic.
Relatively the lpsonas in Limassol would be less inelastic or may be elastic to certain
degree. Relatively the Lpsonas location would be elastic so if any changes are made in price it
will experience bigger decrease since the investors or potential customers would not like to
invest there due to the nature this property possesses (Gholizadeh‐Roshanagh and Zare, 2019)
At the same time, the property existing at centre of the city would be having its higher
importance which will lead it to be inelastic in nature. So if the prices are hiked then lpsonas in
Limassol would be experiencing biggest decrease in demand for the apartments.
This is happening due to elasticity factor since both the areas are not having their same
importance. And if it is tried to be perceived in simple term, then can be said that the location
which is having its more importance due to any reason, if experiences surge in price yet would
be having great demand. At the same time, relatively the location which is not that much
important will face relatively higher topple if prices are surged.
It can be deciphered that if the prices at Lpsonas in Limassol are higher and at the same time, the
prices of centre of Limassol are also higher with equal rate yet the decrease in demand of these
apartments would not be same. Elasticity of real estate will be leading to this notion and location
with greater importance would survive this jump in price with lesser impact on the demand.
QUESTION 2
Paraphrase This Document
Need a fresh take? Get an instant paraphrase of this document with our AI Paraphraser
a)
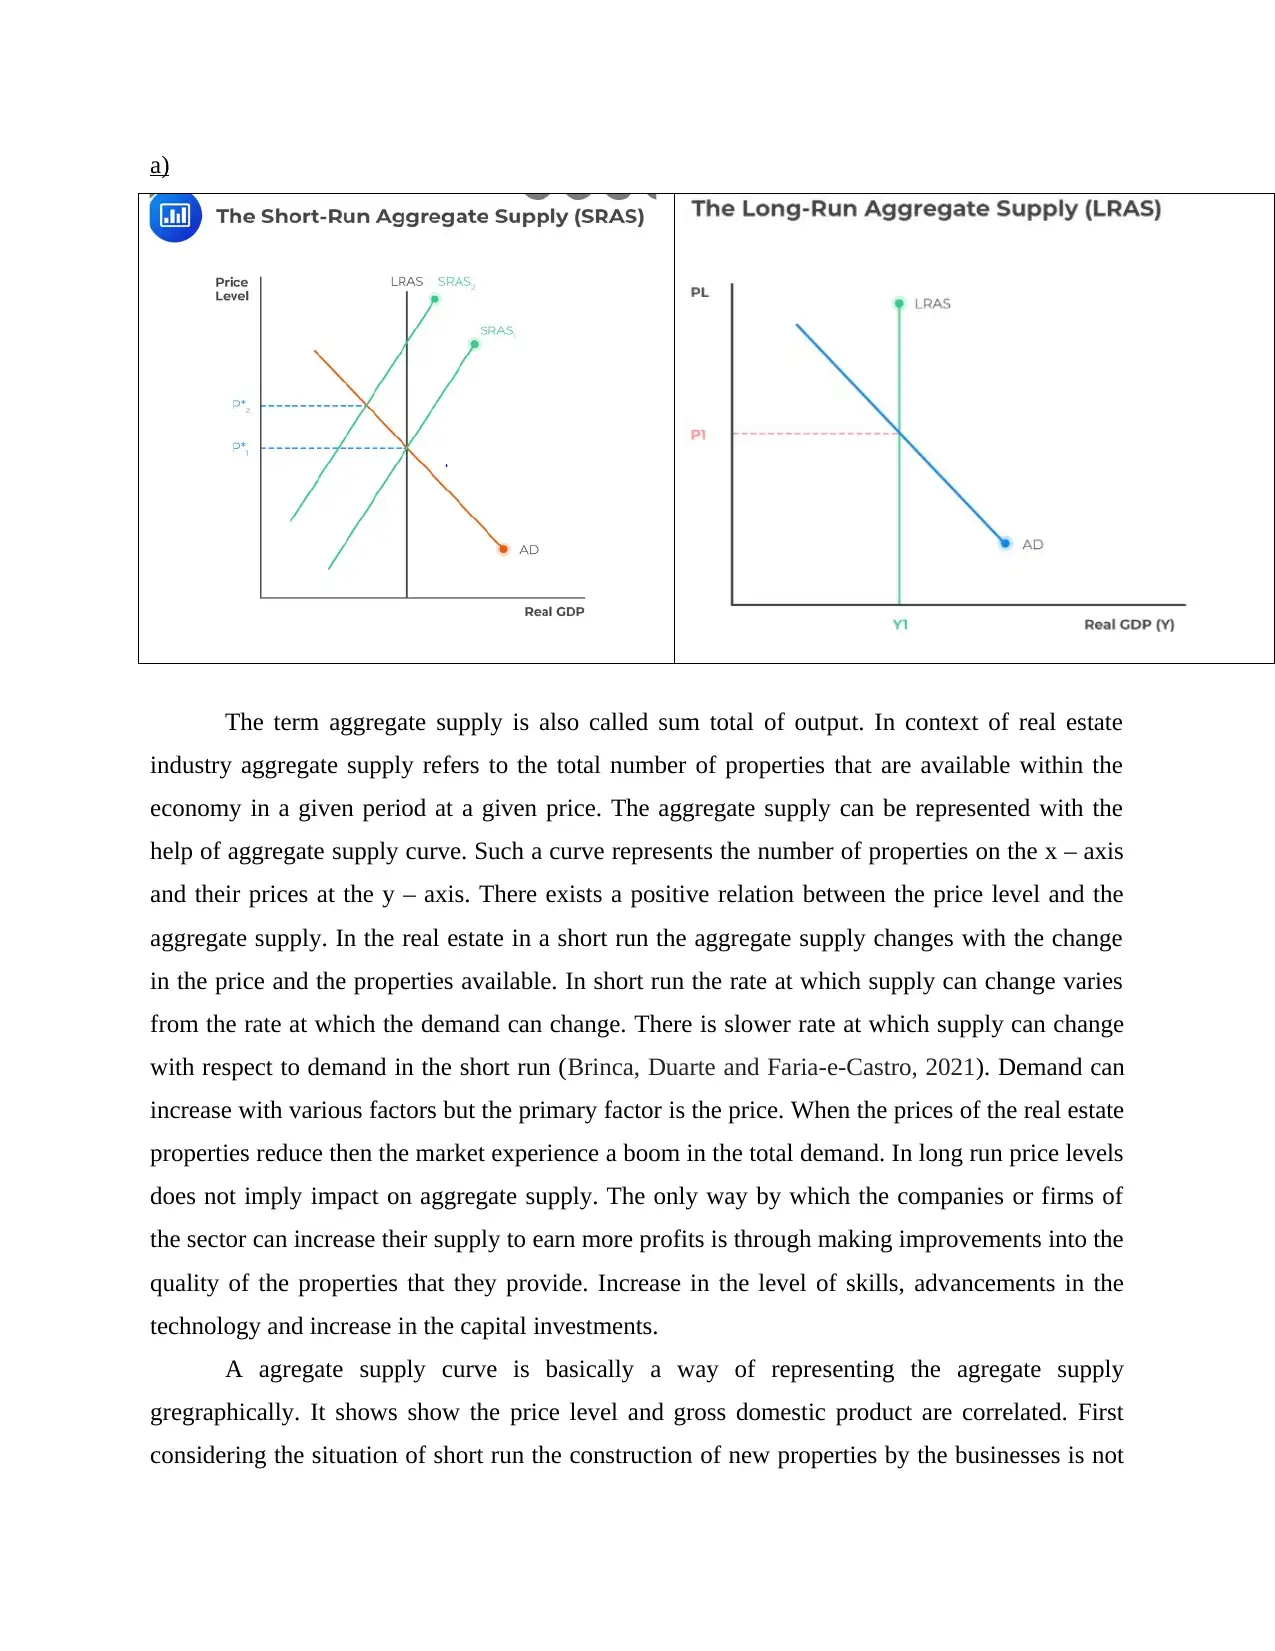
The term aggregate supply is also called sum total of output. In context of real estate
industry aggregate supply refers to the total number of properties that are available within the
economy in a given period at a given price. The aggregate supply can be represented with the
help of aggregate supply curve. Such a curve represents the number of properties on the x – axis
and their prices at the y – axis. There exists a positive relation between the price level and the
aggregate supply. In the real estate in a short run the aggregate supply changes with the change
in the price and the properties available. In short run the rate at which supply can change varies
from the rate at which the demand can change. There is slower rate at which supply can change
with respect to demand in the short run (Brinca, Duarte and Faria-e-Castro, 2021). Demand can
increase with various factors but the primary factor is the price. When the prices of the real estate
properties reduce then the market experience a boom in the total demand. In long run price levels
does not imply impact on aggregate supply. The only way by which the companies or firms of
the sector can increase their supply to earn more profits is through making improvements into the
quality of the properties that they provide. Increase in the level of skills, advancements in the
technology and increase in the capital investments.
A agregate supply curve is basically a way of representing the agregate supply
gregraphically. It shows show the price level and gross domestic product are correlated. First
considering the situation of short run the construction of new properties by the businesses is not
possible in context of both whether the properties are to be contructed for keeping them as rental
properties or contructed for the purpose of selling such properties. Only way to meet the demand
in the short run is thorugh lending the properties that becomes vacant or selling of them. But in
the long run there is no retriction regarding the factors of production that can be changed both
the variable and the fixed factors of production can be changed. The distinctinct of the various
production factors as the variable and fixed factors in the long run vanishes as all the factors
becomes the variable factors (Breza, Kaur and Krishnaswamy, 2019). In short run the factors that
are variable can be changed. The shift in the curve can be through an increase in the wages or the
raw materials. This will bring a shift to left. No fixed factors are there in context of long run.
There is enough funds available for the purpose of providing for the wages, etc. in addition to
this the factors like labor, capital, technology can also to changed. The LRAS cruve is static, and
the quantity that is supplied remains one only.
b)
Given stock flow equation = St = St-1 (1 – d) + Ct
Total Supply in 2020 = 12000
Total Supply in 2021 = 13500
Depreciation rate = 10%
Therefore, figure of 12000 i.e., total supply in 2020 is represented by St-1 whereas, figure
of 13500 is the total supply in 2021 which is represented by St. Also, a reasonable depreciation
rate assumed here is 10%. Thus, after putting these values in the above stock flow equation the
value of Ct comes to 2700. This figure of 2700 infers and shows the number of residential
properties built newly in 2021.
St = St-1 (1 – d) + Ct
13500 = 12000 (1-0.1) + Ct
Ct = 2700 residential properties.
Therefore, the above equation determines the total supply of residential properties in
2021 which is calculated by ascertaining total supply in 2020 and decreasing them with the rate
of depreciation and adding newly built residential properties within 2021 to it which came to
2700 properties from the above calculation. Thus, stock includes any quantity which can be
effectively measured at a specific point of time while flow defines the quantity which can be
effectively measured over a specified period of time.On the basis of this it can be articulated that
⊘ This is a preview!⊘
Do you want full access?
Subscribe today to unlock all pages.
Trusted by 1+ million students worldwide
1 out of 32
Related Documents


Your All-in-One AI-Powered Toolkit for Academic Success.
+13062052269
info@desklib.com
Available 24*7 on WhatsApp / Email
![[object Object]](/_next/static/media/star-bottom.7253800d.svg)
Unlock your academic potential
Copyright © 2020–2026 A2Z Services. All Rights Reserved. Developed and managed by ZUCOL.